

Abstract
Cardiomyocytes have intracellular diffusion restrictions, which spatially compartmentalize ADP and ATP. However, the models that predict diffusion restrictions have used data sets generated in rat heart permeabilized fibers, where diffusion distances may be heterogeneous. This is avoided by using isolated, permeabilized cardiomyocytes. The aim of this work was to analyze the intracellular diffusion of ATP and ADP in rat permeabilized cardiomyocytes. To do this, we measured respiration rate, ATPase rate, and ADP concentration in the surrounding solution. The data were analyzed using mathematical models that reflect different levels of cell compartmentalization. In agreement with previous studies, we found significant diffusion restriction by the mitochondrial outer membrane and confirmed a functional coupling between mitochondria and a fraction of ATPases in the cell. In addition, our experimental data show that considerable activity of endogenous pyruvate kinase (PK) remains in the cardiomyocytes after permeabilization. A fraction of ATPases were inactive without ATP feedback by this endogenous PK. When analyzing the data, we were able to reproduce the measurements only with the mathematical models that include a tight coupling between the fraction of endogenous PK and ATPases. To our knowledge, this is the first time such a strong coupling of PK to ATPases has been demonstrated in permeabilized cardiomyocytes.
Introduction
The viewpoint that the cell is a well mixed reactor is being replaced by the understanding that metabolic regulation depends not only on enzyme kinetics, but also on the location and colocalization of enzymes and substrates. Thus, metabolism can be considered as a network of metabolic modules, which are spatially compartmentalized to optimize energetic communication between energy-producing and energy-consuming parts of the cell (1). It has been suggested that compartmentalization of adenosine nucleotides (ADP and ATP) by intracellular diffusion restrictions plays a vital role in regulation of heart energetics (2). In rat heart, the apparent magnitude of diffusion restrictions increases during ontogeny (3) and is diminished by ischemia-reperfusion damage of the tissue (4). Similar diffusion restrictions have been identified in cardiomyocytes of ectothermic vertebrates (5) and have been found to depend on acclimation conditions in turtles (6). In comparison, cultured cardiomyocytes, which do not contract against a workload and depend more on glycolytic than aerobic metabolism, have almost no diffusion restrictions (7). Taken together, this suggests that the magnitude of diffusion restrictions is closely related to cardiac mechanical performance and aerobic capacity.
Permeabilized heart muscle fibers or permeabilized isolated cardiomyocytes have been extensively used to study the diffusion restrictions that compartmentalize the intracellular environment (8, 9, 10, 11, 12). In those studies, several approaches have indicated that the diffusion of ATP and ADP from the solution surrounding the cells to the adenine nucleotide translocase in the inner mitochondrial membrane is restricted by the mitochondrial outer membrane as well as in the cytosol. According to our models, the cytosolic diffusion restrictions leading to intracellular compartmentalization and functional coupling between ATP-consuming and ATP-producing organelles are most probably localized in certain areas of the cell (12, 13). The high level of diffusion restrictions indicates that they are formed by cytoskeleton proteins (14), leading, together with the intracellular organization of mitochondria and sarcoplasmic reticulum (SR), to anisotropic diffusion of molecules (15).
Most of the studies pointing to diffusion restrictions between solution and intracellular environment have been made on permeabilized heart muscle fibers (10, 11, 16). The results from these studies have also been used as input for mathematical models (12, 13, 14). However, fiber preparations can be heterogeneous in terms of diffusion distance, as compared to a suspension of permeabilized cardiomyocytes. As a result, the use of cardiomyocytes to study intracellular energy transfer has increased recently (5, 17, 18). However, a systematic study of intracellular diffusion patterns is needed for input into mathematical models. This study was undertaken to fill the void of data on intracellular energy transfer recorded on permeabilized cardiomyocytes and to use this data set for analysis with a simple mathematical model.
The aim of this work was to analyze the intracellular diffusion of ATP and ADP in rat cardiomyocytes. To do this, we refined the method used previously to isolate rat cardiomyocytes to obtain a high yield of Ca2+-tolerant cells that would contract upon electrical field stimulation. Intracellular energetic communication between mitochondria and ATPases was approached from several angles, including determination of respiration rate, ADP concentration in media, and ATPase rate under several conditions. The data were analyzed using mathematical models that reflect different levels of compartmentalization of the cell.
Materials and Methods
Experimental procedures
Adult outbred Wistar rats of both sexes weighing 300–500 g were used in the experiments. Animal procedures were approved by the Estonian National Committee for Ethics in Animal Experimentation (Estonian Ministry of Agriculture).
Experiments
Isolation of cardiomyocytes is described in the Supporting Material. All recordings on permeabilized cardiomyocytes were performed in Mitomed solution (see composition below) at 25°C. The oxygen solubility factor for the solution was calculated as described previously (19). Respiration was recorded in a high-resolution respirometer (Oroboros Oxygraph, Paar KG, Innsbruck, Austria). For ADP and ATP kinetics, the concentrations of ADP and ATP, respectively, were increased in a stepwise manner. The effect of activating a competitive ADP trap consisting of pyruvate kinase (PK) and phosphoenolpyruvate (PEP) was assessed in two ways: first, as has been done earlier (12), with PEP in the solution from the beginning of the experiments (see Fig. 2 C), and second, with PEP and exogenous PK added consecutively after stimulation with 2 mM ATP (see Fig. 2 D). ATPase activity was assessed spectrophotometrically (Evolution 600, Thermo Scientific, Waltham, MA) using a coupled enzyme system (13) with 0.3 mM nicotinamide adenine dinucleotide (NADH), 5 mM PEP, 7.2 U/ml lactate dehydrogenase (LDH) and 20 U/ml PK added to the Mitomed solution. These experiments were performed with 5 mM NaCN and 10 μM oligomycin to inhibit mitochondrial respiration and ATP synthase. Endogenous PK activity was recorded in a similar manner, in the presence of NaCN and oligomycin, and with 5 mM PEP, 0.3 mM NADH, and 7.2 U/ml LDH added to the Mitomed solution. To assess the activity of ATPases and their interaction with mitochondria in the absence of PK, the release of ADP into the surrounding medium after stimulation of ATPases with a single dose of 2 mM ATP was analyzed as a function of time using the high-performance liquid chromatography method described in Sikk et al. (20). This was done with and without oxidative phosphorylation inhibited by 5 mM NaCN and 10 μM oligomycin. Samples were taken out 0, 1, 2, 4, 6, 10, and 18 min after stimulation of ATPases with 2 mM ATP.
Figure 2.
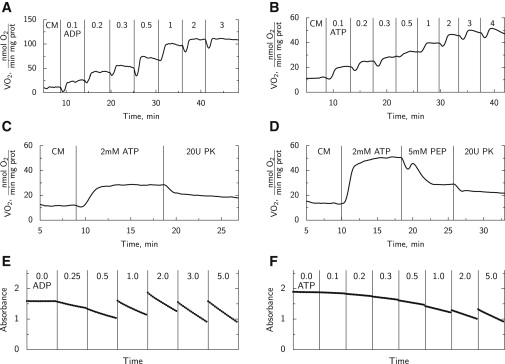
Representative examples of individual experiments performed in this work. Vertical lines indicate the time moment when solution was changed by injecting ATP, ADP, PK, or PEP. (A and B) Respiration rates recorded during titration with ADP (A) and ATP (B). First, cardiomyocytes (CM) were added (moment of addition not shown) and then successive additions of ADP or ATP were performed to reach the concentrations indicated. (C and D) Inhibition by PK+PEP system. In C, 5 mM PEP was in solution before the experiment began. In D, the effects of addition of 5 mM PEP and 20 U/ml PK are demonstrated. (E and F) Mitochondrial respiration was inhibited by cyanide and oligomycin, as shown by ADP dependency of endogenous PK assessed spectrophotometrically (E) and ATPase activity of cardiomyocytes assessed by titration with ATP (F). In these experiments, NADH was sometimes replenished, leading to an increase in absorbance.
For each cell suspension, protein concentration was determined with the Pierce BCA Assay Kit (Thermo Scientific) according to the manufacturer's instructions. Knowing the volume of cell suspension added to each experiment allowed us to normalize the rates to milligrams of protein.
Solutions
Solutions used in this work are listed in the Supporting Material.
Statistics
The raw data were analyzed using homemade software. All results are shown as mean ± SD.
Mathematical model
We used four different model versions to reproduce the experimental data (Fig. 1). In all models, several compartments were considered. In the simpler versions, models 1 and 2 (Fig. 1, schemes 1 and 2), three compartments were included: solution, cytosol, and intermembrane space (IMS). In models 3 and 4, an additional compartment (compartment 4 (C4)) was added to fit the measurements more effectively (Fig. 1, schemes 3 and 4). Diffusion between two compartments was assumed to be proportional to the difference in concentrations in those compartments multiplied by the exchange coefficient (C). In this work, diffusion between the following compartments (Fig. 1, double-headed arrows) was considered: solution and cytosol (Fig. 1, schemes 1–4, sol-cyt); IMS and cytosol (Fig. 1, schemes 1–4, MoM); cytosol and C4 (Fig. 1, scheme 3, cyt-C4); IMS and C4 (Fig. 1, scheme 4, IMS-C4). The reactions included in the models were ATP synthesis by mitochondrial oxidative phosphorylation (ATPsyn), ATP consumption by ATPases (depending on the model, ATPase, ATPase1, or ATPase2), ATP synthesis by endogenous PK (PKend, PKend1, or PKend2), and ATP synthesis by exogenously added PK (PK). Reactions are indicated by single-headed arrows in Fig. 1 and localized in their corresponding compartments. The reactions were described by simplified Michaelis-Menten kinetics with the apparent kinetic constants Vmax and Km. ATPases were considered to be inhibited competitively by ADP (apparent inhibition constant denoted by KiATPase).
Figure 1.
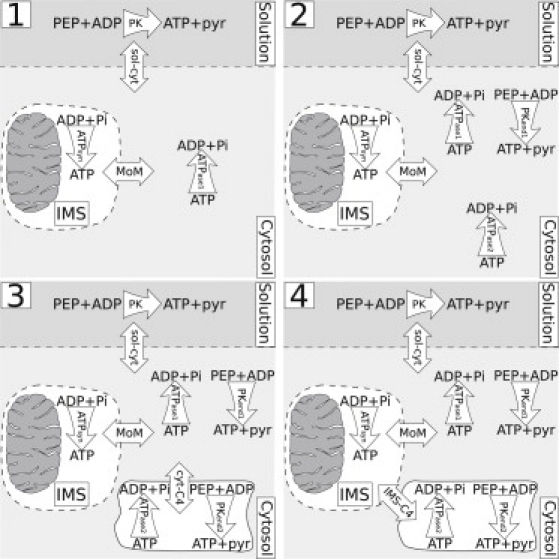
Models of permeabilized cardiomyocytes considered in this work. In the schemes, reactions are shown by curved arrows; exchange between compartments is indicated by straight arrows. The level of complexity increases from model 1 to models 3 and 4. All models have compartments representing solution, cytosol, and mitochondrial IMS. In models 3 and 4, an additional compartment was added (C4). The reactions considered in this work are ATP synthesis by mitochondria (ATPsyn), ATP consumption by ATPases (ATPase, ATPase1, ATPase2), and ATP synthesis by endogenous PK (PKend, PKend1, PKend2) and by exogenously added PK (PK). Compartment exchanges occurred between solution and cytosol (sol-cyt); IMS and cytosol through mitochondrial outer membrane (MoM); cytosol and C4 (cyt-C4); and IMS and C4 (IMS-C4).
As shown in Fig. 1, scheme 1, model 1 is the simplest of the models and includes only ATPsyn, ATPase, and exogenous PK. This model is similar to those used previously to describe intracellular fluxes in permeabilized cardiac muscle fiber (12, 13). Model 2 is based on model 1, with ATPase activity split into two fractions with the different apparent kinetic constants and addition of endogenous PK activity (Fig. 1, scheme 2). Models 3 and 4 are based on model 2, but with the addition of C4, which contains part of ATPase and endogenous PK activity (Fig. 1, schemes 3 and 4). The only difference between models 3 and 4 is that the connection of C4 to the rest of the cell is via cytosol in model 3 and via IMS in model 4.
Such modifications of the base model (model 1) were based on the comparison of model solution with the experimental data. Justification of these modifications is given below, together with the description of the modeling results.
Detailed description of the models, fitting procedures, numerical methods, and statistical analysis of the model fits is presented in the Supporting Material.
Results
Experimental results
The experiments were set up in a manner similar to that of earlier studies of intracellular diffusion restrictions (12, 13), the main difference being that these experiments were conducted on isolated permeabilized cardiomyocytes instead of fibers.
We recorded the mitochondrial respiration rate at different concentrations of ADP and ATP (representative traces shown in Fig. 2, A and B). The respiration rate after addition of substrates and before addition of ADP or ATP (V0) was 12.1 ± 1.5 and 10.8 ± 1.6 nmol O2/(min mg prot), respectively. Addition of 2 mM ADP or ATP increased respiration to 105 ± 23 and 27 ± 5 nmol O2/(min mg prot), respectively, above V0. Thus, respiration rates recorded with 2 mM ADP (V2mMADP) or ATP were 117 ± 27 and 37.6 ± 6.1 nmol O2/(min mg prot), respectively. The dependence of the increase is shown in Fig. 3, A and B (open circles). The acceptor control ratio, defined here as V2mMADP/V0, was 9.7.
Figure 3.
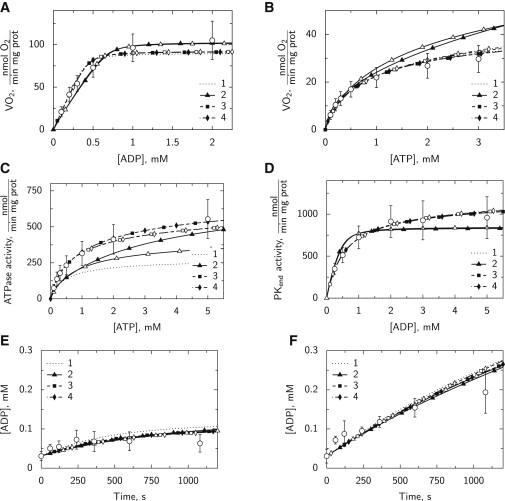
Experimental data (open circles, mean ± SD) are compared to the solutions using models 1 (dotted line) and 2–4 (lines with solid symbols). The fits obtained using the simplified versions of the models are indicated by the lines with the corresponding open symbols. The fitted experimental data were respiration rate recorded during titration with ADP (A; n = 10) or ATP (B; n = 8); endogenous ATPase (C; n = 9) and PK activities (D; n = 7) measured spectrophotometrically; and ADP concentration dependence on time in the presence (E; n = 5) or absence (F; n = 5) of oxidative phosphorylation. Note that in all cases, the lines corresponding to models 3 and 4 are very close to each other, leading to the formation of a single dashed line. In addition, since there is no endogenous PK activity in model 1, the rate of PKend calculated by model 1 is zero in D.
In addition to the respiration kinetics, we recorded how mitochondrial respiration stimulated by endogenous ADP produced by ATPases upon addition of 2 mM ATP was affected by addition of an ADP trapping system consisting of PK and PEP. In the beginning, the experiments were performed in a manner similar to that used in an earlier study on fibers (12), where the cells were added to Mitomed solution that already contained 5 mM PEP. A typical trace is shown in Fig. 2 C. However, we were surprised to find that stimulation of respiration by addition of 2 mM ATP increased respiration rate by only 16.7 ± 5.3 nmol O2/(min mg prot) (n = 11). Addition of 20 U/ml PK decreased the respiration rate to 7.4 ± 1.9 nmol O2/(min mg prot) above V0, leaving 45.6 ± 9.8% of the respiration rate. This is similar to the inhibition ratio reported earlier in fibers (12). However, with PEP already present in the Mitomed solution, the extent of stimulation of respiration by addition of 2 mM ATP was considerably smaller than that obtained by ATP titration, indicating the presence of endogenous PK competing for endogenously produced ADP. Indeed, when PEP was not present in Mitomed at the beginning of the experiments (Fig. 2 D), stimulation of respiration with 2 mM ATP increased respiration rate by 32.2 ± 3.6 nmol O2/(min mg prot) (n = 11), similar to stimulation during ATP titration. The addition of PEP alone brought respiration down to 10.2 ± 2.1 nmol O2/(min mg prot) above V0, and subsequent addition of 20 U/ml PK brought it down further, to 5.3 ± 1.9 nmol O2/(min mg prot) above V0. These rates in the presence of PEP and PK are slightly lower than when PEP was already present in the medium due to a time-dependent decrease in ATP-stimulated respiration (see representative traces in Fig. 2, C and D). Thus, when taking the effect of endogenous PK into account, it is possible to reduce ATP-stimulated respiration by ∼80% through addition of PEP and exogenous PK.
The activity of endogenous PK was assessed spectrophotometrically (Fig. 2 E) and was found to be relatively high, with average kinetics shown in Fig. 3 D (open circles).
The activity of ATPases was measured spectrophotometrically to complement the recordings of respiration rate stimulated by ATP. In these experiments, mitochondrial respiration was inhibited. A representative example is shown in Fig. 2 F. The average kinetics is shown in Fig. 3 C (open circles). Note that the activity of ATPases reached 413 ± 102 nmol/(min mg prot) after addition of 2 mM ATP. Assuming an ATP/O2 ratio equal to 6, that should correspond to a respiration rate of ∼69 nmol O2/(min mg prot), i.e., much higher than the rate recorded in the oxygraph (Fig. 3 B). This suggests that some of the ATPases in our preparation were active only in the presence of an active PK system (see below for analysis).
To get additional information for the further analysis, we used high-performance liquid chromatography to measure ADP concentration in solution after addition of 2 mM ATP in the presence and absence of oxidative phosphorylation (OxPhos) (Fig. 3, E and F, open circles). Due to a small fraction of ADP in the injected ATP, the concentration of ADP was 0.031 ± 0.018 mM at the beginning of the experiment. This concentration increased, and if the OxPhos was not inhibited, it reached 0.063 ± 0.022 mM after 18 min. The increase was much more profound if OxPhos was inhibited, leading to ADP concentrations in solution reaching 0.193 ± 0.053 mM after 18 min.
In the analysis of the measurements presented below, the contribution of adenylate kinase (AK) has been ignored. To estimate the contribution of AK, we performed a series of experiments in which respiration rate in permeabilized cells was stimulated by exogenous ADP (as in Fig. 2 A). Experiments were performed in parallel with and without inhibition of AK by 0.01 mM diadenosine pentaphosphate (Ap5A). As a result, we observed that the increase of respiration rate above V0 was 1.09 ± 0.09 times higher when AK was inhibited compared to the control case (n = 5 experiments, significantly different from 1, with p < 0.001). Here, the increases in rate observed at all concentrations used were averaged. More specifically, such a difference was observed at all concentrations of ADP >0.2 mM (0.2–3.0 mM, with the increase in respiration rate varying from 1.05 to 1.09). When measured at an ADP concentration equal to 0.1 mM, the increase was somewhat higher (1.19 ± 0.17, n = 5, not significantly different from 1, with p = 0.07). From those measurements, we conclude that by not incorporating AK into the models, we ignore ∼10% of the flux.
Analysis by mathematical models
In this work, we considered four models with different levels of complexity and tried to fit the experimental data with them. In all models, the studied system was viewed as consisting of different compartments. For simplicity, diffusion within each of the compartments was assumed to be fast. This allowed us to describe the intracellular diffusion restrictions only through exchange between compartments. The extent of the diffusion restriction was given in the exchange coefficient: the smaller the exchange coefficient, the larger the diffusion restriction between compartments.
We started our analysis with the simplest possible scheme (Fig. 1, scheme 1), which would correspond to models considered previously that describe intracellular fluxes in cardiac muscle fibers (12, 13). As is clear from the fitting results (Fig. 3 and Table 1), there are several problems with this scheme. For instance, there is no consideration of endogenous PK, and as a result, neither kinetics of endogenous PK (Fig. 3 D; model 1 solution is zero) nor inhibition of respiration via endogenous PK (Table 1) can be fitted. In addition, the calculated ATPase activity measured with OxPhos inhibited is considerably lower than that measured experimentally (Fig. 3 C).
Table 1.
Respiration rate stimulated by endogenous ATPases and inhibited by PK
| Experimental | 1 | 2s | 2 | 3s | 3 | 4s | 4 | |
|---|---|---|---|---|---|---|---|---|
| VO2(PEP), nmol/min mg prot | 16.7 ± 5.3 | 28.89 | 8.11 | 8.37 | 15.08 | 15.12 | 14.80 | 15.12 |
| VO2(PEP+PK), nmol/min mg prot | 7.4 ± 1.9 | 6.51 | 7.16 | 7.48 | 7.70 | 7.60 | 7.69 | 7.60 |
Respiration rate was stimulated by endogenous ATPases and inhibited by endogenous PK (VO2(PEP)) only or together with exogenously added 20 U/ml PK (VO2(PEP+PK)). The experimental data are compared with the simulation results obtained by the full models 1, 2, 3, 4 and their corresponding simplified versions (2s, 3s, and 4s). Endogenous ATPases were stimulated by 2 mM ATP and PK was activated by 5 mM PEP added to solution.
To improve the fit, we considered a more complicated model (Fig. 1, scheme 2). First, we added an endogenous PK reaction into the system. Second, we split the ATPase activity into two reactions with different kinetics. The existence of two different ATPases was suggested on the basis of the differences in ATPase activity depending on whether ATP was regenerated intracellularly by OxPhos or by PK. Indeed, model 2 is able to fit the data much better. The main problem with the model 2 fit is that there is no difference in inhibition of OxPhos by simple addition of PEP or PEP together with PK (Table 1). The simulations performed using this model lead to relatively low values of ATPase activity when measured in the presence of PK+PEP (Fig. 3 C) and relatively high ATPase activity when measured in the presence of OxPhos (Fig. 3 B). Thus, the model is not able to reproduce the differences in those measurements very well. In addition, the kinetics of endogenous PK is fitted relatively poorly, due to the small apparent Km(ADP) value of endogenous PK found by the model (Table 2).
Table 2.
Model parameters found by fitting the experimental data
| Model |
|||||||
|---|---|---|---|---|---|---|---|
| Parameter | 1 | 2s | 2 | 3s | 3 | 4s | 4 |
| vmaxATPsyn | 540 | 614 | 618 | 554 | 552 | 554 | 552 |
| 154–1317 | 291–1133 | 262–1263 | 349–844 | 338–861 | 348–846 | 338–861 | |
| csol–cyt | 7385 | 1540 | 1542 | 3799 | 4213 | 3689 | 4215 |
| 1031–>106 | 727–3551 | 634–4468 | 1473–18984 | 1519–28658 | 1430–18399 | 1520–28631 | |
| cMoM | 1651 | 2109 | 1915 | 1893 | 1833 | 1913 | 1833 |
| 574–5516 | 1099–4137 | 936–3835 | 1187–3125 | 1135–3038 | 1190–3194 | 1135–3038 | |
| cIMS–C4 | 15 | 0.087 | |||||
| 0.015–66 | 0.006–65 | ||||||
| ccyto–C4 | 9.63 | 0.108 | |||||
| 0.013–57 | 0.007–79 | ||||||
| vmaxATPase1 | 276 | 506 | 2632 | 239 | 268 | 233 | 268 |
| 141–434 | 354–679 | 1283–4331 | 183–298 | 205–337 | 176–293 | 205–337 | |
| kmATPase1 (mM) | 0.349 | 0.793 | 10 | 0.381 | 0.346 | 0.378 | 0.346 |
| 0.099–1.29 | 0.493–1.36 | 5.89–>10 | 0.233–0.628 | 0.199–0.611 | 0.231–0.625 | 0.199–0.611 | |
| kiATPase1 (mM) | 0.051 | 0.05 | 0.05 | 0.069 | 0.05 | 0.066 | 0.05 |
| <0.05–>10 | <0.05–0.1 | <0.05–0.112 | <0.05–0.247 | <0.05–0.169 | <0.05–0.22 | <0.05–0.168 | |
| vmaxATPase2 | 68 | 483 | 447 | 452 | 447 | ||
| 7.73–130 | 109–2051 | 102–912 | 112–1498 | 101–914 | |||
| kmATPase2 (mM) | 0.056 | 1.05 | 0.95 | ||||
| <0.05–2.63 | 0.323–8.45 | 0.29–7.69 | |||||
| kiATPase2 (mM) | 0.05 | 0.051 | 0.051 | ||||
| <0.05–>10 | <0.05–>10 | <0.05–>10 | |||||
| vmaxPKend1 | 849 | 838 | 796 | 771 | 780 | 771 | |
| 513–1298 | 471–1346 | 477–1139 | 456–1111 | 460–1124 | 456–1111 | ||
| kmPKend (mM) | 0.053 | 0.047 | 0.396 | 0.33 | 0.385 | 0.33 | |
| <0.01–0.178 | <0.01–0.2 | 0.191–0.839 | 0.123–0.844 | 0.181–0.832 | 0.123–0.843 | ||
| vmaxPKend2 | 471 | 2268 | 528 | 2246 | |||
| 108–1836 | 96–>7200 | 115–2585 | 98–>7200 | ||||
The parameter values found by fitting are shown above the confidence interval for each model parameter.
For further improvement of the fit, an additional compartment was introduced (C4) and connected via exchange either with cytosol (model 3) or mitochondrial IMS (model 4). The motivation for such a modification was that the experimental data suggested functional coupling between PK and ATPases. The schemes corresponding to models 3 and 4 are shown in Fig. 1. As is clear from the results shown in Fig. 3 and Table 1, both of these models are able to reproduce all the experimental results quite well. The best fit was obtained by almost isolating C4 from the rest of the solution (see the corresponding exchange coefficients in Table 2). Thus, ATPases in C4 were activated only in the case where local ATP was supplied by PK in the same compartment. Note that, as discussed below, the parameter values found for ATPases in C4 should be considered phenomenological only and suggest a tight functional coupling between some ATPases and endogenous PK in permeabilized rat cardiomyocytes.
In models 2–4, we used two sets of apparent affinities for two ATPase fractions (ATPase 1 and 2). To see whether one set of affinities would be sufficient to fit the data, we repeated the simulations using the simplified versions of models 2–4. In those simulations, apparent affinities of ATPases 1 and 2 were either the same (simplified versions of models 3 and 4) or only one ATPase was considered (simplification of model 2). The results of the fitting by the simplified models are shown in Table 1, Table 2 and in Fig. 3, with the simplified models denoted as 2s, 3s, and 4s. As is clear from the simulation results, the fits using the simplified model versions were similar to those using the corresponding full models (see below for statistical analysis).
As expected, the best fits were obtained using the most complicated models. This could be due to the larger degrees of freedom in those models compared to the simpler ones. To test whether the simpler model was correct and the larger deviation was induced by chance, an F-test of nested models can be used in which the fits of two models are compared. Here, the models are considered nested if the simpler version of the model can be obtained from the more complicated model by selecting particular values of model parameters. Thus, models 3 and 3s cannot be compared with 4 and 4s, since those models are not nested into each other. The results of the test are shown in Table 3. Each model (rows) is compared with the more complicated version (columns) and the p-value calculated by the F-test is shown. For p-values <0.05, we conclude that the fit obtained by the more complicated model was significantly better than that obtained by the simpler model, and there is sufficient evidence to reject the simpler version of the model. According to our analysis, the addition of C4 was necessary, and it improved the fit significantly. From the comparison of the fits produced by models 2–4, we conclude that the models without C4 can be rejected, since the probability is very small (p < 0.001) that model 2 is correct and the differences in fit can be explained by random scatter in the data. According to our analysis, models 3s and 4s give the best results. Indeed, all models that are simpler than those models lead to a significantly worse fit. However, the addition of further degrees of freedom is not justified on the basis of our data (p > 0.05). Thus, there is no sufficient evidence for using different apparent kinetic constants of ATPases in C4 and cytosol (the difference between models 3 and 4 and their simplified versions 3s and 4s).
Table 3.
Statistical analysis of model fits. See text for description
| F test |
|||||||||
|---|---|---|---|---|---|---|---|---|---|
| Model | AIC | AICc | BIC | 2s | 2 | 3s | 3 | 4s | 4 |
| 1 | 74.30 | 76.70 | 207.54 | <0.001 | <0.001 | <0.001 | <0.001 | <0.001 | <0.001 |
| 2s | 15.31 | 19.68 | 71.22 | 0.333 | <0.001 | <0.001 | <0.001 | <0.001 | |
| 2 | 16.77 | 25.57 | 78.20 | <0.001 | <0.001 | ||||
| 3s | −16.73 | −7.93 | 57.82 | 0.272 | |||||
| 3 | −16.50 | −3.50 | 63.86 | ||||||
| 4s | −16.10 | −7.30 | 58.07 | 0.218 | |||||
| 4 | −16.51 | −3.51 | 63.85 | ||||||
A similar conclusion was reached if corrected Akaike information criteria (AICc) and Bayesian information criteria (BIC) were calculated for the models (Table 3). According to those criteria, the best models (with the smallest values of AICc and BIC) are 3s and 4s.
To check the sensitivity of the model fits to the changes of model parameters, the confidence intervals were estimated (see Supporting Material). The confidence intervals are shown in Table 2 as a range, below the optimal value for each model parameter. As is clear from Table 2, some model parameters do not influence the model solution significantly. For example, ATPase apparent inhibition constants (KiATPase) can be changed in a wide range.
Discussion
The experimental results presented in this work cover multiple aspects of energy transfer in isolated permeabilized rat cardiomyocytes. From the analysis of the experimental data, we were able to identify compartmentalization of ATPases and the exchange coefficients for movement of ATP and ADP between the compartments. In addition, the obtained results point to strong coupling between endogenous pyruvate kinase and ATPases in cardiac muscle cells. This conclusion was reached on the basis of statistical analysis of the fits by models with different levels of complexity. To our knowledge, this is the first time such a coupling has been identified in permeabilized cardiomyocytes.
The experimental results obtained in this work are in agreement with earlier studies. As has been shown earlier, diffusion restrictions between solution surrounding the permeabilized cardiomyocytes and adenine nucleotide translocase lead to an apparent Km(ADP) of OxPhos that is much higher than that for isolated mitochondria (9). A similar conclusion was obtained for permeabilized fibers. In fibers, oxidative phosphorylation was inhibited by 40–60% upon addition of exogenous PK (10, 11). In this work, when PEP was present in solution at the beginning of the experiment (Fig. 2 C), a similar inhibition was obtained. Stimulation of respiration by endogenous ATPases upon addition of 2 mM ATP was also similar to that reported by others for permeabilized rat cardiomyocytes (17). In the presence of OxPhos, the concentration of ADP in solution (Fig. 3 E) was similar to values recorded in experiments on permeabilized fibers from rat (10) and ectothermic vertebrates (8) and somewhat higher than values reported for rat by Seppet et al. (11). Finally, PK activity recorded in this work is the same as that recorded by Monge et al. (18). At an ADP concentration of 1.2 mM, activity of 637 ± 69 nmol/(min mg prot) was reported (18), similar to our measurements (Fig. 3 D). Thus, our results for permeabilized cardiomyocytes are similar to those of others.
Cardiomyocytes are an excellent preparation for studying intracellular compartmentalization due to the homogeneous nature of the preparation. Fibers may bundle together and, due to the variation in diameter, the diffusion distance between solution and mitochondria may vary. However, it is intriguing that in permeabilized rat cardiomyocytes, the increase in respiration rate above V0 by addition of 2 mM ATP was only 30% of that obtained by stimulating with 2 mM ADP. In contrast, in permeabilized rat fibers, the increase of respiration rate above V0 after addition of 2 mM ATP was ∼75% of the maximal respiration rate obtained by stimulation with ADP (12). It remains uncertain what causes this discrepancy between fibers and cardiomyocytes. The preparation of cardiomyocytes is a relatively complicated process and requires a large amount of tuning to obtain large populations of rod-shaped and calcium-tolerant cells (>75% of the total population in this work). It is possible that something happens to cardiomyocytes during the isolation procedure that affects the ATPases, but further studies and variations of the cardiomyocyte isolation protocol are required to understand this phenomenon.
The main difference between results reported previously and those presented in this work is that we found a significant effect of endogenous PK on ATPases. Namely, we found that some of the ATPases are not activated unless ATP is provided via PK. As we argue below, this indicates functional coupling between those ATPases and PK. In addition, we have shown that endogenous PK is an effective OxPhos competitor for endogenously produced ADP. This finding was possible because of a change in the procedure that allowed us to account for endogenous PK. Indeed, endogenous PK alone (activated upon addition of PEP) is able to inhibit OxPhos stimulated by exogenous ATP by 50–70% (Fig. 2 D and Table 1). Such effects of endogenous PK have not been reported previously in studies of energy transfer in permeabilized cardiomyocytes or muscle fibers.
The analysis of our experimental data clearly shows the existence of a fraction of ATPases that are activated only in the presence of endogenous ATP generated by PK. Indeed, only models 3 and 4 (Fig. 1, schemes 3 and 4) and their corresponding simplified versions (3s and 4s) were able to reproduce the data very well. In those models, an additional compartment with ATPase and PK activity (C4) was introduced, and this compartment was quite isolated from the rest of the cell. The exchange coefficient for movement of ATP and ADP into or out of that compartment was found to be <1 nmol/(mM min mg prot). Compared to the exchange constant describing the movement through mitochondrial outer membrane (∼1900 nmol/(mM min mg prot)), it is clear that there is almost no significant movement from or to C4 during the steady state. Such a low exchange coefficient is analogous to the exchange coefficient values in the phenomenological models of creatine kinase (CK) and adenine nucleotide translocase (ANT) coupling (21). As in the case with CK-ANT models, the model of C4 presented here should be considered only as a phenomenological description of the coupling between the glycolytic system represented by PK and some of the ATPases. For a mechanistic description, full kinetic analysis should be done, and several mechanisms of the coupling should be considered, as has been done for CK-ANT (22). Only after such analysis, when the mechanism of the coupling is identified, can meaningful exchange coefficients be derived. Right now, the values obtained by models 3, 3s, 4, and 4s should be considered only as a strong indication of functional coupling between PK and ATPases in permeabilized rat cardiomyocytes.
Until it becomes clear which ATPases are not active in cardiomyocytes without ATP supplied by PK, and why there is a difference between ATP-stimulated respiration rates recorded in fibers and cardiomyocytes, it will be hard to estimate the extent of diffusion restrictions in the cell. Indeed, the models that include functional coupling between PK and ATPases (C4 in models 3, 3s, 4, and 4s) predict relatively modest diffusion restriction for ATP and ADP induced by intracellular structures. However, in our experiments, a large fraction of ATPases was active only in the presence of an active PK system. In experiments performed on fibers, on the other hand, the situation is different. As discussed above, respiration rate was activated by ATP much more in fibers than in the cardiomyocyte preparations in this study. This suggests that in fibers, most of ATPases are active without PK-supplied ATP, whereas this is not the case for cardiomyocytes. Alternatively, fibers could have higher ATPase activity than cardiomyocytes. As a result, diffusion is predicted to be relatively restricted when the fiber data are analyzed (12, 13, 14). In this work, we predict larger diffusion restrictions only in the models that do not include functional coupling between PK and ATPase (models 2 and 2s). Thus, the extent of diffusion restriction predicted by models depends on the fraction of ATPases activated in the cells and on the coupling between PK and ATPases. For accurate estimation of diffusion restrictions, the discrepancy between results for cardiomyocytes and those for fibers has to be resolved.
We do not know at this stage which ATPases are active in cardiomyocytes with PK-supplied ATP, i.e., which ATPases are functionally coupled to PK. One possibility is the SR calcium ATPase (SERCA). Specifically, it is known that PK is functionally coupled to SERCA and is localized next to it in the SR vesicles from heart and skeletal muscle (23, 24), but other ATPases can also be coupled to PK. For example, the Na-K-ATPase is preferentially fueled by ATP from glycolysis (25). In general, glycolysis tends to support sarcolemmal function, whereas mitochondrial respiration supports contractile function (1). However, it has been shown that glycolytic energy buffering can affect contractile function in a manner similar to that observed with CK (26). Thus, it is also possible that PK, which binds to the I-band of the sarcomeres (27), is coupled to myosin ATPase. It should be noticed, though, that in the experiments presented here, the concentration of Ca2+ in the intracellular medium is not higher than that in the resting cell, and thus, most of the ATPases involved in excitation-contraction coupling were not fully activated. Further experiments will address which ATPases are represented by C4 in our model and exhibit this strong coupling to PK.
All the models in this study predicted similar exchange coefficients for diffusion through the mitochondrial outer membrane (Table 2). Let us illustrate the meaning of the obtained exchange coefficient value. For example, in the measurements performed with the concentration of exogenous ADP equal to the apparent Km(ADP) value (∼0.3 mM), the respiration rate is ∼50 nmol O2/(min mg prot), or ADP consumption is 300 nmol/(min mg prot) (assuming P/O2 = 6). To sustain such a flux through the mitochondrial outer membrane, the ADP gradient has to be 300 nmol/(min mg prot)/1900 nmol/(mM min mg prot) = 0.16 mM. This value is close to our estimate obtained using a 3D mathematical model of intracellular diffusion in the fiber (14). That model took into account the intracellular distribution of mitochondria (28) as well as sarcoplasmic reticulum (29). According to our simulations, the gradient of ADP in similar conditions would be ≤0.15 mM (14). In both models, the ADP and ATP gradients induced by mitochondrial outer membrane depend on the respiration rate, with gradients up to ∼0.3 mM expected at rates close to the maximal respiration rate. The estimate of apparent Km(ADP) obtained in this work is somewhat smaller than that obtained by others for isolated brain and heart mitochondria after addition of tubulin (30, 31). In those experiments, two populations of mitochondria were identified with one of them (Km(ADP) = ∼0.3 mM), presumably corresponding to the situation in the intracellular environment. Thus, although our results show that there is a significant diffusion restriction induced by the mitochondrial outer membrane in permeabilized cardiomyocytes, we predict that it is somewhat smaller than the diffusion restriction found in experiments on isolated mitochondria with tubulin in solution.
The finding that intracellular PK is tightly coupled to some ATPases supports the view of metabolism as a highly developed compartmentalized network (1). With the intracellular diffusion restricted (12, 16) and anisotropic (15) in rat cardiomyocytes, formation of microdomains with local ATP consumption and production is possible. As one of the ATPases that can be coupled tightly to PK, SERCA is one of several critical systems that are functionally coupled to local ATP regeneration via glycolysis, glycogenolysis, or CK (32, 33, 34, 35). A similar trend has been identified in mitochondria, with the evidence that the respiratory chain is organized in supercomplexes (36). To understand the behavior of such compartmentalized and coupled systems, mathematical models describing the interaction between molecules have to be developed and integrated into cell models. Such integrated models, when fully developed, will help us to understand the metabolic pathways in normal conditions and the effects of metabolic remodeling of the failing heart, and thereby to identify treatment protocols for patients based on modulation of the metabolic pathways (37, 38).
In conclusion, we have generated a solid data set that we used to analyze intracellular diffusion restrictions in rat cardiomyocytes. On the basis of our analysis, we have confirmed previous findings of a significant restriction by the outer mitochondrial membrane. Also, we have confirmed a functional coupling between mitochondria and a fraction of ATPases in the cell. The new finding in this study is that a large fraction of ATPases seems to be tightly coupled to PK. This highlights the importance of glycolysis in energy production for cardiac function. To determine the intracellular diffusion restrictions that are expected to group ATP-consuming and -producing systems, we need to explain why there is a discrepancy between ATPase stimulation of respiration in cardiomyocytes and that in fibers, and which ATPases are coupled to mitochondria and PK.
Acknowledgments
We thank Drs. Tuuli Käämbre and Peter Sikk (National Institute of Chemical Physics and Biophysics, Tallinn, Estonia) for interesting discussions, and Maire Peitel (Institute of Cybernetics, Tallinn University of Technology, Tallinn, Estonia) for technical assistance.
This work was supported by the Wellcome Trust (Fellowship No. WT081755MA) and the Estonian Science Foundation (grant No. 7344, PhD stipend for M.S.).
Editor: Michael D. Stern.
Footnotes
This is an Open Access article distributed under the terms of the Creative Commons-Attribution Noncommercial License (http://creativecommons.org/licenses/by-nc/2.0/), which permits unrestricted noncommercial use, distribution, and reproduction in any medium, provided the original work is properly cited.
Additional text is available at http://www.biophysj.org/biophysj/supplemental/S0006-3495(10)00357-7.
Contributor Information
Marko Vendelin, Email: markov@ioc.ee.
Rikke Birkedal, Email: rikke@sysbio.ioc.ee.
Supporting Material
References
- 1.Weiss J.N., Yang L., Qu Z. Systems biology approaches to metabolic and cardiovascular disorders: network perspectives of cardiovascular metabolism. J. Lipid Res. 2006;47:2355–2366. doi: 10.1194/jlr.R600023-JLR200. [DOI] [PubMed] [Google Scholar]
- 2.Saks V., Dzeja P., Wallimann T. Cardiac system bioenergetics: metabolic basis of the Frank-Starling law. J. Physiol. 2006;571:253–273. doi: 10.1113/jphysiol.2005.101444. [DOI] [PMC free article] [PubMed] [Google Scholar]
- 3.Hoerter J.A., Kuznetsov A., Ventura-Clapier R. Functional development of the creatine kinase system in perinatal rabbit heart. Circ. Res. 1991;69:665–676. doi: 10.1161/01.res.69.3.665. [DOI] [PubMed] [Google Scholar]
- 4.Kay L., Saks V.A., Rossi A. Early alteration of the control of mitochondrial function in myocardial ischemia. J. Mol. Cell. Cardiol. 1997;29:3399–3411. doi: 10.1006/jmcc.1997.0564. [DOI] [PubMed] [Google Scholar]
- 5.Sokolova N., Vendelin M., Birkedal R. Intracellular diffusion restrictions in isolated cardiomyocytes from rainbow trout. BMC Cell Biol. 2009;10:90. doi: 10.1186/1471-2121-10-90. [DOI] [PMC free article] [PubMed] [Google Scholar]
- 6.Birkedal R., Gesser H. Effects of hibernation on mitochondrial regulation and metabolic capacities in myocardium of painted turtle (Chrysemys picta) Comp. Biochem. Physiol. A Mol. Integr. Physiol. 2004;139:285–291. doi: 10.1016/j.cbpb.2004.09.023. [DOI] [PubMed] [Google Scholar]
- 7.Anmann T., Guzun R., Saks V. Different kinetics of the regulation of respiration in permeabilized cardiomyocytes and in HL-1 cardiac cells. Importance of cell structure/organization for respiration regulation. Biochim. Biophys. Acta. 2006;1757:1597–1606. doi: 10.1016/j.bbabio.2006.09.008. [DOI] [PubMed] [Google Scholar]
- 8.Birkedal R., Gesser H. Intracellular compartmentation of cardiac fibres from rainbow trout and Atlantic cod—a general design of heart cells. Biochim. Biophys. Acta. 2006;1757:764–772. doi: 10.1016/j.bbabio.2006.04.022. [DOI] [PubMed] [Google Scholar]
- 9.Kümmel L. Ca, Mg-ATPase activity of permeabilised rat heart cells and its functional coupling to oxidative phosphorylation of the cells. Cardiovasc. Res. 1988;22:359–367. doi: 10.1093/cvr/22.5.359. [DOI] [PubMed] [Google Scholar]
- 10.Kay L., Nicolay K., Wallimann T. Direct evidence for the control of mitochondrial respiration by mitochondrial creatine kinase in oxidative muscle cells in situ. J. Biol. Chem. 2000;275:6937–6944. doi: 10.1074/jbc.275.10.6937. [DOI] [PubMed] [Google Scholar]
- 11.Seppet E.K., Kaambre T., Saks V.A. Functional complexes of mitochondria with Ca,MgATPases of myofibrils and sarcoplasmic reticulum in muscle cells. Biochim. Biophys. Acta. 2001;1504:379–395. doi: 10.1016/s0005-2728(00)00269-3. [DOI] [PubMed] [Google Scholar]
- 12.Saks V., Kuznetsov A., Vendelin M. Heterogeneity of ADP diffusion and regulation of respiration in cardiac cells. Biophys. J. 2003;84:3436–3456. doi: 10.1016/S0006-3495(03)70065-4. [DOI] [PMC free article] [PubMed] [Google Scholar]
- 13.Vendelin M., Eimre M., Saks V.A. Intracellular diffusion of adenosine phosphates is locally restricted in cardiac muscle. Mol. Cell. Biochem. 2004;256–257:229–241. doi: 10.1023/b:mcbi.0000009871.04141.64. [DOI] [PubMed] [Google Scholar]
- 14.Ramay H.R., Vendelin M. Diffusion restrictions surrounding mitochondria: a mathematical model of heart muscle fibers. Biophys. J. 2009;97:443–452. doi: 10.1016/j.bpj.2009.04.062. [DOI] [PMC free article] [PubMed] [Google Scholar]
- 15.Vendelin M., Birkedal R. Anisotropic diffusion of fluorescently labeled ATP in rat cardiomyocytes determined by raster image correlation spectroscopy. Am. J. Physiol. Cell Physiol. 2008;295:C1302–C1315. doi: 10.1152/ajpcell.00313.2008. [DOI] [PMC free article] [PubMed] [Google Scholar]
- 16.Kaasik A., Veksler V., Ventura-Clapier R. Energetic crosstalk between organelles: architectural integration of energy production and utilization. Circ. Res. 2001;89:153–159. doi: 10.1161/hh1401.093440. [DOI] [PubMed] [Google Scholar]
- 17.Guzun R., Timohhina N., Saks V. Regulation of respiration controlled by mitochondrial creatine kinase in permeabilized cardiac cells in situ. Importance of system level properties. Biochim. Biophys. Acta. 2009;1787:1089–1105. doi: 10.1016/j.bbabio.2009.03.024. [DOI] [PubMed] [Google Scholar]
- 18.Monge C., Beraud N., Seppet E. Comparative analysis of the bioenergetics of adult cardiomyocytes and nonbeating HL-1 cells: respiratory chain activities, glycolytic enzyme profiles, and metabolic fluxes. Can. J. Physiol. Pharmacol. 2009;87:318–326. doi: 10.1139/Y09-018. [DOI] [PubMed] [Google Scholar]
- 19.Rasmussen H.N., Rasmussen U.F. Oxygen solubilities of media used in electrochemical respiration measurements. Anal. Biochem. 2003;319:105–113. doi: 10.1016/s0003-2697(03)00274-4. [DOI] [PubMed] [Google Scholar]
- 20.Sikk P., Kaambre T., Saks V. Ultra performance liquid chromatographic analysis of adenine nucleotides and creatine derivatives for kinetic studies. Proc. Eston. Acad. Sci. 2009;58:122–131. [Google Scholar]
- 21.Vendelin M., Kongas O., Saks V. Regulation of mitochondrial respiration in heart cells analyzed by reaction-diffusion model of energy transfer. Am. J. Physiol. Cell Physiol. 2000;278:C747–C764. doi: 10.1152/ajpcell.2000.278.4.C747. [DOI] [PubMed] [Google Scholar]
- 22.Vendelin M., Lemba M., Saks V.A. Analysis of functional coupling: mitochondrial creatine kinase and adenine nucleotide translocase. Biophys. J. 2004;87:696–713. doi: 10.1529/biophysj.103.036210. [DOI] [PMC free article] [PubMed] [Google Scholar]
- 23.Xu K.Y., Zweier J.L., Becker L.C. Functional coupling between glycolysis and sarcoplasmic reticulum Ca2+ transport. Circ. Res. 1995;77:88–97. doi: 10.1161/01.res.77.1.88. [DOI] [PubMed] [Google Scholar]
- 24.Xu K.Y., Becker L.C. Ultrastructural localization of glycolytic enzymes on sarcoplasmic reticulum vesticles. J. Histochem. Cytochem. 1998;46:419–427. doi: 10.1177/002215549804600401. [DOI] [PubMed] [Google Scholar]
- 25.Dizon J., Burkhoff D., Katz J. Metabolic inhibition in the perfused rat heart: evidence for glycolytic requirement for normal sodium homeostasis. Am. J. Physiol. 1998;274:H1082–H1089. doi: 10.1152/ajpheart.1998.274.4.H1082. [DOI] [PubMed] [Google Scholar]
- 26.Harrison G.J., van Wijhe M.H., van Beek J.H. Glycolytic buffering affects cardiac bioenergetic signaling and contractile reserve similar to creatine kinase. Am. J. Physiol. Heart Circ. Physiol. 2003;285:H883–H890. doi: 10.1152/ajpheart.00725.2002. [DOI] [PubMed] [Google Scholar]
- 27.Kraft T., Messerli M., Brenner B. Equilibration and exchange of fluorescently labeled molecules in skinned skeletal muscle fibers visualized by confocal microscopy. Biophys. J. 1995;69:1246–1258. doi: 10.1016/S0006-3495(95)80018-4. [DOI] [PMC free article] [PubMed] [Google Scholar]
- 28.Birkedal R., Shiels H.A., Vendelin M. Three-dimensional mitochondrial arrangement in ventricular myocytes: from chaos to order. Am. J. Physiol. Cell Physiol. 2006;291:C1148–C1158. doi: 10.1152/ajpcell.00236.2006. [DOI] [PubMed] [Google Scholar]
- 29.Segretain D., Rambourg A., Clermont Y. Three dimensional arrangement of mitochondria and endoplasmic reticulum in the heart muscle fiber of the rat. Anat. Rec. 1981;200:139–151. doi: 10.1002/ar.1092000204. [DOI] [PubMed] [Google Scholar]
- 30.Monge C., Beraud N., Saks V.A. Regulation of respiration in brain mitochondria and synaptosomes: restrictions of ADP diffusion in situ, roles of tubulin, and mitochondrial creatine kinase. Mol. Cell. Biochem. 2008;318:147–165. doi: 10.1007/s11010-008-9865-7. [DOI] [PubMed] [Google Scholar]
- 31.Rostovtseva T.K., Sheldon K.L., Sackett D.L. Tubulin binding blocks mitochondrial voltage-dependent anion channel and regulates respiration. Proc. Natl. Acad. Sci. USA. 2008;105:18746–18751. doi: 10.1073/pnas.0806303105. [DOI] [PMC free article] [PubMed] [Google Scholar]
- 32.Korge P., Byrd S.K., Campbell K.B. Functional coupling between sarcoplasmic-reticulum-bound creatine kinase and Ca2+-ATPase. Eur. J. Biochem. 1993;213:973–980. doi: 10.1111/j.1432-1033.1993.tb17842.x. [DOI] [PubMed] [Google Scholar]
- 33.Minajeva A., Ventura-Clapier R., Veksler V. Ca2+ uptake by cardiac sarcoplasmic reticulum ATPase in situ strongly depends on bound creatine kinase. Pflugers Arch. 1996;432:904–912. doi: 10.1007/s004240050214. [DOI] [PubMed] [Google Scholar]
- 34.Weiss J.N., Lamp S.T. Cardiac ATP-sensitive K+ channels. Evidence for preferential regulation by glycolysis. J. Gen. Physiol. 1989;94:911–935. doi: 10.1085/jgp.94.5.911. [DOI] [PMC free article] [PubMed] [Google Scholar]
- 35.Dhar-Chowdhury P., Harrell M.D., Coetzee W.A. The glycolytic enzymes, glyceraldehyde-3-phosphate dehydrogenase, triose-phosphate isomerase, and pyruvate kinase are components of the KATP channel macromolecular complex and regulate its function. J. Biol. Chem. 2005;280:38464–38470. doi: 10.1074/jbc.M508744200. [DOI] [PMC free article] [PubMed] [Google Scholar]
- 36.Lenaz G., Genova M.L. Kinetics of integrated electron transfer in the mitochondrial respiratory chain: random collisions vs. solid state electron channeling. Am. J. Physiol. Cell Physiol. 2007;292:C1221–C1239. doi: 10.1152/ajpcell.00263.2006. [DOI] [PubMed] [Google Scholar]
- 37.van Bilsen M., van Nieuwenhoven F.A., van der Vusse G.J. Metabolic remodelling of the failing heart: beneficial or detrimental? Cardiovasc. Res. 2009;81:420–428. doi: 10.1093/cvr/cvn282. [DOI] [PubMed] [Google Scholar]
- 38.Neubauer S. The failing heart—an engine out of fuel. N. Engl. J. Med. 2007;356:1140–1151. doi: 10.1056/NEJMra063052. [DOI] [PubMed] [Google Scholar]
Associated Data
This section collects any data citations, data availability statements, or supplementary materials included in this article.