

Abstract
Protein aggregation is a hallmark of several neurodegenerative diseases including Huntington's disease. We describe the use of the recently developed number and brightness method (N&B) that uses confocal images to monitor aggregation of Huntingtin exon 1 protein (Httex1p) directly in living cells. N&B measures the molecular brightness of protein aggregates in the entire cell noninvasively based on intensity fluctuations at each pixel in an image. N&B applied to mutant Httex1p in living cells showed a two-step pathway leading to inclusion formation that is polyQ length dependent and involves four phases. An initial phase of monomer accumulation is followed by formation of small oligomers (5–15 proteins); as protein concentration increases, an inclusion is seeded and forms in the cytoplasm; the growing inclusion recruits most of the Httex1p and depletes the cell leaving only a low concentration of monomers. The behavior of Httex1p in COS-7 and ST14A cells is compared.
Introduction
Huntington's disease (HD) is one of nine known inherited neurodegenerative diseases caused by an expansion of a polyglutamine (polyQ) stretch beyond a threshold of ∼40 glutamines in the affected protein (1). This expansion leads to formation of the large protein inclusions typical of this disease (1). Observations, including those indicating that naked polyQ peptides alone can cause degeneration, have led to the hypothesis that aggregation of expanded polyQ domain peptides initiates the disease (2–6). Several studies in cell-free systems (7–9) find that synthetic polyQ peptides in solution can undergo a nucleated add-on growth polymerization mechanism with direct formation of amyloid-like aggregates (10). Other observations suggest that, in different conditions, synthetic peptides can adopt different conformational and aggregation states including oligomers, protofibrils and amyloid fibrils (11,12). Recent studies suggest that polyQ, in the presence of amino acids N1–17 of Huntingtin (Htt), can undergo a novel and complex mechanism of aggregation in a cell-free setting (13). Takahashi et al. (14) observed polyQ oligomerization in cell lysates by fluorescence correlation spectroscopy (FCS), measuring the change in the diffusion time of the aggregates. FCS can show information about the size, number, and diffusion time of fluorescent particles but it is restricted to a single point measurement. Despite these many studies, the mechanism of aggregation that leads to the formation of inclusions in live cells is controversial. A method to follow the events leading to protein aggregation in living cells and tissues would help advance our understanding of the aggregation process.
We use the number and brightness (N&B) method developed recently to explore the aggregation dynamics of the pathogenic Httex1p peptide in cells. N&B measures the fluorescence fluctuation at each pixel in the image as a function of time thus allowing localization and quantification of the average size of protein aggregates (15,16). Conventional microscopy can detect the formation of the inclusion but cannot determine the distribution and size of intermediate protein aggregates.
From our results, we derived a model for Httex1p aggregation in cells. We find that Httex1p with expanded polyQ aggregates by a dynamic two-step mechanism of monomers forming oligomers and finally inclusions. The process involves four phases where monomers accumulate to a threshold concentration (Phase 1) at which point, they begin to form small oligomers (Phase 2) until a second threshold is reached that results in a nucleation event (Phase 3) that is followed by a rapid recruitment of Httex1p into large inclusions (Phase 4). We find that oligomers are in equilibrium with monomers both in the nucleus and the cytoplasm, and that a fibrillar intermediate is not an obligate step to inclusion formation. As the inclusion forms, it becomes insoluble and sequesters the majority of the Httex1p in the cell.
Methods
Cell culture
COS-7 (African green monkey kidney) cells were grown in D-MEM high glucose medium (Invitrogen, Carlsbad, CA) containing 10% heat inactivated fetal bovine serum (Invitrogen), 1% penicillin/streptomycin, 0.5% Hepes 1 M at 37°C in 5% CO2. ST14A cells are derived from primary cells dissociated from embryonic day 14 rat striatal primordial tissue (17). This cell line is grown in D-MEM high glucose containing 10% heat inactivated fetal bovine serum, 110 mg/L sodium pyruvate, 4.5 g/L D-glucose, L-glutamine, 1% penicillin/streptomycin at 33°C in 5% CO2. This cell line has been chosen as a model of the aggregation mechanism because it originates in a tissue most impacted by HD in animals and humans. Transfections are carried out using Lipofectamine 2000 (Invitrogen) in accordance with manufacturer's protocol. Cells were transfected with Httex1p containing plasmids bearing varying lengths of polyglutamine fused at the C-terminus to EGFP (Httex1p 97QP-EGFP, Httex1p 46QP-EGFP, and Httex1p 25QP-EGFP) (18). Monomeric EGFP transfected cells were used to calibrate the brightness scale. Cells were plated on 35-mm glass bottom dishes (MatTek, Ashland, MA) for imaging. Extensive previous studies have shown that the specific constructs with EGFP used in our studies produce the phenotypes characteristic of the HD disease (19).
Microscopy
Images were acquired with an Olympus FluoView1000 confocal laser scanning microscope using an excitation wavelength of 488 nm and an UPLSAPO 60×-1.2 NA water objective. Laser power was set at 0.8% corresponding to ∼2 μW at the sample. During imaging, cells were in an incubator at 37°C and 5% CO2 (INU; Tokai-Hit, Shizuoka-ken, Japan). Images were acquired at different times (from 20 to 50 h after transfection). For the N&B analysis, we acquired a stack of 100 frames for each field. The size of the images was 256 × 256 pixels. The acquisition time was 20 μs/pixel. The stack of 100 images was acquired in ∼2 min. We acquired images of the cell of interest every 20 min for several hours. Several cells (∼20) were chosen in each preparation.
N&B analysis
The N&B fluctuation analysis allows the quantification and localization of aggregates by the brightness map (15). N&B distinguishes pixels with many dim molecules from pixels with few bright molecules in an image because the degree of aggregation of fluorescent molecules is related to the average and variance of the intensity distribution. For a given average, the larger the variance, the fewer molecules contribute to the average. The apparent number of particles (N) and apparent brightness (B) are related to the average (〈k〉) and variance (σ2) of the intensity distribution in any given pixel by the following expressions (Eqs. 1 and 2) where the average is calculated for the same pixel in a stack of images
| (1) |
| (2) |
The average intensity is proportional to the product of the number of particles, n, in the volume of excitation and molecular brightness ɛ. The variance arises from two contributions. One is due to the fluctuation of numbers of particles in the pixel and the other is due to the detector shot noise. Equations 1 and 2 can be written in terms of the particle number and molecular brightness
| (3) |
| (4) |
Immobile molecules have apparent brightness B equal to 1, because there is no variance due to particle fluctuations other than the shot noise. The brightness (B) of the immobile fraction, 1, is independent of the laser power, whereas B of the mobile fraction is laser power-dependent. By changing the laser power it is possible to distinguish the immobile from the mobile fraction. This characteristic is important in the interpretation of the data. We determined that the large inclusions are immobile. With N&B, when a given pixel contains a mixture of species with different levels of brightness, the N&B method averages the brightness; thus, working with low concentrations provides more resolving power. The correction of the molecular brightness for the immobile fraction and the number of molecules are given by Eqs. 5 and 6.
| (5) |
| (6) |
where R is the intensity ratio between the immobile and mobile fractions at 1 pixel.
We set the Olympus FluoView 1000 to the pseudo-photon counting mode of data acquisition (16). In this mode, the parameters needed for N&B analysis are the detector offset, the factor S that converts photon counts to digital levels and the readout variance σ02. In the case of an analog detector, the N&B equations become Eqs. 7 and 8:
| (7) |
| (8) |
For the analysis of this work, the values of these parameters were calibrated according to the principles described in (16). We obtained S = 2, σ02 = 0, and offset = 0.
N&B is based on fluctuation analysis. Therefore, the pixel dwell time is an important parameter. It should be faster than the decay time of the fluctuations. If the dwell time is longer than the time a particle takes to cross the excitation volume, the variance is reduced and the particles appear to be more numerous and less bright. Usually, for molecules in solution, a maximum pixel dwell time of 4 μs is needed, whereas for measurements of proteins in cells, a maximum pixel dwell time between 20 and 32 μs is sufficient (15). Photobleaching and cell movements increase the variance, and thus the apparent brightness. To correct for these processes, we applied a high pass filter algorithm (detrend filter) to the time sequence at each pixel of the stack. The filter algorithm eliminates the trend due to photobleaching and slow cell movements and restores the average intensity at each pixel. The high pass filter maintains the fluctuations due to changes in particle number in one pixel if the particle fluctuations are faster than the changes due to photobleaching and/or motion (15).
We used the brightness map to determine the size of aggregates at a given location. The brightness histogram gives information on the overall distribution of aggregates sizes. The N&B analysis was implemented in the SimFCS software (www.lfd.uci.edu). Under the hypothesis that the quantum yield does not change during aggregation, B can be used to extract the number of fluorescent molecules in the aggregate according to Eq. 4. If there is quenching of the monomer fluorescence due to aggregation, the N&B analysis will underestimate the aggregate size.
Calibration with mEGFP
To calibrate the laser power and scanning conditions required for the measurement of monomeric EGFP, we measured the brightness of COS-7 cells transiently expressing nonaggregating mEGFP. These conditions were then used for the Httex1p-EGFP experiments. We measured the brightness (B) of COS-7 cells transiently expressing monomeric EGFP at the same laser power and scanning conditions used for the Httex1p-EGFP experiments. We determined the aggregate size using the expression (Eq. 9) (15)
| (9) |
B − 1 has units of counts per molecule per pixel dwell time. To convert to counts/molecules/s (cpms), we divided B − 1 by the pixel dwell time in seconds, tpixel (Eq. 10)
| (10) |
The measurements with cells expressing monomeric EGFP were carried out at the beginning and at the end of each experiment to confirm the stability of the instrument. The N&B analysis is laser power-dependent, so the power was rigorously kept constant for all the experiments. The apparent brightness of monomeric EGFP is determined by selecting the center of the Gaussian distribution of the pixel brightness histogram in an image of a cell transfected with monomeric EGFP (Fig. 1). In the B histogram (Fig. 1 C), only a few pixels are outside the distribution centered at B = 1.074 corresponding to brightness of 3700 cpsm.
Figure 1.
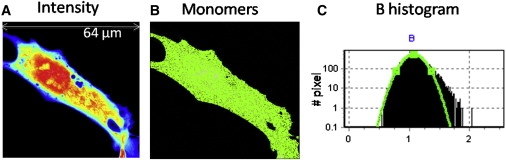
Determination of molecular brightness. A COS-7 cell transiently transfected with mEGFP is shown. (A) Average intensity image of a single optical plane with excitation at 488 nm at 0.8% laser power and 20 μs/pixel. (B) Selection of pixels whose brightness corresponds to monomers, B = 1.074 indicates that monomers are distributed uniformly throughout the cell. (C) Brightness histogram. Selection of pixels corresponding to the Gaussian distribution centered at B =1.074 cpm, (ɛ = 3700 cpsm) identifies the monomeric protein. Only a few pixels are outside the distribution of the monomeric brightness. These pixels tend to concentrate at the cell border or at the border of internal membranes. This analysis depicts the N&B map of a uniform, monomeric EGFP species.
Results
HD is associated with an expansion of a polyQ tract in the protein coding region (near the N-terminus of Htt). Extensive evidence shows that processed N-terminal peptide (Httex1p) fragments of Htt with a polyQ expansion are found in pathologic specimens from HD patients and can cause disease in model organisms including flies, worms, mice, and other organisms (20–25). Evidence also exists that processed fragments containing the polyQ stretch are associated with disease in other triplet repeat disorders (26). Accordingly, we have tagged human exon 1 fragments containing different polyQ lengths with EGFP (Httex1p-25QP-EGFP, Httex1p-46QP-EGFP, and Httex1p-97QP-EGFP). COS-7 and ST14A were transfected with Httex1p-EGFP. Only cells with a low protein expression level at the commencement of the experiment were chosen for time lapse imaging so that the entire evolution of monomers to aggregates could be monitored and measured. These cells were then followed for 3–4 h. For each condition ≥20 cells were characterized.
Calibration of molecular brightness of monomeric EGFP
To determine the monomeric molecular brightness, COS-7 cells were transfected with monomeric EGFP. The intensity map for a single plane that transects the nucleus shows a widespread distribution throughout the cytoplasm and nucleus (Fig. 1). The brightness histogram shows the presence of a single distribution of brightness (Fig. 1 C). Pixels in this distribution account for all the fluorescence in the cell. In this case, monomers are located in all cellular compartments (Fig. 1 B, green). The brightness value obtained is 1.074 corresponding to 3700 cpms (counts/molecule/s) for monomeric EGFP.
Unexpanded Httex1p remains monomeric (Httex1p-25QP-EGFP)
Unexpanded Httex1p typically does not form inclusions but whether it transiently forms oligomeric species in live cells is not known. COS-7 cells were transiently transfected with unexpanded Httex1p-25QP-EGFP and observed for several hours starting 51 h after transfection (Fig. 2). The majority of the protein is in the monomeric form (Fig. 2 B) and remains monomeric for the duration of the experiment with a modest preference for cytoplasmic localization (Fig. 2 A). This can be observed in the brightness (B) histogram, where the curve of the monomers (green line) selects most of the pixels of the cell (Fig. 2, B and C). When the images of these cells were filtered to show species corresponding to oligomers no evidence of transient oligomerization was found despite the fact that some cells achieve a very high concentration of soluble monomer. The few pixels (<6% of all the pixels representing the cell) with B ≥ 1.74 are clustered on the membranes where their movement will be coherent if the membrane moves thus leading to an apparent brightness value greater than monomer.
Figure 2.
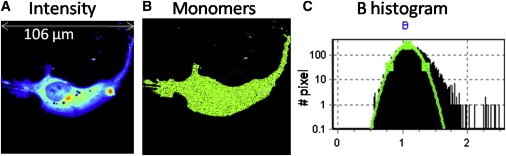
COS-7 cell transiently transfected with Httex1p-25QP-EGFP. Cells were imaged 51 h after transfection with 0.8% laser power at 488 nm and 20 μs/pixel. (A) Intensity image of a single plane shows widespread presence of Httex1p-25QP-EGFP, slightly lower levels in the nucleus. (B) Selection of the pixels with brightness corresponding to the monomers (B = 1.074, ɛ = 3700 cpsm). (C) Pixel brightness histogram confirms the prevalence of monomers.
Expanded polyQ Htt forms oligomers (Httex1p-46QP-EGFP)
COS-7 cells transfected with Httex1p-46QP-EGFP were followed for several hours starting 46 h after transfection. Early during the observation period, the brightness histogram revealed a uniform distribution of monomers throughout the cell. As overall EGFP signal intensity increased, monomers accumulated to the point where the number map indicated a cellular concentration >1 μM, at which point particles of increased brightness were detected indicating that higher order complexes were forming (Fig. 3, C and D, first row). The brighter particles representing oligomers were centered on a single average aggregate size equivalent to 10 ± 5 monomers at a density representing ∼12% of the total number of pixels defined by the cell and preferentially located close to the membrane in the periphery of the cell (Fig. 3 C). Large inclusion formation was not seen in the cells chosen for observation during the ∼4 h of observation. Pixels exhibiting monomer brightness were found in ∼88% of the total pixels representing the cell. The accumulation of the oligomeric particles reached a plateau indicating equilibrium with the monomers.
Figure 3.
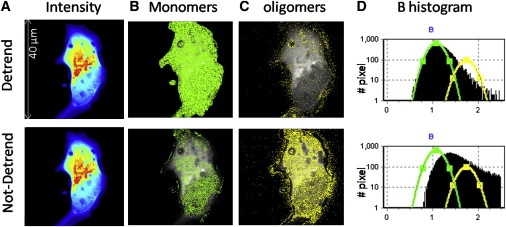
COS-7 cell transfected with Httex1p-46QP-EGFP. Cells were imaged with 0.8% laser power at 488 nm and 20 μs/pixel. (A) Average intensity image reveals widespread distribution. (B) Selection of the pixels with brightness corresponding to monomers (B = 1.074, ɛ = 3700 cpsm) detrended (first row) and without the detrend filter (second row). Monomers are distributed throughout the cell. (C) Selection of the pixels with brightness corresponding to oligomers (centered on decamer, B = 1.74, ɛ = 37,000 cpsm) detrended (first row) and not detrended (second row). (D) Brightness histogram with the distribution of the pixel after detrend (first row) and before detrend (second row). The fraction of higher brightness pixels has increased with respect to the histogram of D. In the case of not detrended data, the values of B recovered are larger because of the fluctuation due to the cell motion.
In cells transfected with Httex1p-46QP-EGFP, many bright fluorescent vesicles and membrane movements were present. Vesicles are easily identified because of their slow motion compared with the oligomers. Membrane movements are localized at the borders of the cell and can be separated from the fast motion of the oligomers in the cell interior. The slow movements of membrane or organelle bound fluorescent particles can bias brightness calculations because they are source of large variance. To determine the proportion of the large brightness signature (e.g., of B > ∼1.5) that was due to membrane and/or organelle bound particles rather than to small inclusions at specific sites in the cell, we compared the brightness map obtained with and without the detrend filter (see Methods) that computationally removes the contributions due to slow-moving features associated with large cellular structures such as membranes or mitochondria. The images in Fig. 3, top row, were processed using the detrend filter. This comparison shows that a large number of particles are slow moving and is consistent with observations that a significant fraction of Httex1p interacts with membranes (13).
Increasing the polyQ length results in inclusions formation (Httex1p-97QP-EGFP)
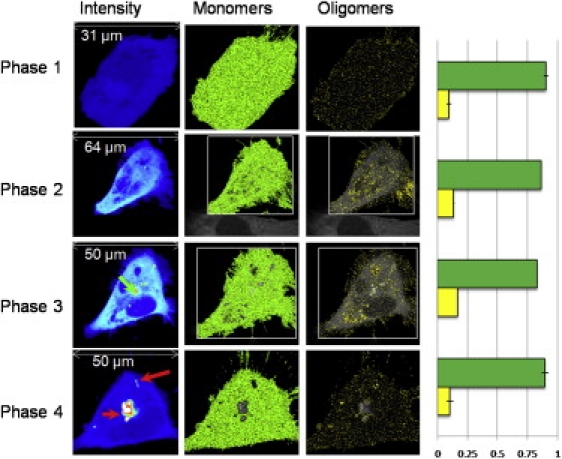
To assess the behavior of longer polyQ-containing peptides, COS-7 cells transfected with Httex1p-97QP-EGFP were followed. As for the expanded 46 polyQ construct, we observed a first phase of accumulation of monomers. Different cells exhibited different rates of EGFP accumulation and oligomerization, and inclusion formation was observed at different times after transfection. These differences however, correlate with the EGFP intensity of the cells suggesting that the aggregation process does not depend on the time after transfection but on protein concentration in the cell. We used brightness analysis to determine when oligomers appeared (Fig. 4). As with the 46QP peptides, oligomerization does not appear until the monomer concentration exceeds 1 μM. At that point, monomers aggregate into oligomers containing on average 10 ± 5 Httex1p-97QP-EGFP molecules as determined by the apparent molecular brightness. As more protein is expressed and the total concentration of protein increases by a factor of 1.5 to 2, determined from the number analysis, a nucleation site for the inclusion is formed in the cytoplasm (Fig. 4, green arrow). The inclusion grows in intensity and size, reaching a maximum in ∼30 min to 1 h (Fig. 4, red arrow). The inclusion recruits almost all the Httex1p-97QP-EGFP protein in the cell, shown in the intensity image at 56 h. At this point, the protein concentration is depleted to a range of ∼0.1 μM, well below the threshold level needed to form oligomers. The inclusion recruits protein from both the nucleus as well as the cytoplasm indicating that nuclear Httex1p-97QP-EGFP is in dynamic equilibrium with the cytoplasmic compartment. After formation of the inclusion, the brightness at the inclusion decreased to B = 1, indicating that the inclusion is immobile (see Methods). The histograms of the percentage of pixels in the monomer and oligomer conformation (Fig. 4) corresponding to the different phases of aggregation show the evolution of the distribution of aggregate sizes from the formation of the first oligomers to the formation of the inclusion body. The percentage of pixels with brightness values corresponding to oligomers (B > 1.4) increases until the inclusion forms (Fig. 4; yellow bar in the histogram). Because the remaining soluble protein after the inclusion is formed is monomeric, oligomers must be in equilibrium with monomers to rapidly (in minutes) leave the nucleus and be recruited by the inclusion. We never observed very large oligomeric species (>20 proteins), indicating absence of nanofibrillar structures as a separate species that would appear as bright spots in the cell.
Figure 4.
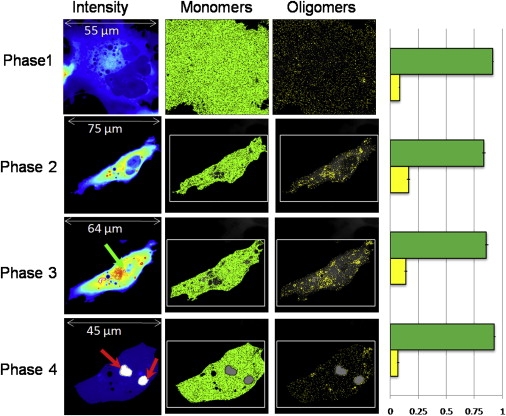
Time evolution of COS-7 cell transfected with Httex1p-97QP-EGFP. Cells were imaged with 0.8% laser power at 488 nm and 20 μs/pixel. The different rows correspond to the different phases. The first column shows the average intensity image. The molecular brightness first increases and then decreases after the formation of the inclusions (red arrows). The green arrows indicate the points of nucleation. The selection of pixels with the brightness of the monomers (B = 1.074, ɛ = 3700 cpsm) and oligomers (B = 1.74, ɛ = 37,000 cpsm) are reported in the second and third columns. In the fourth column the percentage of pixels corresponding to monomer (green) and oligomers (yellow) are reported, this graph has been obtained from the analysis of different cells at the different phases shown. The number of pixels with brightness corresponding to decamers increases until the inclusion is formed and recruits the majority of the protein.
Aggregation dynamics of Httex1p-polyQ-EGFP in ST14A cells
Httex1p aggregation was also measured in ST14A cells (Fig. 5), to determine if the mechanism of aggregation seen in COS-7 cells is similar in neuronal precursor cells. ST14A cells were transfected with mEGFP to calibrate the monomer brightness value; the monomeric brightness obtained for COS-7 and ST14A was the same (3700 cpms). Cells transfected with Httex1p-25QP-EGFP and Httex1p-46QP-EGFP constructs showed the same behavior observed in the COS-7 cells (data not shown). Similar to COS-7 cells, ST14A cells expressing Httex1p-97QP-EGFP initially formed oligomers of the same size range and at the same concentration threshold as the COS-7 cells followed by the formation of inclusions. Like the COS-7 cells, recruitment of proteins from the nucleus to the inclusion was also observed in ST14A cells. The nucleation event also starts at a localized spot in the cell (Fig. 5, green arrow). The overall aggregation process (monomer-oligomer-inclusion) was slower in these cells compared to COS-7 cells (35 h vs. 24 h). This could be attributed to lower expression levels and/or the lower culture temperature (33°C vs. 37°C). In the case of ST14A cells, the number of inclusion nucleation sites was larger than in COS-7 cells (Fig. 5).
Figure 5.
Time evolution of ST14A cell transiently transfected with Httex1p-97QP-EGFP, cells were imaged with 0.8% laser power at 488 nm and 20 μs/pixel. (First column) Intensity image, the green arrow indicates a nucleation point; red arrows indicate the inclusions. (Second column) Selection of pixels with the brightness of the monomers (B = 1.074, ɛ = 3700 cpsm). (Third column) Selection of oligomers (centered on decamer, B = 1.74, ɛ = 37,000 cpsm). In the fourth column the percentage of pixels with brightness corresponding to monomer (green) and oligomer (yellow) in different cells in the four phases are reported. The percentage of oligomers increases until the inclusion is formed and recruits the majority of the protein.
Discussion
On the basis of the N&B analysis, we propose a model for Httex1p aggregation in live cells (Fig. 6). In this model the aggregation of Httex1p-polyQ occurs in four phases.
-
1.
In the first phase (accumulation phase) there is expression of Httex1p beginning at a low protein concentration and accumulating (<1 μM). During this period there are only monomers in the cell.
-
2.
In the oligomer phase, monomers reach a threshold concentration (>1 μM), and small oligomer (∼10 ± 5 proteins) formation begins in a process that lasts ∼2 h. Monomers and oligomers are in a rapid equilibrium and accumulate to a total concentration of ∼1.5 to 2 μM. Oligomerization occurs when Httex1p has polyQ tracts of 46 Qs or longer.
-
3.
In the third phase (nucleation phase) one (or more) nucleation sites leading to large inclusions are observed in cytoplasm.
-
4.
In this phase, most of the protein present in the cell is recruited by the inclusion leaving only monomers at a depleted concentration.
This study shows a dynamic biphasic process of aggregation of mutant Httex1p with an expanded polyQ domain. We find that monomers, after achieving a cellular concentration of ∼1 μM, form oligomers. A number of factors can influence the estimate of oligomer size from the brightness fluctuation including a subset of immobile species or nonfluorescent Httex1p molecules such as endogenous protein (that is low in COS-7 cells (27)) or nonmatured EGFP molecules (it is estimated that ∼10–20% of EGFP proteins never reach maturation to become fluorescence competent (28)). All of these factors can result in an underestimation of the oligomer size. The brightness histogram shows that the distribution width does not extend more than two to three times the average value, even if the average is underestimated thus allowing one to conclude that the oligomer size is not >15 ± 5 monomers. We observe pixels with lower brightness than monomer preferentially located around the nucleus (data not shown). We interpreted this result as due to partially immobilized proteins in this region (Eqs. 5 and 6). For the rest of the cell, the brightness is relatively constant.
Figure 6.
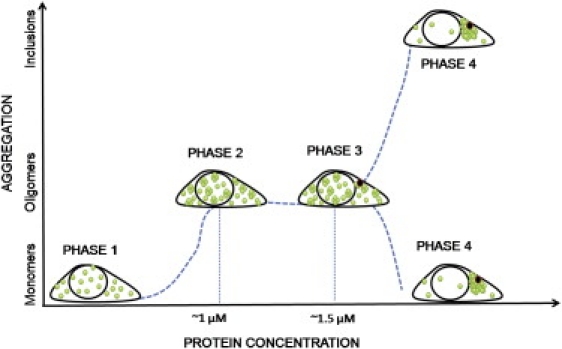
Model of Httex1p-97QP-EGFP aggregation. Phase 1, initial expression of Httex1p. The protein concentration is low (<1 μM), only monomers are detected. Phase 2, at higher protein concentration (∼1 μM of monomers), small oligomers (5–15 proteins) form in a process that lasts few hours. Phase 3, inclusions start to grow at each nucleation site. Phase 4, the inclusions recruit most of the protein present in the cell leaving only monomers at low concentration.
The process of protein aggregation in diseases such as HD has been the subject of intense study. Some studies have suggested that large inclusions are pathogenic (3) whereas others suggest that they are protective (19,29–31) and that intermediate oligomers are the pathogenic species (32). A number of studies have investigated the possible diversity of other oligomeric conformations of Htt with expanded polyQ using cell free systems. Using conformation specific antibodies and/or electron or atomic force microscopy, investigators have been able to detect a number of higher order structures such as various fibrils and amyloid like structures e.g., Tanaka (ex1) (13,33). A similar spectrum of aggregation intermediates and morphologies have been observed for many types of amyloids, such as α synuclein (34), islet amyloid (35), and nondisease-associated neoamyloids (36).
We have looked closely for evidence of multiple oligomeric forms. We find a relatively homogeneous distribution of oligomer sizes; thus, if multiple oligomeric species with different conformations are forming in this system, they are all apparently within the 5–15 particle size range. Further, we find no evidence for nanofibrils. A fibril would be readily detected in this method. Fibrils and amyloid structures will appear in the brightness histogram, unless they are immobile and if they are immobile, they will not rapidly disappear when the inclusion is formed. As none of these was observed, we conclude that the pathway to inclusion formation in living cells may involve a simpler two conformer process with monomers proceeding to oligomers that later give way to inclusions. Fibrils have been found in electron microscopy studies associated with inclusions but not as individual species (4).
There are several indications that the cellular environment affects the aggregation process. For example, the rate of inclusion maturation in this study was significantly different COS-7 versus ST14A cells, with the rate of growth of the inclusion after nucleation site varying from 30 min to 1 h. Another notable difference between cell types is in the number of inclusions formed, whereas in COS-7 cells few (max 2) big inclusions are formed, in ST14A cells, we observed more (∼10) smaller inclusions. We propose that the number of inclusions is related to the number of nucleation centers formed per unit time and the rate of inclusion growth. If the rate of nucleation sites formed is slow or the rate of inclusion growth is rapid, the first inclusion formed will recruit all proteins in the cell before other inclusions can form. The parameters affecting these behaviors remain to be determined but may include proteins such as the poly(Q)-binding peptide, QBP1, that inhibits poly(Q)-EGFP oligomer formation in vitro (14) or proteins that foster monomer stability (38). Unlike studies with inducible pC12 cells (39), we have not observed inclusions forming in the cell nucleus. This may reflect a distinct propensity of pC12 cells for nuclear seeding. Our experiments show that oligomer formation occurs only in cells that accumulate a sufficiently high monomer concentration (in the 1 μM range). We find that monomers and oligomers are in rapid equilibrium, which differs from studies of Httex1p-polyQ in solution in which fibrils and amyloid structures were observed (13). This difference suggests that protein aggregation process could be affected by the presence of other proteins, enzymes, organelles, and structures in the cells that are not found in the cell free environment of these studies.
N&B shows the process of aggregation in real-time. A distinctive advantage of this method is that aggregation is studied directly in the entire living cell. Therefore the Httex1 protein can interact with organelles, lipids, and other proteins in the cell. With this method, it is possible to observe the distribution of a protein under physiological conditions, and the time evolution of the aggregation process as the protein is expressed in the cell. Other techniques in fluorescence fluctuation analysis can measure molecular brightness (for example photon counting histogram analysis) but they do not provide information on the spatial distribution of the aggregates (40).
The protein oligomerization we observe in live cells agrees with previous studies using FCS on cell lysates that showed the oligomerization of simple polyQ peptides fused to EGFP (14). The behavior of Httex1p revealed by these studies provides a basis for understanding how inclusions may be protective (19). If oligomers are indeed a toxic species, the formation of large inclusions causes a rapid depletion of monomer concentration to a level below the threshold for oligomerization; thus protecting the cell from toxic oligomer formation. Further, although fibrils have been observed in other conditions and appear to follow a nucleation – add on mechanism (41), we find that fibril formation is not an obligate step for the formation of inclusions.
The specific fragment we have used has the EGFP construct. It is possible that the EFGP moiety could perturb the species formed in the cell environment. Although this is a possibility, we found that it is the length of the polyQ sequence that determines aggregation rather than the presence of the EFGP. Also studies with a transgenic animal model carrying the EGFP moiety show that the characteristic symptoms of HD are retained (42).
The N&B method is a powerful approach to study cellular processes involving aggregation of proteins such as receptor dimerization. This technique is not limited to intracellular processes; it can be applied to study the formation of extracellular aggregates typical of other neurodegenerative diseases (e.g., Alzheimer disease).
Acknowledgments
This work was supported in part by the Cell Migration Consortium (U54 GM064346 to M.D. and E.G.) and the National Institutes of Health (P41-RRO3155, P50-GM076516 to G.O. and E.G. and NS045283 to J.L.M). This work was made possible in part by access to the Optical Biology Shared Resource at the University of California, Irvine, supported in part by the Cancer Center Support Grant (CA-62203).
References
- 1.Bates G. Huntingtin aggregation and toxicity in Huntington's disease. Lancet. 2003;361:1642–1644. doi: 10.1016/S0140-6736(03)13304-1. [DOI] [PubMed] [Google Scholar]
- 2.Marsh J.L., Walker H., Thompson L.M. Expanded polyglutamine peptides alone are intrinsically cytotoxic and cause neurodegeneration in Drosophila. Hum. Mol. Genet. 2000;9:13–25. doi: 10.1093/hmg/9.1.13. [DOI] [PubMed] [Google Scholar]
- 3.Davies S.W., Turmaine M., Bates G.P. Formation of neuronal intranuclear inclusions underlies the neurological dysfunction in mice transgenic for the HD mutation. Cell. 1997;90:537–548. doi: 10.1016/s0092-8674(00)80513-9. [DOI] [PubMed] [Google Scholar]
- 4.DiFiglia M., Sapp E., Aronin N. Aggregation of huntingtin in neuronal intranuclear inclusions and dystrophic neurites in brain. Science. 1997;277:1990–1993. doi: 10.1126/science.277.5334.1990. [DOI] [PubMed] [Google Scholar]
- 5.Ordway J.M., Tallaksen-Greene S., Detloff P.J. Ectopically expressed CAG repeats cause intranuclear inclusions and a progressive late onset neurological phenotype in the mouse. Cell. 1997;91:753–763. doi: 10.1016/s0092-8674(00)80464-x. [DOI] [PubMed] [Google Scholar]
- 6.Yang W., Dunlap J.R., Wetzel R. Aggregated polyglutamine peptides delivered to nuclei are toxic to mammalian cells. Hum. Mol. Genet. 2002;11:2905–2917. doi: 10.1093/hmg/11.23.2905. [DOI] [PubMed] [Google Scholar]
- 7.Dobson C.M. Protein folding and misfolding. Nature. 2003;426:884–890. doi: 10.1038/nature02261. [DOI] [PubMed] [Google Scholar]
- 8.Jahn T.R., Parker M.J., Radford S.E. Amyloid formation under physiological conditions proceeds via a native-like folding intermediate. Nat. Struct. Mol. Biol. 2006;13:195–201. doi: 10.1038/nsmb1058. [DOI] [PubMed] [Google Scholar]
- 9.Wetzel R. Kinetics and thermodynamics of amyloid fibril assembly. Acc. Chem. Res. 2006;39:671–679. doi: 10.1021/ar050069h. [DOI] [PubMed] [Google Scholar]
- 10.Chen S., Ferrone F.A., Wetzel R. Huntington's disease age-of-onset linked to polyglutamine aggregation nucleation. Proc. Natl. Acad. Sci. USA. 2002;99:11884–11889. doi: 10.1073/pnas.182276099. [DOI] [PMC free article] [PubMed] [Google Scholar]
- 11.Muchowski P.J. Protein misfolding, amyloid formation, and neurodegeneration: a critical role for molecular chaperones? Neuron. 2002;35:9–12. doi: 10.1016/s0896-6273(02)00761-4. [DOI] [PubMed] [Google Scholar]
- 12.Kayed R., Head E., Glabe C.G. Common structure of soluble amyloid oligomers implies common mechanism of pathogenesis. Science. 2003;300:486–489. doi: 10.1126/science.1079469. [DOI] [PubMed] [Google Scholar]
- 13.Thakur A.K., Jayaraman M., Wetzel R. Polyglutamine disruption of the huntingtin exon 1 N terminus triggers a complex aggregation mechanism. Nat. Struct. Mol. Biol. 2009;16:380–389. doi: 10.1038/nsmb.1570. [DOI] [PMC free article] [PubMed] [Google Scholar]
- 14.Takahashi Y., Okamoto Y., Nagai Y. Detection of polyglutamine protein oligomers in cells by fluorescence correlation spectroscopy. J. Biol. Chem. 2007;282:24039–24048. doi: 10.1074/jbc.M704789200. [DOI] [PubMed] [Google Scholar]
- 15.Digman M.A., Dalal R., Gratton E. Mapping the number of molecules and brightness in the laser scanning microscope. Biophys. J. 2008;94:2320–2332. doi: 10.1529/biophysj.107.114645. [DOI] [PMC free article] [PubMed] [Google Scholar]
- 16.Dalal R.B., Digman M.A., Gratton E. Determination of particle number and brightness using a laser scanning confocal microscope operating in the analog mode. Microsc. Res. Tech. 2008;71:69–81. doi: 10.1002/jemt.20526. [DOI] [PubMed] [Google Scholar]
- 17.Cattaneo E., Conti L. Generation and characterization of embryonic striatal conditionally immortalized ST14A cells. J. Neurosci. Res. 1998;53:223–234. doi: 10.1002/(SICI)1097-4547(19980715)53:2<223::AID-JNR11>3.0.CO;2-7. [DOI] [PubMed] [Google Scholar]
- 18.Steffan J.S., Agrawal N., Marsh J.L. SUMO modification of Huntingtin and Huntington's disease pathology. Science. 2004;304:100–104. doi: 10.1126/science.1092194. [DOI] [PubMed] [Google Scholar]
- 19.Arrasate M., Mitra S., Finkbeiner S. Inclusion body formation reduces levels of mutant huntingtin and the risk of neuronal death. Nature. 2004;431:805–810. doi: 10.1038/nature02998. [DOI] [PubMed] [Google Scholar]
- 20.Gutekunst C.A., Li S.H., Li X.J. Nuclear and neuropil aggregates in Huntington's disease: relationship to neuropathology. J. Neurosci. 1999;19:2522–2534. doi: 10.1523/JNEUROSCI.19-07-02522.1999. [DOI] [PMC free article] [PubMed] [Google Scholar]
- 21.Kim Y.J., Yi Y., DiFiglia M. Caspase 3-cleaved N-terminal fragments of wild-type and mutant huntingtin are present in normal and Huntington's disease brains, associate with membranes, and undergo calpain-dependent proteolysis. Proc. Natl. Acad. Sci. USA. 2001;98:12784–12789. doi: 10.1073/pnas.221451398. [DOI] [PMC free article] [PubMed] [Google Scholar]
- 22.Bates G.P., Mangiarini L., Davies S.W. Polyglutamine expansion and Huntington's disease. Biochem. Soc. Trans. 1998;26:471–475. doi: 10.1042/bst0260471. [DOI] [PubMed] [Google Scholar]
- 23.Parker J.A., Connolly J.B., Neri C. Expanded polyglutamines in Caenorhabditis elegans cause axonal abnormalities and severe dysfunction of PLM mechanosensory neurons without cell death. Proc. Natl. Acad. Sci. USA. 2001;98:13318–13323. doi: 10.1073/pnas.231476398. [DOI] [PMC free article] [PubMed] [Google Scholar]
- 24.Sokolov S., Pozniakovsky A., Severin F. Expression of an expanded polyglutamine domain in yeast causes death with apoptotic markers. Biochim. Biophys. Acta. 2006;1757:660–666. doi: 10.1016/j.bbabio.2006.05.004. [DOI] [PubMed] [Google Scholar]
- 25.Steffan J.S., Bodai L., Thompson L.M. Histone deacetylase inhibitors arrest polyglutamine-dependent neurodegeneration in Drosophila. Nature. 2001;413:739–743. doi: 10.1038/35099568. [DOI] [PubMed] [Google Scholar]
- 26.Tarlac V., Storey E. Role of proteolysis in polyglutamine disorders. J. Neurosci. Res. 2003;74:406–416. doi: 10.1002/jnr.10746. [DOI] [PubMed] [Google Scholar]
- 27.Walker F.O. Huntington's disease. Lancet. 2007;369:218–228. doi: 10.1016/S0140-6736(07)60111-1. [DOI] [PubMed] [Google Scholar]
- 28.Padilla S., Audugé N., Coppey-Moisan M. Quantitative comparison of different fluorescent protein couples for fast FRET-FLIM acquisition. Biophys. J. 2009;97:2368–2376. doi: 10.1016/j.bpj.2009.07.044. [DOI] [PMC free article] [PubMed] [Google Scholar]
- 29.Saudou F., Finkbeiner S., Greenberg M.E. Huntingtin acts in the nucleus to induce apoptosis but death does not correlate with the formation of intranuclear inclusions. Cell. 1998;95:55–66. doi: 10.1016/s0092-8674(00)81782-1. [DOI] [PubMed] [Google Scholar]
- 30.Cummings C.J., Reinstein E., Zoghbi H.Y. Mutation of the E6-AP ubiquitin ligase reduces nuclear inclusion frequency while accelerating polyglutamine-induced pathology in SCA1 mice. Neuron. 1999;24:879–892. doi: 10.1016/s0896-6273(00)81035-1. [DOI] [PubMed] [Google Scholar]
- 31.Taylor J.P., Tanaka F., Fischbeck K.H. Aggresomes protect cells by enhancing the degradation of toxic polyglutamine-containing protein. Hum. Mol. Genet. 2003;12:749–757. doi: 10.1093/hmg/ddg074. [DOI] [PubMed] [Google Scholar]
- 32.Sánchez I., Mahlke C., Yuan J. Pivotal role of oligomerization in expanded polyglutamine neurodegenerative disorders. Nature. 2003;421:373–379. doi: 10.1038/nature01301. [DOI] [PubMed] [Google Scholar]
- 33.Nekooki-Machida Y., Kurosawa M., Tanaka M. Distinct conformations of in vitro and in vivo amyloids of huntingtin-exon1 show different cytotoxicity. Proc. Natl. Acad. Sci. USA. 2009;106:9679–9684. doi: 10.1073/pnas.0812083106. [DOI] [PMC free article] [PubMed] [Google Scholar]
- 34.Conway K.A., Harper J.D., Lansbury P.T. Fibrils formed in vitro from alpha-synuclein and two mutant forms linked to Parkinson's disease are typical amyloid. Biochemistry. 2000;39:2552–2563. doi: 10.1021/bi991447r. [DOI] [PubMed] [Google Scholar]
- 35.Janson J., Ashley R.H., Butler P.C. The mechanism of islet amyloid polypeptide toxicity is membrane disruption by intermediate-sized toxic amyloid particles. Diabetes. 1999;48:491–498. doi: 10.2337/diabetes.48.3.491. [DOI] [PubMed] [Google Scholar]
- 36.Bucciantini M., Giannoni E., Stefani M. Inherent toxicity of aggregates implies a common mechanism for protein misfolding diseases. Nature. 2002;416:507–511. doi: 10.1038/416507a. [DOI] [PubMed] [Google Scholar]
- 37.Reference deleted in proof.
- 38.Fayazi Z., Ghosh S., Kazemi-Esfarjani P. A Drosophila ortholog of the human MRJ modulates polyglutamine toxicity and aggregation. Neurobiol. Dis. 2006;24:226–244. doi: 10.1016/j.nbd.2006.06.015. [DOI] [PubMed] [Google Scholar]
- 39.Gong B., Lim M.C., Morton A.J. Time-lapse analysis of aggregate formation in an inducible PC12 cell model of Huntington's disease reveals time-dependent aggregate formation that transiently delays cell death. Brain Res. Bull. 2008;75:145–157. doi: 10.1016/j.brainresbull.2007.08.005. [DOI] [PubMed] [Google Scholar]
- 40.Chen Y., Müller J.D., Gratton E. The photon counting histogram in fluorescence fluctuation spectroscopy. Biophys. J. 1999;77:553–567. doi: 10.1016/S0006-3495(99)76912-2. [DOI] [PMC free article] [PubMed] [Google Scholar]
- 41.Lee C.C., Walters R.H., Murphy R.M. Reconsidering the mechanism of polyglutamine peptide aggregation. Biochemistry. 2007;46:12810–12820. doi: 10.1021/bi700806c. [DOI] [PubMed] [Google Scholar]
- 42.Kotliarova S., Jana N.R., Nukina N. Decreased expression of hypothalamic neuropeptides in Huntington disease transgenic mice with expanded polyglutamine-EGFP fluorescent aggregates. J. Neurochem. 2005;93:641–653. doi: 10.1111/j.1471-4159.2005.03035.x. [DOI] [PubMed] [Google Scholar]