

Abstract
Protein conformational dynamics, despite its significant anharmonicity, has been widely explored by normal mode analysis (NMA) based on atomic or coarse-grained potential functions. To account for the anharmonic aspects of protein dynamics, this study proposes, and has performed, an anharmonic NMA (ANMA) based on the Cα-only elastic network models, which assume elastic interactions between pairs of residues whose Cα atoms or heavy atoms are within a cutoff distance. The key step of ANMA is to sample an anharmonic potential function along the directions of eigenvectors of the lowest normal modes to determine the mean-squared fluctuations along these directions. ANMA was evaluated based on the modeling of anisotropic displacement parameters (ADPs) from a list of 83 high-resolution protein crystal structures. Significant improvement was found in the modeling of ADPs by ANMA compared with standard NMA. Further improvement in the modeling of ADPs is attained if the interactions between a protein and its crystalline environment are taken into account. In addition, this study has determined the optimal cutoff distances for ADP modeling based on elastic network models, and these agree well with the peaks of the statistical distributions of distances between Cα atoms or heavy atoms derived from a large set of protein crystal structures.
Introduction
Conformational dynamics at the atomic level is increasingly recognized as important in protein functions including protein-ligand interactions, protein-protein interactions, and allosteric regulation (1–3). Protein dynamics spans a wide range of timescales, from femtoseconds to seconds. Of particular interest is the long-time dynamics (microseconds to seconds) in large protein complexes, which is far beyond the timescales (nanoseconds to microseconds) of atomistic molecular dynamics (MD) simulations (4) despite fast-advancing computing technology (5). To capture such slow protein dynamics, normal mode analysis (NMA) was developed and has been widely applied (6–10). In a typical NMA of protein dynamics, an atomic or coarse-grained potential function is approximated by a harmonic potential near a minimal-energy conformation, from which a Hessian matrix (the second derivatives of potential function) is calculated. Then, a set of normal modes are solved from the Hessian matrix, and these can be used to describe small-amplitude atomic motions at low temperatures. Under harmonic assumption, the inverse of the eigenvalue of a normal mode is proportional to the mean-squared fluctuation (MSF) of atomic coordinates along the direction of its eigenvector.
To facilitate the application of NMA to large protein complexes, it is often performed based on a coarse-grained protein structural model (11). In recent studies, elastic network models (ENMs), including the anisotropic network model (ANM) (12–14) and its isotropic variation, the Gaussian network model (GNM) (15,16), have been developed to model protein dynamics at amino acid resolution. The ENM is usually constructed based on a Cα-only representation of protein structures, where pairs of residues whose Cα atoms or heavy atoms are within a cutoff distance are connected by elastic springs with a uniform (12) or distance-dependent (17,18) force constant. Such dramatic simplification allows the coarse-grained normal modes to be calculated efficiently without energy minimization. Early studies have shown that the large-scale collective motions predicted by NMA of ENMs are insensitive to the dramatic simplification in ENMs (13,14). Indeed, the lowest normal modes calculated from ENMs were found to compare well with many large-scale conformational changes observed by crystallography (13,19). Numerous studies have established ENM as an efficient means of probing the functionally relevant protein dynamics with virtually no limit in timescale or system size (20–25).
Despite the great success of NMA, its underlying assumption of harmonicity remains questionable. It is well known that protein dynamics at physiological or lower temperatures is highly anharmonic thanks to various factors, including solvation effect and the multiminima potential energy function. For example, an early study using NMA and MD simulation found that an isolated bovine pancreatic trypsin inhibitor (BPTI) exhibits marked anharmonic dynamics at temperatures of 100–120 K (26). Therefore, the standard NMA is quantitatively inaccurate to describe the anharmonic atomic fluctuations in protein structures, which often results in an underestimation of the MSF (27). To explore the anharmonic aspects of protein dynamics, the quasiharmonic analysis was developed based on the principal component analysis of an MD trajectory (28). It yields quasiharmonic modes that can be compared with the normal modes from standard NMA. In one simulation study of BPTI, it was found that the first quasiharmonic mode shows barrier crossing events on an anharmonic energy surface, whereas the higher quasiharmonic modes appear to be largely harmonic (27). In another simulation study of BPTI (29), it was shown that the larger the MSF of a quasiharmonic mode, the greater the degree of anharmonicity in its motion. For BPTI, the anharmonic modes represent only 12% of the total number of variables, but they account for 98% of the total MSF (29). Therefore, a proper account of anharmonicity for the lowest quasiharmonic or normal modes is critical to accurate modeling of protein dynamics.
Despite the strong effects of anharmonicity on the magnitude of atomic fluctuations, it has been shown that the eigenvectors of the lowest modes constitute an essential subspace of collective coordinates, which offer good descriptions of collective motions in proteins (30,31). It is argued that the directions (but not the magnitude) of these collective motions as captured by the eigenvectors of the lowest modes are insensitive to details of microscopic interactions and solvent damping (25). Therefore, a promising recipe for modeling anharmonicity within the framework of NMA is to keep the eigenvectors (but not eigenvalues) of standard NMA, and then sample atomic fluctuations/motions along the directions of these eigenvectors using an anharmonic potential function (see Methods). This general approach is here referred to as anharmonic NMA (ANMA). A similar strategy has been adopted in previous studies, where the eigenvectors of lowest normal modes were utilized to enhance MD simulations (32), refine x-ray diffraction data (33), and fit low-resolution electron microscopy maps (34) and crystallographic B factors (35).
This study employs ANMA to model anharmonicity within the framework of ENM. The ENM potential function, despite its quadratic form (Eq. 1), is actually anharmonic in Cartesian coordinate space. This study will evaluate how ANMA improves the modeling of anisotropic atomic fluctuations obtained by x-ray crystallographic studies of protein structures. Atomic fluctuations in protein crystal structures have been traditionally quantified by the isotropic temperature factors (or B factors), which use an isotropic Gaussian distribution to characterize the spread of electron density of each atom (36). Recently, a growing number of high-resolution protein crystal structures have been refined using anisotropic Gaussian distributions, which characterize atomic fluctuations by a symmetric tensor with six independent elements called anisotropic displacement parameters (ADPs) (37,38). Unlike the B factors, the ADPs describe not only the magnitude but also the direction of mean-squared atomic fluctuations. Therefore, they offer richer information of protein dynamics in crystalline states. Modeling of ADPs based on NMA has been conducted in several recent studies (39–44), which only considered harmonic contributions to protein dynamics. This study is, to our knowledge, the first in which anharmonicity is considered in the NMA-based modeling of ADPs.
Based on the modeling of ADPs from a large set of 83 high-resolution protein crystal structures studied previously (39,41,43), the main findings are summarized as follows:
-
1.
ANMA significantly improves the modeling of anisotropic atomic fluctuations described by ADPs, especially for low cutoff distances of ENMs. Unlike the standard NMA, ANMA is not susceptible to the tip effect, which causes anomalously large fluctuations of some protruding structural elements of a globular protein (45). Explicit accounting of the interactions between a protein and its crystalline environment leads to further improvement in the modeling of ADPs.
-
2.
By analyzing the cutoff-distance dependence of ADP modeling, this work determines the optimal cutoff distances for three ENM schemes (ANMCα, ANMatom, and DNM; see Methods). The values of optimal cutoff distances correspond to a secondary peak in the distribution of Cα-Cα distances, and the upper bound of a broad peak in the distribution of heavy-atom distances, which are derived from a large set of protein crystal structures. This finding hints at the dynamic importance of indirect atomic interactions beyond the range of direct interactions via van der Waals or hydrogen-bond forces.
Methods
ENM for an isolated protein structure
An ENM is constructed based on the Cα coordinates of a protein crystal structure. The potential energy of an ENM is
| (1) |
where Cij is the force constant of the spring connecting Cα atoms i and j, dij is the atomic distance between Cα atoms i and j, and dij,0 is the value of dij given by the crystal structure. Three schemes of force constant assignments are considered here:
-
1.
ANMCα:
| (2) |
where Rc is a cutoff distance that varies between 7 and 20 Å, and the value of constant C is determined by fitting the experimental ADPs (see below).
-
2.
ANMatom:
| (3) |
where θ () is the Heaviside function, and the summation is over all pairs of heavy atoms of residues i and j within a cutoff distance Ratom (Ratom varies between 4 and 15 Å). Here, i1 and j1 are indices for the heavy atoms of residues i and j.
-
3.
DNM:
| (4) |
The DNM was proposed by Kondrashov et al. (39), who set force constants for several distance ranges to the reciprocal of the total number of atomic contacts in each range. Because the number of atomic contacts grows quadratically with distance (assuming the atomic density is constant), this work's DNM formulation is essentially a continuous counterpart of the original DNM (39).
The Hessian matrix, H, is calculated as the second derivative of potential energy E (see Eq. 1) with respect to the Cartesian coordinates of Cα atoms. For a protein structure with N residues, H contains N × N superelements (called Hij) with size 3 × 3:
| (5) |
where xi,yi, and zi are the Cartesian coordinates of the Cα atom i.
A subset of total 3N normal modes is then solved. For each mode m, its eigenvalue (represented by ) and eigenvector (represented by Vm) are obtained by solving .
Anharmonicity of the ENM potential function
Although the ENM potential function in Eq. 1 has a quadratic form, it is actually anharmonic in terms of Cartesian coordinates. In fact, the NMA of ENM is based on the Taylor expansion of Eq. 1 truncated at the second order, with higher-order anharmonic terms ignored. Let us consider the elastic interaction energy between Cα atoms i and j after they undergo three-dimensional displacements and from their equilibrium positions. This energy is expanded to the fourth order as follows (for a detailed derivation, see Supporting Material):
| (6) |
where the relative displacement is partitioned into a longitudinal component, , and a transverse component, , and is the unit vector pointing from the equilibrium position of Cα atom i to that of Cα atom j, , and . If the Taylor expansion in Eq. 6 is truncated at the second order, only the longitudinal component, , contributes, whereas the transverse component, , does not. Therefore, a proper modeling of transverse fluctuations between pairs of Cα atoms requires third- or higher-order terms of Eq. 6. This cannot be achieved in standard NMA, which ignores these anharmonic terms. To evaluate the effect of anharmonic terms on atomic fluctuations, I sample along the direction of the eigenvector of each mode using the exact form of ENM potential energy (Eq. 1).
To demonstrate the anharmonicity of ENM potential energy, this study has shown the ENM energy profiles for the displacements along the eigenvectors of the lowest 10 modes, which are solved for an Escherichia coli hppk crystal structure (using ANMCα with Rc=10 Å) (see Fig. S1 in the Supporting Material). Significant deviation from a harmonic potential is indeed observed, accompanied by slight asymmetry between positive and negative displacements (Fig. S1).
ENM for a protein structure interacting with a crystalline environment
To model the effects of crystal packing on protein dynamics, I construct a Cα-only ENM consisting of two components: the Cα atoms of a main protein structure (corresponding to an asymmetric unit of a protein crystal) and an environment that includes the Cα atoms of neighboring protein molecules in a crystal. To reduce system size, the environment is truncated by keeping the Cα atoms of neighboring molecules within 25 Å from the Cα atoms of the main protein structure (43). The Cα coordinates of such a truncated environment are generated using the What If webserver (http://swift.cmbi.ru.nl/servers/html/index.html). To reduce the computing cost, one assumes that only the Cα atoms of the main protein structure can move, whereas those of the environment are fixed (43).
The potential energy of the two-component ENM is
| (7) |
where i and j (I) are indices for Cα atoms in the main structure (environment), Cij () is the force constant of the spring connecting Cα atoms i and j (I), dij(diI) is the atomic distance between Cα atoms i and j (I), and dij,0 (diI,0) is the value of dij given by the crystal structure. A parameter fenv within the range [0, 1] is introduced to tune the strength of protein-environment interactions. fenv= 0 corresponds to the case of an isolated protein structure (see Eq. 1). fenv= 1 if one assumes equal strength of interprotein and intraprotein interactions. As shown in a recent work, a small fenv (≤0.05) should be used to accurately model protein dynamics in crystalline states (43). A small fenv implies significantly weaker interactions between neighboring proteins than within a protein (for details, see Hafner and Zheng (43)).
Calculation of ADPs and B factors using ANMA and NMA
Based on NMA, the covariance matrix of Cα coordinates of the main protein structure can be constructed as
| (8) |
where wm gives the magnitude of MSF along the direction of eigenvector Vm of mode m, and the summation is over a subset of lowest normal modes (see below). Under the harmonic assumption of NMA, wm= kBT/, where kB is the Boltzmann constant and T is temperature. In ANMA, wm is determined by uniformly sampling the ENM potential function (see Eqs. 1 and 7) along the direction of Vm:
| (9) |
where is the lth displacement vector of Cα atoms along the direction of Vm, the maximal magnitude Am is chosen such that , and L is the number of sample displacements in the direction of Vm(or -Vm). To ensure good convergence, L is set to 20.
For an isolated protein, the potential energy function of Eq. 1 is used to sample along the directions of eigenvectors of a selected subset of normal modes, which include the lowest 5% of modes with positive eigenvalue, and nontranslation/nonrotation zero modes, if present. The nontranslation/nonrotation zero modes often result from the low connectivity of a subset of residues to the rest of the ENM, which tends to occur when a relatively small cutoff distance, Rc, of ENM is used. These zero modes cannot be properly considered in standard NMA because of their anomalous contributions to atomic fluctuations. The translation/rotation zero modes are excluded because their contributions to atomic fluctuations are anomalous for an isolated protein. For a protein interacting with its environment, the potential energy function of Eq. 7 (with fenv= 0.05) is used to sample along the directions of eigenvectors of a selected subset of normal modes, which includes the lowest 5% of modes with positive eigenvalue, and all zero modes (including six translation/rotation modes). The translation/rotation modes can be included because their contributions to atomic fluctuations are no longer anomalous in the presence of protein-environment interactions.
The anharmonicity of mode m is assessed by the parameter(AHm< 1 if the anharmonicity reduces the MSF along mode m; AHm> 1 if the anharmonicity increases the MSF along mode m). It is noted that AHm= 1 does not necessarily mean perfect harmonicity. AHm values are averaged over the above selected subset of normal modes to assess their overall anharmonicity.
The ith 3 × 3 diagonal block of the covariance matrix gives the theoretical prediction of the ADP tensor for Cα atom i:
| (10) |
where the diagonal elements U11, U22, and U33 give the MSF of Cα atom i along the x, y, and z directions, and the off-diagonal elements U12, U13, and U23 describe the covariance among the displacements of Cα atom i along the x, y, and z directions. Together, the six ADP elements determine a three-dimensional Gaussian distribution function that describes both the direction and magnitude of the atomic fluctuations (38). For fixed probability value, the distribution is ellipsoidal, with a directional preference along the long axis, which is given by the eigenvector of the ADP tensor with the largest eigenvalue. The anisotropy of the Gaussian distribution is defined as the ratio of the smallest to the largest eigenvalue of the ADP tensor.
The B factor is related to the trace of the ADP tensor as
| (11) |
Comparison between theoretical and experimental ADPs
To fit the theoretical ADPs (Eq. 10) to experimental ADPs for a protein structure with N Cα atoms (one ADP tensor per Cα atom), the force constant parameter, C (see Eqs. 2–4), is adjusted so that the sum of 3N diagonal elements matches up between the theoretical and experimental ADPs. Three metrics are used to assess the similarity between two ADP tensors (represented as U and V).
Real-space correlation coefficient
The real-space correlation coefficient is calculated to evaluate the overlap integral of two three-dimensional Gaussian distributions given by U and V (38):
| (12) |
Based on the real-space correlation coefficient, the modified correlation coefficient (ccmod) is introduced to evaluate the directional similarity of two ADPs:
| (13) |
where V∗ is a 3 × 3 tensor generated by taking the eigenvectors of U and using the eigenvalues of V, with the largest and smallest switched, to define the two ellipsoids with perfect misalignment (39). ccmod is 1.0 (0) if the two ellipsoids are perfectly aligned (misaligned).
Kullback-Leibler distance
The Kullback-Leibler (KL) distance (46) evaluates the difference between the three-dimensional Gaussian distributions a and b as defined by U and V (40). The KL distance can be expressed in terms of the eigenvalues (dak and dbk, k = 1,2,3) and eigenvectors (vakand vbk, k = 1,2,3) of U and V as follows:
| (14) |
Since the KL distance is asymmetrical , the arithmetic average was calculated (40). Note that Dab diverges if the distribution b is highly anisotropic (with a near-zero eigenvalue). To avoid such divergence, this study uses instead of as this study's KL distance metric (43).
Pearson correlations
The above two metrics evaluate only the directional similarity of two ADPs. To include the magnitude of ADPs in the comparison, this study computes the Pearson correlation (PCall) between two sets of ADPs as two 6N′-dimensional vectors and (40) (N′ is the number of ADPs):
| (15) |
The Pearson correlations is also calculated for 3N′ diagonal and 3N′ off-diagonal ADP elements separately (PCdiagonal and PCoffdiagonal, respectively), as well as the Pearson correlation between theoretical and experimental B factors (PCB) (40).
Crystallographic dataset for model evaluation
The modeling of ADPs is evaluated using a set of 83 high-resolution crystal structures previously studied in Kondrashov et al. (39). From the ANISOU records of these PDB structures, 16,852 usable ADPs are collected for those Cα atoms with occupancy of 1.0 (though all Cα atoms are included in the construction of ENM).
Following Kondrashov et al. (39), for the evaluation of four Pearson correlations, all 16,852 ADPs are used; for the evaluation of two directional metrics (ccmod and KL distance), a subset of 6784 ADPs with anisotropy ≤0.5 are used.
Evaluation of the statistical significance of improvement in ADP modeling
The ADP similarity metrics defined above are calculated for 6784 ADPs from 83 PDB structures using both NMA and ANMA. For a given metric S, the difference between NMA and ANMA, SANMA - SNMA, is calculated for each usable ADP (if S is ccmod or KL distance) or PDB structure (if S is PCall, PCB, PCdiagonal, or PCoffdiagonal). To evaluate the statistical significance of this difference, its average and standard deviation over 6784 usable ADPs or 83 PDB structures is calculated. Then, a Z score for S is defined as
| (16) |
where Nsamp= 6784 if S is ccmod or KL distance, and Nsamp= 83 if S is PCall, PCB, PCdiagonal, or PCoffdiagonal. (For KL distance, a minus sign is added to Eq. 16 to make ZS positive). A large Z score indicates high statistical significance for the improvement in ADP modeling from NMA to ANMA.
Results
To explore how the anharmonicity of the potential energy function affects NMA-based modeling of atomic fluctuations in protein crystal structures, this study has proposed and performed an anharmonic NMA (ANMA) in the absence and presence of interactions between a protein and its crystalline environment. This study focuses on the anharmonicity of ENM potential energy function. ANMA has been systematically compared with standard NMA based on the modeling of a large set of ADPs from 83 high-resolution protein crystal structures (39). This work now presents the findings based on the modeling results.
ANMA improves ENM-based ADP modeling
In previous ENM-based studies of atomic fluctuations in protein crystal structures (17,39–41,43,44,47,48), it was implicitly assumed that the atomic fluctuations are harmonic. Thus, the MSF along the direction of the eigenvecgtor of a normal mode is proportional to the inverse of its eigenvalue. This is not a realistic assumption for protein dynamics at physiological temperature or crystallographic temperature (26). There are two main sources of anharmonicity in protein dynamics: the presence of multiple minima in a potential energy function and the deviation of a single-minimum potential function from a harmonic well. Many previous studies have addressed the former case using MD simulations and quasiharmonic analysis (27,29). Here, the latter case is addressed. In particular, this study explores how the anharmonicity of the ENM potential function affects ENM-based modeling of atomic fluctuations in protein crystal structures. To this end, this study proposes and evaluates the ANMA protocol (for details, see Methods): 1), I solve a subset of lowest normal modes for an isolated protein structure modeled by ENM; 2), I sample the ENM potential energy function along the direction of the eigenvector of each mode, and evaluate the MSF along these directions; and 3), I construct a covariance matrix to calculate the ADP tensors. As a control, ADP tensors using standard NMA (43) are calculated. The theoretical ADPs are compared with experimental ADPs using various metrics to assess the modeling quality (see Methods). To ensure the robustness of the modeling results, I consider three ENM schemes: ANMCα, ANMatom, and DNM (see Methods).
As an example, this work shows the results of ADP modeling using ANMCα (with Rc= 7 Å) for an E. coli 6-hydroxymethyl-7,8-dihydropterin pyrophosphokinase (hppk) crystal structure (PDB code: 1F9Y) (Fig. 1 a). ANMA gives better agreement between theoretical and experimental ADPs than does NMA—the Pearson correlations for all, diagonal, and off-diagonal ADP elements and for B factors (PCall, PCdiagonal, PCoffdiagonal, PCB; see Methods) increase from 0.27, 0.18, 0.06, and 0.25 to 0.58, 0.48, 0.30, and 0.60, respectively. For the directional comparison of experimental and theoretical ADPs, this study focuses on 85 of 158 experimental ADPs with anisotropy ≤0.5 (41). Two metrics for directional similarity between theoretical and experimental ADPs (ccmod and KL distance; see Methods) are calculated, which also indicate improvement from NMA to ANMA—the average ccmod increases from 0.33 to 0.43 (Fig. 1 c) and the average KL distance decreases from 0.91 to 0.58 (Fig. 1 d). Compared with NMA, ANMA has suppressed two pronounced peaks in the theoretical B factors (Fig. 1 b) and KL distances (Fig. 1 d), which correspond to two floppy loops (residues 45–50 and 85–90) (Fig. 1 a). The account of anharmonicity by ANMA improves the modeling of atomic fluctuations in these dangling loops, as suggested by the higher ccmod (Fig. 1 c) and lower KL distance (Fig. 1 d).
Figure 1.
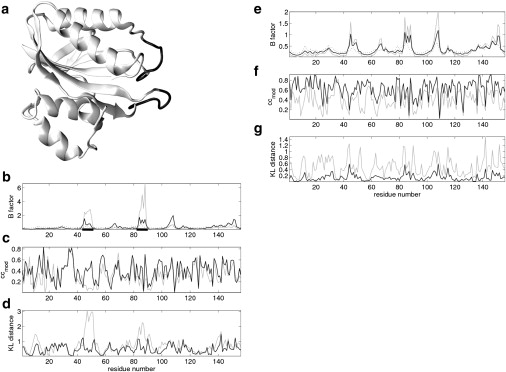
The results of ADP modeling for an E. Coli hppk crystal structure (PDB code: 1F9Y). (a) A cartoon representation of 1F9Y with two floppy loops (residues 45–50 and 85–90) colored black. (b) B factors (rescaled by 3/8π2) from crystallography (dotted line), modeled by NMA (gray line) and by ANMA with (black line) (the positions of the two loops shown in a are underscored). (c and d) ccmod and KL distance, respectively, for NMA (gray lines) and ANMA with (black lines). (e) B factors (rescaled by 3/8π2) from crystallography (dotted line), modeled by ANMA with (gray line) and by ANMA with (black line). (f and g) ccmod and KL distance, respectively, for ANMA with (gray lines) and ANMA with (black lines).
The above ADP modeling was conducted for 16,852 ADPs collected from 83 protein crystal structures (39). To assess the performance of ADP modeling, this study averages four Pearson correlations (PCall, PCB, PCdiagonal, and PCoffdiagonal) over 83 structures, and two directional metrics (ccmod and KL distance) over a subset of 6784 ADPs with anisotropy ≤0.5. These average metrics are calculated as a function of cutoff distance for ANMA and NMA based on three ENM schemes (ANMCα, ANMatom, and DNM; see Methods). The results are shown in Figs. 2–4 and Tables S1–S3. Z scores for the above metrics are calculated to assess the statistical significance of the improvement from NMA to ANMA (see Methods).
Figure 2.
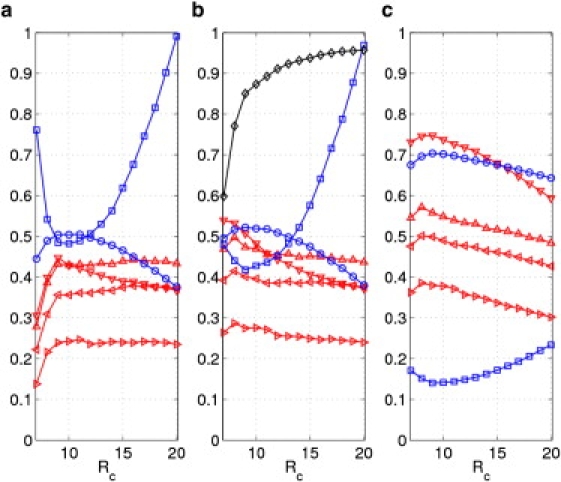
The results of ADP modeling averaged over 83 protein crystal structures (39) using ANMCα and (a) NMA, (b) ANMA with , and (c) ANMA with . Shown here are Pearson correlations of diagonal (◃), off-diagonal (▹), all elements (z.▿) of ADPs and B factors (z.▵), and directional metrics including ccmod (○) and KL distance (□) as a function of cutoff distance . Also shown in (b) is the average anharmonicity AH (◊).
Figure 3.
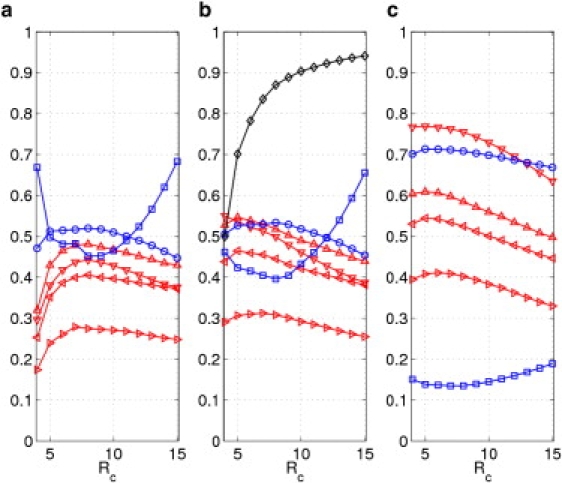
The results of ADPs modeling averaged over 83 protein crystal structures (39) using ANMatom and (a) NMA; (b) ANMA with; (c) ANMA with . Shown here are Pearson correlations of diagonal (◃), off-diagonal (▹), and all elements (▿) of ADPs, and B factors (▵), and directional metrics including ccmod (○) and KL distance (□) as a function of cutoff distance. Also shown in b is the average anharmonicity, AH (♢).
Figure 4.
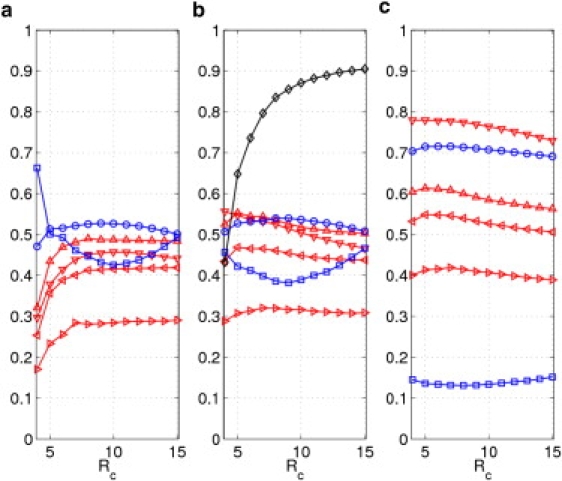
The results of ADPs modeling averaged over 83 protein crystal structures (39) using DNM and (a) NMA; (b) ANMA with ; (c) ANMA with . Shown here are Pearson correlations of diagonal (◃), off-diagonal (▹), all elements (▿) of ADPs and B factors (▵), and directional metrics including ccmod (○) and KL distance (□) as a function of cutoff distance. Also shown in b is the average anharmonicity, AH (◊).
For ANMCα, significant improvement was found in ADP modeling from NMA to ANMA, especially for Rc< 10 Å (see Table S1 in the Supporting Material and Fig. 2, a and b). For example, for Rc = 7 Å, the average Pearson correlations (PCall, PCdiagonal, PCoffdiagonal, and PCB) increase from 0.31, 0.22, 0.14, and 0.28 to 0.54, 0.39, 0.26, and 0.47; the average ccmod increases from 0.45 to 0.50; and the average KL distance decreases from 0.76 to 0.48. These improvements are highly significant, as indicated by large Z scores >10 (Table S1). For Rc ≥ 10 Å, the improvement from NMA to ANMA is smaller. For example, for Rc = 10 Å, the average Pearson correlations (PCall, PCdiagonal, PCoffdiagonal, and PCB) increase from 0.43, 0.36, 0.24, and 0.43 to 0.48, 0.40, 0.28, and 0.47; the average ccmod increases from 0.50 to 0.52; and the average KL distance decreases from 0.48 to 0.43. This smaller improvement remains statistically significant, as the Z scores for all metrics are >5 (Table S1).
For ANMatom and DNM, significant improvement was also found in ADP modeling from NMA to ANMA, especially at the low cutoff distance Ratom < 8 Å (for details, see Table S2, Table S3, and Figs. 3, a and b, and 4, a and b). Therefore, the finding that ANMA improves ENM-based ADP modeling is robust and does not rely on details of ENM schemes.
An ENM with low cutoff distance is prone to the so-called tip effect, which involves some pathological modes describing anomalously large motions of some protruding structural elements (such as a dangling loop) while the rest of the protein remains essentially static (45). The large local motions in these modes dramatically reduce the accuracy of harmonic approximation to the ENM potential function (see Eq. 6), therefore making those modes highly anharmonic. Indeed, for ANMCα (ANMatom and DNM) the average anharmonicity AH (see Methods) decreases sharply as Rc(Ratom) drops below 10 Å (8 Å) (see Figs. 2 b, 3 b, and 4 b). Therefore, it is not surprising that the proper account of anharmonicity by ANMA significantly improves ADP modeling at low cutoff distance. Thus, an accurate modeling of protein atomic fluctuations demands a proper account of the anharmonicity of the ENM potential function.
Account of protein-environment interactions further improves ADP modeling by ANMA
Previous studies have shown the significant effect of crystalline environment on protein dynamics in crystalline states (41,43,47,48). In particular, the incorporation of protein-environment interactions allows proper modeling of the contributions of rigid-body motions of an entire protein to ADPs (41,43,48), which cannot be easily attained for an isolated protein structure. Therefore, it will be interesting to incorporate protein-environment interactions in the ANMA formulation in this study. To this end, a two-component ENM comprised of a protein structure and its fixed crystalline environment has been constructed (see Methods). I have recently found the interactions between a protein and its crystalline environment to be much weaker than the intraprotein interactions (43). ANMA was performed as follows to account for the protein-environment interactions: first, solve a subset of lowest normal modes for an isolated protein structure; then sample the ENM potential energy function (with the protein-environment interactions included; see Eq. 7) along the direction of the eigenvector of each mode; then calculate the ADPs based on the sampling results (see Methods).
As an example, this study shows and compares the results of ADP modeling by ANMA in the absence and presence of protein-environment interactions (using ANMCα with Rc = 7 Å) for an E. Coli hppk crystal structure (PDB code: 1F9Y) (Fig. 1 a). Large improvement in ADP modeling is found in terms of the four Pearson correlations—PCall, PCdiagonal, PCoffdiagonal, and PCB change from 0.58, 0.48, 0.30, and 0.60 to 0.75, 0.56, 0.39, and 0.65. Furthermore, improvement is found in terms of the directional similarity in ADPs—the average ccmod increases from 0.43 to 0.66 (Fig. 1 f), and the average KL distance decreases from 0.58 to 0.18 (Fig. 1 g).
The results of ADP modeling in the presence of protein-environment interactions for 83 protein crystal structures (39) are shown in Figs. 2 c, 3 c, and 4 c, and Table S1, Table S2, and Table S3, which are compared with the results for isolated protein structures (see Figs. 2 b, 3 b, and 4 b, and Table S1, Table S2, and Table S3). The findings are summarized as follows.
For ANMCα, a significant improvement was found in modeling of the direction of ADP tensors with the addition of protein-environment interactions (Fig. 2, b and c)—for example, for Rc = 10 Å, the average ccmod increases from 0.52 to 0.70 and the average KL distance decreases from 0.43 to 0.14. Furthermore, there is large improvement in the modeling of both magnitude and direction of ADP tensors as assessed by the four Pearson correlations.
For ANMatom and DNM, a significant improvement was also found in the modeling of ADP tensors (see Figs. 3, b and c, and 4, b and c). Therefore, this finding is robust and does not rely on details of ENM schemes.
Optimal cutoff distances of ENM for ADP modeling by ANMA
In previous studies, it was found that the optimal fitting of B-factors by ANMCα is attained at a high cutoff distance Rc = 15–24 Å (49), which is beyond the range of Cα-Cα distances between contacting residues (4.4–12.8 Å (50)). Some recent studies have addressed this inconsistency in ENM parameterization (43,51). To further address this issue, this study evaluates the quality of ADP modeling by NMA and ANMA as a function of cutoff distance using three ENM schemes (Rc for ANMCα, Ratom for ANMatom, and DNM).
The Rc dependence for ANMCα is summarized in Fig. 2. For NMA (Fig. 2 a), the Rc dependence of various ADP comparison metrics diverges: PCdiagonal, PCoffdiagonal, and PCB saturate as Rc increases from 9 to 20 Å, whereas PCall peaks at Rc ∼ 9 Å; ccmod peaks at Rc ∼ 10 Å; and the KL distance is minimal at Rc ∼ 10 Å. Such divergence was also found in a previous study (43), which makes it hard to parameterize ENM by optimizing the fitting of ADPs.
For ANMA (Fig. 2 b), the divergence of the Rc dependence of various ADP comparison metrics is reduced: PCdiagonal, PCoffdiagonal, PCB and PCall peak at Rc ∼ 8 Å, ccmod peaks at Rc ∼ 9 Å, and the KL distance is minimal at Rc ∼ 9 Å. Thus, a consensus-based optimization of various ADP comparison metrics points to an optimal Rc of ∼8–9 Å, which falls well within the range of Cα-Cα distances between contacting residues (4.4–12.8 Å (50)). Note that the addition of protein-environment interactions does not change the optimal Rc values (Fig. 2 c).
The Ratom dependence for ANMatom and DNM is summarized in Figs. 3 and 4, respectively. For ANMA based on ANMatom (Fig. 3 b), the Rc dependence differs among various ADP comparison metrics: PCdiagonal, PCall and PCB peak at Ratom ∼ 5 Å, PCoffdiagonal peaks at Ratom ∼ 7 Å, whereas ccmod peaks at Ratom ∼ 8 Å, and the KL distance is minimal at Ratom ∼ 8 Å. The optimal Ratom values are only slightly shifted with the addition of protein-environment interactions (Fig. 3 c).
For ANMA based on DNM, the results are similar. For example, ccmod peaks at Ratom ∼ 9 Å, and the KL distance is minimal at Ratom ∼ 9 Å (Fig. 4 b), which agrees with the results of Riccardi et al. (41). The optimal Ratomvalues are only slightly shifted with the addition of protein-environment interactions (Fig. 4 c).
This work's finding that the optimal modeling of the direction of ADPs by ANMatom (DNM) is at Ratom ∼ 8 Å (9 Å) is surprising, because this heavy-atom distance is beyond the range of van der Waals interactions (<4 Å as estimated based on van der Waals radii (52)) or hydrogen-bond interactions (<4.5 Å as defined in the CONGEN program (53)).
Statistical distribution of atomic distances agrees with optimal cutoff distances
To rationalize the finding of an optimal cutoff distance of ∼10 Å for ANMCα, this work analyzes the statistical distribution, ρ(r), of distances between the Cα atoms of nonbonded residues of 83 protein crystal structures (39). ρ(r) is given by f(r)/4πr2, where f(r) is the percentage of all Cα-Cα distances within the range (r − 0.5, r + 0.5), and r is sampled at integer values (in Å). It is interesting that this study found that ρ(r) has a primary peak around 5–6 Å and a secondary peak at 10 Å (Fig. 5 a). These two peaks correspond to two minima of a statistical potential function based on Cα-Cα distances. The coincidence of the secondary peak of ρ(r) and the optimal Rc for ANMCα hints at the presence of effective interactions between residues separated by a Cα-Cα distance of ≤10 Å, which is important to protein dynamics.
Figure 5.
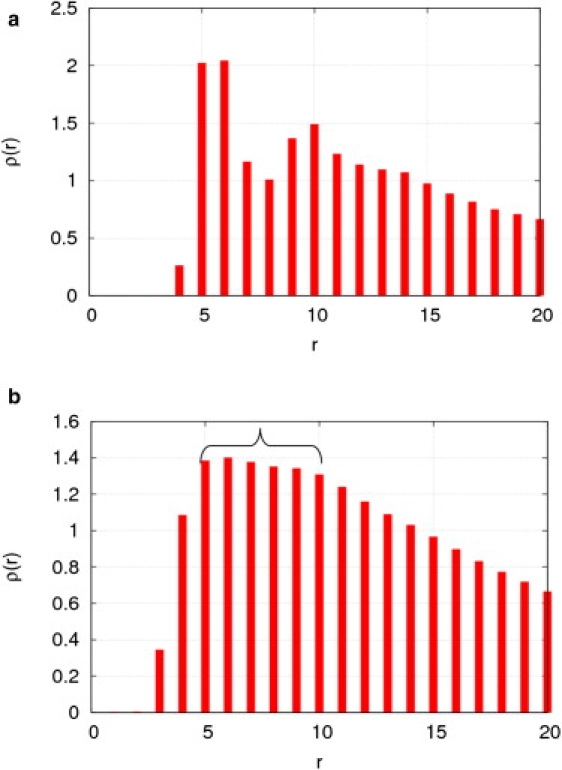
The density functions for the statistical distributions of distances between (a) Cα atoms and (b) heavy atoms of nonbonded residues in 83 protein crystal structures (39). ρ(r) is rescaled by the density function ρ0 for a uniform distribution. The same statistical distributions (not shown here) are obtained from a much larger set of >2000 protein crystal structures (cullpdb_pc30_res1.6_R0.25_d081223_chains2039, downloaded from http://dunbrack.fccc.edu/PISCES.php).
In a similar way, to rationalize the finding of an optimal atomic distance of ∼8 Å (9 Å) for ANMatom (DNM), this work analyzes the statistical distribution of distances between the heavy atoms of nonbonded residues of 83 protein crystal structures (39). The distribution shows a broad peak ranging from 5 to 10 Å (Fig. 5 b), which suggests the presence of statistical interactions between heavy atoms from different residues separated by ≤10 Å. This value is beyond the range of van der Waals or hydrogen-bond interactions. The idea that long-range electrostatic interactions may be the cause is ruled out, because the same distribution is obtained after charged residues are excluded from the statistical analysis. This observation roughly agrees with this study's finding of Ratom ∼ 8 Å (9 Å) as the optimal atomic distance for ANMatom (DNM). Taken together, these findings support the presence of indirect interactions between atoms separated by ≤10 Å and the importance of these interactions to protein dynamics. Such effective interactions may arise as a result of averaging over some hidden variables (such as multiple substates of a protein native state).
Discussion and Conclusion
To account for the anharmonic aspects of protein dynamics, this study has used ANMA to model the ADPs from a set of 83 high-resolution protein crystal structures. Significant improvement was found in the modeling of ADPs by ANMA compared with standard NMA. Further improvement in the modeling of ADPs is attained if the interactions between a protein and its crystalline environment are taken into account. In addition, this work has determined the optimal cutoff distances for ENM-based ADP modeling, which agree well with the peaks of the statistical distributions of distances between Cα atoms or heavy atoms deduced from a large set of protein crystal structures.
This work applied ANMA to explore the anharmonicity of the ENM potential function (Eq. 1). It is straightforward to apply ANMA to any other anharmonic potential function (such as a Lennard-Jones potential). In fact, I applied ANMA to the generalized potential function , which is reduced to the ENM potential in Eq. 1 when n = −1 and to a Lennard-Jones potential when n = 6. The application of ANMA to this generalized potential function, however, does not lead to further improvement of ADP modeling (data not shown).
In this study, the anharmonicity, AH, is found to be <1 (see Figs. 2 b, 3 b, and 4 b). Therefore, anharmonicity of the ENM potential function results in the stiffening of a normal mode (or reduction of the MSF along the direction of its eigenvector). This finding complements the early findings of a softening of normal modes due to the presence of multiple potential energy minima (27,29).
By using a fixed set of eigenvectors solved by standard NMA, this study focuses on the anharmonic effect on the magnitude of atomic fluctuations. It will be interesting to explore in future studies the anharmonic effect on the direction of atomic fluctuations.
This study offers a new avenue to the accurate parameterization of ENM beyond the limit of harmonic approximation. The correlation of optimal ENM parameters with statistical distributions of atomic distances may also offer a systematic way to develop ENM parameters based on residue type. A more accurate ENM is essential to the development and refinement of ENM-based techniques that probe protein dynamics of functional relevance (54–57).
Supporting Material
One figure and three tables are available at http://www.biophysj.org/biophysj/supplemental/S0006-3495(10)00359-0.
Supporting Material
Acknowledgments
The author thanks the American Heart Association (0835292N) for funding support.
References
- 1.Henzler-Wildman K., Kern D. Dynamic personalities of proteins. Nature. 2007;450:964–972. doi: 10.1038/nature06522. [DOI] [PubMed] [Google Scholar]
- 2.Boehr D.D., Nussinov R., Wright P.E. The role of dynamic conformational ensembles in biomolecular recognition. Nat. Chem. Biol. 2009;5:789–796. doi: 10.1038/nchembio.232. [DOI] [PMC free article] [PubMed] [Google Scholar]
- 3.Bahar I., Chennubhotla C., Tobi D. Intrinsic dynamics of enzymes in the unbound state and relation to allosteric regulation. Curr. Opin. Struct. Biol. 2007;17:633–640. doi: 10.1016/j.sbi.2007.09.011. [DOI] [PMC free article] [PubMed] [Google Scholar]
- 4.Karplus M., McCammon J.A. Molecular dynamics simulations of biomolecules. Nat. Struct. Biol. 2002;9:646–652. doi: 10.1038/nsb0902-646. [DOI] [PubMed] [Google Scholar]
- 5.Klepeis J.L., Lindorff-Larsen K., Shaw D.E. Long-timescale molecular dynamics simulations of protein structure and function. Curr. Opin. Struct. Biol. 2009;19:120–127. doi: 10.1016/j.sbi.2009.03.004. [DOI] [PubMed] [Google Scholar]
- 6.Brooks B.R., Karplus M. Harmonic dynamics of proteins: normal modes and fluctuations in bovine pancreatic trypsin inhibitor. Proc. Natl. Acad. Sci. USA. 1983;80:6571–6575. doi: 10.1073/pnas.80.21.6571. [DOI] [PMC free article] [PubMed] [Google Scholar]
- 7.Brooks B.R., Janezic D., Karplus M. Harmonic analysis of large systems. I. Methodology. J. Comput. Chem. 2004;16:1522–1542. [Google Scholar]
- 8.Go N., Noguti T., Nishikawa T. Dynamics of a small globular protein in terms of low-frequency vibrational modes. Proc. Natl. Acad. Sci. USA. 1983;80:3696–3700. doi: 10.1073/pnas.80.12.3696. [DOI] [PMC free article] [PubMed] [Google Scholar]
- 9.Levitt M., Sander C., Stern P.S. Protein normal-mode dynamics: trypsin inhibitor, crambin, ribonuclease and lysozyme. J. Mol. Biol. 1985;181:423–447. doi: 10.1016/0022-2836(85)90230-x. [DOI] [PubMed] [Google Scholar]
- 10.Cui Q., Bahar I. CRC Press; Boca Raton, FL: 2005. Normal Mode Analysis: Theory and Applications to Biological and Chemical Systems. [Google Scholar]
- 11.Tozzini V. Coarse-grained models for proteins. Curr. Opin. Struct. Biol. 2005;15:144–150. doi: 10.1016/j.sbi.2005.02.005. [DOI] [PubMed] [Google Scholar]
- 12.Tirion M.M. Large amplitude elastic motions in proteins from a single-parameter, atomic analysis. Phys. Rev. Lett. 1996;77:1905–1908. doi: 10.1103/PhysRevLett.77.1905. [DOI] [PubMed] [Google Scholar]
- 13.Tama F., Sanejouand Y.H. Conformational change of proteins arising from normal mode calculations. Protein Eng. 2001;14:1–6. doi: 10.1093/protein/14.1.1. [DOI] [PubMed] [Google Scholar]
- 14.Atilgan A.R., Durell S.R., Bahar I. Anisotropy of fluctuation dynamics of proteins with an elastic network model. Biophys. J. 2001;80:505–515. doi: 10.1016/S0006-3495(01)76033-X. [DOI] [PMC free article] [PubMed] [Google Scholar]
- 15.Bahar I., Atilgan A.R., Erman B. Direct evaluation of thermal fluctuations in proteins using a single-parameter harmonic potential. Fold. Des. 1997;2:173–181. doi: 10.1016/S1359-0278(97)00024-2. [DOI] [PubMed] [Google Scholar]
- 16.Haliloglu T., Bahar I., Erman B. Gaussian dynamics of folded proteins. Phys. Rev. Lett. 1997;79:3090–3093. [Google Scholar]
- 17.Kondrashov D.A., Cui Q., Phillips G.N. Optimization and evaluation of a coarse-grained model of protein motion using x-ray crystal data. Biophys. J. 2006;91:2760–2767. doi: 10.1529/biophysj.106.085894. [DOI] [PMC free article] [PubMed] [Google Scholar]
- 18.Yang L., Song G., Jernigan R.L. Protein elastic network models and the ranges of cooperativity. Proc. Natl. Acad. Sci. USA. 2009;106:12347–12352. doi: 10.1073/pnas.0902159106. [DOI] [PMC free article] [PubMed] [Google Scholar]
- 19.Krebs W.G., Alexandrov V., Gerstein M. Normal mode analysis of macromolecular motions in a database framework: developing mode concentration as a useful classifying statistic. Proteins. 2002;48:682–695. doi: 10.1002/prot.10168. [DOI] [PubMed] [Google Scholar]
- 20.Bahar I., Rader A.J. Coarse-grained normal mode analysis in structural biology. Curr. Opin. Struct. Biol. 2005;15:586–592. doi: 10.1016/j.sbi.2005.08.007. [DOI] [PMC free article] [PubMed] [Google Scholar]
- 21.Tama F., Brooks C.L. Symmetry, form, and shape: guiding principles for robustness in macromolecular machines. Annu. Rev. Biophys. Biomol. Struct. 2006;35:115–133. doi: 10.1146/annurev.biophys.35.040405.102010. [DOI] [PubMed] [Google Scholar]
- 22.Rader A.J., Vlad D.H., Bahar I. Maturation dynamics of bacteriophage HK97 capsid. Structure. 2005;13:413–421. doi: 10.1016/j.str.2004.12.015. [DOI] [PubMed] [Google Scholar]
- 23.Wang Y., Rader A.J., Jernigan R.L. Global ribosome motions revealed with elastic network model. J. Struct. Biol. 2004;147:302–314. doi: 10.1016/j.jsb.2004.01.005. [DOI] [PubMed] [Google Scholar]
- 24.Lezon T.R., Sali A., Bahar I. Global motions of the nuclear pore complex: insights from elastic network models. PLOS Comput. Biol. 2009;5:e1000496. doi: 10.1371/journal.pcbi.1000496. [DOI] [PMC free article] [PubMed] [Google Scholar]
- 25.Ma J. Usefulness and limitations of normal mode analysis in modeling dynamics of biomolecular complexes. Structure. 2005;13:373–380. doi: 10.1016/j.str.2005.02.002. [DOI] [PubMed] [Google Scholar]
- 26.Hayward J.A., Smith J.C. Temperature dependence of protein dynamics: computer simulation analysis of neutron scattering properties. Biophys. J. 2002;82:1216–1225. doi: 10.1016/S0006-3495(02)75478-7. [DOI] [PMC free article] [PubMed] [Google Scholar]
- 27.Hayward S., Kitao A., Go N. Harmonic and anharmonic aspects in the dynamics of BPTI: a normal mode analysis and principal component analysis. Protein Sci. 1994;3:936–943. doi: 10.1002/pro.5560030608. [DOI] [PMC free article] [PubMed] [Google Scholar]
- 28.Levy R.M., Srinivasan A.R., McCammon J.A. Quasi-harmonic method for studying very low frequency modes in proteins. Biopolymers. 1984;23:1099–1112. doi: 10.1002/bip.360230610. [DOI] [PubMed] [Google Scholar]
- 29.Hayward S., Kitao A., Go N. Harmonicity and anharmonicity in protein dynamics: a normal mode analysis and principal component analysis. Proteins. 1995;23:177–186. doi: 10.1002/prot.340230207. [DOI] [PubMed] [Google Scholar]
- 30.Hayward S., Go N. Collective variable description of native protein dynamics. Annu. Rev. Phys. Chem. 1995;46:223–250. doi: 10.1146/annurev.pc.46.100195.001255. [DOI] [PubMed] [Google Scholar]
- 31.Kitao A., Go N. Conformational dynamics of polypetides and proteins in the dihedral angle space and in the cartesian coordinate space: Normal mode analysis of deca-alanine. J. Comput. Chem. 2004;12:359–368. [Google Scholar]
- 32.Zhang Z., Shi Y., Liu H. Molecular dynamics simulations of peptides and proteins with amplified collective motions. Biophys. J. 2003;84:3583–3593. doi: 10.1016/S0006-3495(03)75090-5. [DOI] [PMC free article] [PubMed] [Google Scholar]
- 33.Delarue M., Dumas P. On the use of low-frequency normal modes to enforce collective movements in refining macromolecular structural models. Proc. Natl. Acad. Sci. USA. 2004;101:6957–6962. doi: 10.1073/pnas.0400301101. [DOI] [PMC free article] [PubMed] [Google Scholar]
- 34.Tama F., Miyashita O., Brooks C.L. Flexible multi-scale fitting of atomic structures into low-resolution electron density maps with elastic network normal mode analysis. J. Mol. Biol. 2004;337:985–999. doi: 10.1016/j.jmb.2004.01.048. [DOI] [PubMed] [Google Scholar]
- 35.Song G., Jernigan R.L. vGNM: a better model for understanding the dynamics of proteins in crystals. J. Mol. Biol. 2007;369:880–893. doi: 10.1016/j.jmb.2007.03.059. [DOI] [PMC free article] [PubMed] [Google Scholar]
- 36.Willis B.T.M., Pryor A.W. Cambridge University Press; London: 1975. Thermal Vibrations in Crystallography. [Google Scholar]
- 37.Scheringer C. On the interpretation of anisotropic temperature factors. III. Anharmonic motions. Acta Crystallogr. A. 1977;33:879–884. [Google Scholar]
- 38.Merritt E.A. Comparing anisotropic displacement parameters in protein structures. Acta Crystallogr. D Biol. Crystallogr. 1999;D55:1997–2004. doi: 10.1107/s0907444999011853. [DOI] [PubMed] [Google Scholar]
- 39.Kondrashov D.A., Van Wynsberghe A.W., Phillips G.N. Protein structural variation in computational models and crystallographic data. Structure. 2007;15:169–177. doi: 10.1016/j.str.2006.12.006. [DOI] [PMC free article] [PubMed] [Google Scholar]
- 40.Eyal E., Chennubhotla C., Bahar I. Anisotropic fluctuations of amino acids in protein structures: insights from x-ray crystallography and elastic network models. Bioinformatics. 2007;23:i175–i184. doi: 10.1093/bioinformatics/btm186. [DOI] [PubMed] [Google Scholar]
- 41.Riccardi D., Cui Q., Phillips G.N. Application of elastic network models to proteins in the crystalline state. Biophys. J. 2009;96:464–475. doi: 10.1016/j.bpj.2008.10.010. [DOI] [PMC free article] [PubMed] [Google Scholar]
- 42.Lu M., Ma J. A minimalist network model for coarse-grained normal mode analysis and its application to biomolecular x-ray crystallography. Proc. Natl. Acad. Sci. USA. 2008;105:15358–15363. doi: 10.1073/pnas.0806072105. [DOI] [PMC free article] [PubMed] [Google Scholar]
- 43.Hafner J.P., Zheng W. Optimal modeling of atomic fluctuations in protein crystal structures for weak crystal contact interactions. J. Chem. Phys. 2010;132:014111. doi: 10.1063/1.3288503. [DOI] [PubMed] [Google Scholar]
- 44.Yang L., Song G., Jernigan R.L. Comparisons of experimental and computed protein anisotropic temperature factors. Proteins. 2009;76:164–175. doi: 10.1002/prot.22328. [DOI] [PMC free article] [PubMed] [Google Scholar]
- 45.Lu M., Poon B., Ma J. A new method for coarse-grained elastic normal-mode analysis. J. Chem. Theory Comput. 2006;2:464–471. doi: 10.1021/ct050307u. [DOI] [PMC free article] [PubMed] [Google Scholar]
- 46.Kullback S., Leibler R.A. On information and sufficiency. Ann. Math. Stat. 1951;22:79–86. [Google Scholar]
- 47.Kundu S., Melton J.S., Phillips G.N. Dynamics of proteins in crystals: comparison of experiment with simple models. Biophys. J. 2002;83:723–732. doi: 10.1016/S0006-3495(02)75203-X. [DOI] [PMC free article] [PubMed] [Google Scholar]
- 48.Hinsen K. Structural flexibility in proteins: impact of the crystal environment. Bioinformatics. 2008;24:521–528. doi: 10.1093/bioinformatics/btm625. [DOI] [PubMed] [Google Scholar]
- 49.Eyal E., Yang L.W., Bahar I. Anisotropic network model: systematic evaluation and a new web interface. Bioinformatics. 2006;22:2619–2627. doi: 10.1093/bioinformatics/btl448. [DOI] [PubMed] [Google Scholar]
- 50.Cieplak M., Hoang T.X. Universality classes in folding times of proteins. Biophys. J. 2003;84:475–488. doi: 10.1016/S0006-3495(03)74867-X. [DOI] [PMC free article] [PubMed] [Google Scholar]
- 51.Zheng W. A unification of the elastic network model and the Gaussian network model for optimal description of protein conformational motions and fluctuations. Biophys. J. 2008;94:3853–3857. doi: 10.1529/biophysj.107.125831. [DOI] [PMC free article] [PubMed] [Google Scholar]
- 52.Bondi A. van der Waals volumes and radii. J. Phys. Chem. 1964;68:441–451. [Google Scholar]
- 53.Bruccoleri R.E., Haber E., Novotný J. Structure of antibody hypervariable loops reproduced by a conformational search algorithm. Nature. 1988;335:564–568. doi: 10.1038/335564a0. [DOI] [PubMed] [Google Scholar]
- 54.Zheng W. Normal-mode-based modeling of allosteric couplings that underlie cyclic conformational transition in F(1) ATPase. Proteins. 2009;76:747–762. doi: 10.1002/prot.22386. [DOI] [PubMed] [Google Scholar]
- 55.Zheng W., Brooks B.R., Hummer G. Protein conformational transitions explored by mixed elastic network models. Proteins. 2007;69:43–57. doi: 10.1002/prot.21465. [DOI] [PubMed] [Google Scholar]
- 56.Zheng W., Tekpinar M. Large-scale evaluation of dynamically important residues in proteins predicted by the perturbation analysis of a coarse-grained elastic model. BMC Struct. Biol. 2009;9:45. doi: 10.1186/1472-6807-9-45. [DOI] [PMC free article] [PubMed] [Google Scholar]
- 57.Zheng W., Thirumalai D. Coupling between normal modes drives protein conformational dynamics: illustrations using allosteric transitions in myosin II. Biophys. J. 2009;96:2128–2137. doi: 10.1016/j.bpj.2008.12.3897. [DOI] [PMC free article] [PubMed] [Google Scholar]
Associated Data
This section collects any data citations, data availability statements, or supplementary materials included in this article.