

Abstract
Fluorescence correlation spectroscopy is applied on homologous human lectins (i.e., adhesion/growth-regulatory galectins) to detect influence of ligand binding and presence of the linker peptide in tandem-repeat-type proteins on hydrodynamic properties. Among five tested proteins, lactose binding increased the diffusion constant only in the cases of homodimeric galectin-1 and the linkerless variant of tandem-repeat-type galectin-4. To our knowledge, the close structural similarity among galectins does not translate into identical response to ligand binding. Kinetic measurements show association and dissociation rate constants in the order of 1 to 103 M−1 s−1 and 10−4 s−1, respectively. Presence of the linker peptide in tandem-repeat-type protein leads to anomalous scaling with molecular mass. These results provide what we believe to be new insights into lectin responses to glycan binding, detectable so far only by small angle neutron scattering, and the structural relevance of the linker peptide. Methodologically, fluorescence correlation spectroscopy is shown to be a rather simple technical tool to characterize hydrodynamic properties of these proteins at a high level of sensitivity.
Introduction
The glycan chains of cellular glycoconjugates harbor ideal properties for high-density storage of biological information, the basis of the sugar code (1). Triggering distinct biological effects requires effectors, termed lectins (1), which translate the sugar-based information into respective biosignaling (2,3). Rather subtle structural modifications in glycan structure such as core substitutions of N-glycans or branch-end variants lead to pronounced changes of lectin reactivity, as exemplified for members of the family of adhesion/growth-regulatory galectins (4,5). The coordinated regulation of lectin expression with suitable shifts in the glycan profile to increase susceptibility to this effector underscores the immediate physiological relevance of the respective protein-carbohydrate interactions, e.g., in tumor growth or autoimmune regulation up to the clinical level (6–10). This emerging medical relevance prompts us to study the structural aspects of lectins in solution in detail, especially in view of their intrafamily diversification. Looking at the galectins, the homologous carbohydrate recognition domains (CRDs) are presented in three different topological modes (11,12), i.e., as homodimeric prototype modules such as galectin-1 (Gal-1), as part of a chimeric display associated with two further protein domains in Gal-3, and as tandem-repeat-type proteins where a peptide linker connects two different CRDs such as in Gal-4, -8, and -9. These three types of structural display in the galectin family are illustrated in Fig. 1. Fig. 2 shows the x-ray structure of the prototype design of Gal-1.
Figure 1.

Illustration of the three types of spatial arrangement of carbohydrate recognition domains in human galectins using the tested representatives as examples: homodimeric prototype galectin-1 (top; hGal-1), chimera-type galectin-3 with its N-terminal domain for serine phosphorylation and its collagenase-sensitive stalk (middle; hGal-3) and tandem-repeat-type galectins-4, -8, and -9 (bottom; hGal-4, hGal-8/-9). Two tested variants include proteolytically truncated galectin-3 (hGal-3tr) and the conversion of tandem-repeat-type galectin-4 into a prototype form by loss of its linker peptide (hGal-4PT). Ligand binding is given, its effect on the diffusion constant is reflected in the size of the depicted lectin (compaction) and the color toning.
Figure 2.
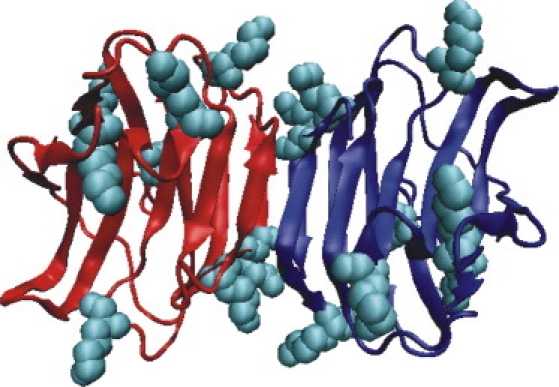
Crystal structure of homodimeric hGal-1 (PDB code: 1gzw) displayed using VMD (visualization of protein structure with protomer 1 in red, protomer 2 in blue). All lysine residues are given as van der Waals spheres (cyan).
Because cross-linking is a hallmark of these lectins' activity (13,14), it is of utmost importance to delineate the structural properties of these potent effectors in solution. Respective measurements have been carried out by gel filtration, ultracentrifugation, and small-angle scattering using x-ray or neutron sources (SANS) on human galectins (hGal)-1 and -3 (15–18). To our knowledge, no analysis for any human tandem-repeat-type protein has been done thus far. Of note, the application of SANS to hGal-1 and a plant lectin with β-trefoil folding has even facilitated to detect an influence of ligand binding on the gyration radius not observable in gel filtration or ultracentrifugation (15,19). Thus, two pertinent questions are to be resolved by biophysical experiments in comparative set-ups: a), how will the presence of the linker affect the hydrodynamic properties in galectins; and b), is the decrease in gyration radius on ligand binding to human galectin-1 a common phenomenon for the galectins that share sequence homology? Toward this end, we tested the family members mentioned above and shown in Fig. 1. Additionally, we engineered a mutant by deleting the linker region entirely, turning a tandem-repeat-type protein into a prototype-like (linkerless) variant for human galectin-4 (hGal-4PT), a routing vehicle for apical transport of glycoproteins (20,21). Also, we proteolytically removed the N-terminal domain for phosphorylation and the collagenase-sensitive stalk from human galectin-3 to produce its truncated form (Fig. 1) that can also be generated physiologically by action of matrix metalloproteinases (22). As technical means we used a spectroscopic method monitoring the behavior of fluorescence-dye labeled proteins.
Fluorescence correlation spectroscopy (FCS) is a powerful method to study translational, rotational, and intramolecular diffusion of proteins in aqueous solution by analyzing temporal fluctuations of a fluorescence signal (23–28). Variations in the diffusion constants report on conformational changes, protein-ligand binding, or dissociation of macromolecular complexes. By making use of extrinsic fluorescent labels, FCS exploits the high, single-molecule sensitivity of fluorescence monitoring (29). Toward this end, a number of high-yield and photostable fluorophores are commercially available. They can be attached readily to biomolecules through specific chemical reactions (e.g., to primary amine groups) (30). FCS is particularly useful for monitoring molecular recognition processes between biomolecules and ligands.
In this study, we introduce FCS to the monitoring of hydrodynamic behavior of lectins, focusing on representative members of the three groups of adhesion/growth-regulatory galectins comparatively. After ascertaining controls for homodimeric hGal-1 and the two forms of hGal-3, we present initial information on the hydrodynamic behavior of human tandem-repeat-type galectins and the effect of linker deletion. We also report on how different galectins respond to binding their pan-ligand lactose and on the kinetics of the binding process. In technical terms, we show what we believe to be the feasibility of FCS relative to SANS measurements and determine its sensitivity.
Materials and Methods
Galectin preparation and quality control
Lectins were purified after recombinant production from extracts by affinity chromatography on lactosylated Sepharose 4B, obtained by resin activation with divinyl sulfone. Controls for quality and purity were carried out by one- and two-dimensional gel electrophoresis, mass spectrometry, and gel filtration, for activity by hemagglutination and solid-phase/cell binding (16,31–35). Generation of the linkerless hGal-4 variant (hGal-4PT) was accomplished by rejoining domain sequences via HindIII restriction sites as described (36). Collagenase digestion and product analysis by ESI-MS on a QToF instrument type Q-Tof2 (Waters Micromass, Manchester, UK) to verify cleavage at the Tyr106/Gly107 and Glu229/Ile230 peptide bonds were carried out as described (22).
Fluorescence labeling of galectins
Galectins were fluorescently labeled by conjugating surface-exposed lysine residues to the amino-reactive fluorophore ALEXA647-NHS (Invitrogen GmbH, Karlsruhe, Germany) through classic N-hydroxysuccinimidylester chemistry. Reactive ALEXA647-NHS (100 μg) was dissolved in 50 μL dimethylformamide. Galectin (∼100 μg) was dissolved in 20-μL quantities of phosphate-buffered saline (PBS; Sigma, Munich, Germany) and 20 μL NaHCO3 solution (100 mM, pH 8.3). Dye and protein solutions were mixed and this mixture was incubated for 1.5 h at room temperature to end up at ∼1- protein labeling degree. For higher labeling degrees we increased the dye/protein ratio by a factor of maximally five and incubated for >2 h plus an additional 45 min at 32°C. Conjugates were purified via size-exclusion column chromatography (Toyo Pearl, HW-40F; Tosoh Bioscience GmbH, Stuttgart, Germany) and stored in PBS at 4°C. All conjugates were characterized by UV/VIS absorption (Lambda 25 UV/VIS absorption spectrometer; Perkin-Elmer, Waltham, MA) and fluorescence emission spectroscopy (Cary Eclipse fluorescence spectrometer; Varian, Darmstadt, Germany). The degree of labeling was calculated from known extinction coefficients and measured optical density at 650 nm and 280 nm (absorption maximum of fluorophore and tryptophan, respectively) according to the Invitrogen labeling manual. We used extinction coefficients ɛ280nm as listed by Dam et al. (37): 15,700 cm(−1)mol(−1) (hGal-1); 17,700 cm(−1)mol(−1) (hGal-3); 8000 cm(−1)mol(−1) (hGal-3tr); 17,300 cm(−1)mol(−1) (hGal-4PT); and 23,000 cm(−1)mol(−1) (hGal-4). We assumed that extinction coefficients for hGal-8 and hGal-9 are similar to that of hGal-1 because the molecular masses and content of aromatic amino acids are comparable.
Fluorescence correlation spectroscopy
All FCS measurements were carried out on a home-built confocal microscope as described elsewhere (38,39). ALEXA647 was excited at 633 nm (200 μW measured at the back aperture of the objective) using a HeNe laser. Photobleaching was not detectable at the chosen excitation power. The collimated laser beam was coupled into an oil-immersion objective (63×, NA 1.4; Zeiss, Jena, Germany) by a dichroic beam splitter (645DLRP; Omega Optics, Brattleboro, VT). The fluorescence signal was collected by the same objective, filtered by a band-pass filter (700DF75; Omega Optics), separated into two beams using a cubic nonpolarizing beamsplitter (Linos, Göttingen, Germany) coupled into multimode optical fibers with a diameter of ∼100 μm, and imaged onto the active area of two single-photon avalanche photodiodes (AQR-14; PerkinElmer, Waltham, MA). The signals of the avalanche photodiodes were cross-correlated (5–15 min for each measurement) using a digital real-time multitau correlator device (ALV-6010; ALV-GmbH, Langen, Germany) with a time resolution down to 6.25 ns. Fluorescently modified galectin samples were diluted to a final concentration of ∼1 nM in PBS (pH 7.4) and 0.05% Tween-20 to suppress glass surface adsorption. Aliquots were transferred onto a microscope slide and covered by a coverslip. Sample temperature was controlled by a custom-built objective heater to be kept constant at 20°C. All measurements were carried out at a constant distance of 40 μm from the glass surface in the solution.
FCS data analysis
Fluctuations in the fluorescence signal I(t) due to diffusion of fluorescent galectins in and out of the detection volume were analyzed via the second-order autocorrelation function:
| (1) |
where 〈 〉 denotes the time average over the total observation time. Eq. 1 can be approximated using a two-dimensional diffusion model for a single species in combination with a stretched exponential decay accounting for photophysical processes:
| (2) |
with the number of detected molecules N, characteristic diffusion time τD, amplitude A, rate constant k, and stretch parameter β of a decay accounting for photophysical processes. The characteristic diffusion time τD depends on the dimensions of the detection focus ωxy in x,y-dimension and the diffusion constant D as
| (3) |
The two-dimensional model is valid for detection foci with ωxy << ωz (ωz representing the lateral dimension of the focus), and is of sufficient accuracy to analyze this data. For spherical particles the diffusion constant D can be expressed in terms of an effective hydrodynamic radius Rh according to the Stokes-Einstein relation:
| (4) |
where kBT is the thermal energy, and η is the solvent viscosity. The average recorded fluorescence signal 〈I(t)〉 divided by the apparent number of molecules N yields a measure of the relative brightness per molecule B:
| (5) |
Binding assay
Binding constants were determined from measured diffusion constants D(cL) as function of ligand concentration cL. All samples were mixed and incubated for 3 h at room temperature. Data curves D(cL) were fitted with a Hill model:
| (6) |
where DGal and DGalL are the diffusion constants of free galectin and of galectin-ligand complex, respectively, KD = cGalcL/cGalL is the dissociation constant, and n is a measure for the number of binding sites.
Results and Discussion
Translational diffusion of galectins
We studied translational diffusion through a confocal observation volume in aqueous solution at 20°C by FCS as a technically simple means to determine comparatively the shape parameters of human galectins. The fluorescence signal was generated by excitation of the fluorophore probe ALEXA647 that is covalently attached to solvent-exposed lysine residues. They are presented commonly on galectin surfaces as shown for hGal-1 (Fig. 2). The degree of labeling, i.e., the number of fluorophores attached to each protein, was calculated from the extinction coefficients of the galectins at 280 nm and the fluorophore at 650 nm. It was found to range between 0.7 and 1.0. Because the absorption spectra of a fluorescent galectin (Fig. 3 a) and of the free fluorophore were nearly identical when labeling was carried out with low fluorophore excess (∼2-fold) and short incubation times (∼1.5 h), this condition was strictly maintained in all presented FCS studies. When the incubation time was increased (>2 h) and a larger excess of fluorophore was used (>2-fold), the extinction at 610 nm increased yielding a pronounced shoulder (Fig. 2 a). Such spectral features indicate the formation of fluorophore dimers (40) and because the galectin concentration of <1 μM is too low for significant intermolecular aggregate formation, multiple labels on each protein are required. Theoretically, ≤12 lysine residues exposed on the surface of hGal-1 (41) (and multiple lysine residues on all other investigated galectins as well) might be reactive. Experimentally, the overall degree of labeling was found to never surpass 1.5 even when the protein was reacted with a fivefold excess of reactive fluorophore. These results suggest that not more than two ALEXA647 dyes can be attached to a single galectin molecule at the conditions used and imply that due to the symmetry in a homodimer only one lysine residue per galectin subunit is suited for label introduction. The labeled species thus consists mostly of galectin homodimers with exactly one fluorophore and a few proteins with two fluorophores. Furthermore, FCS data enable estimating the degree of labeling from the observed fluorescence brightness per molecule B (Eq. 5). Comparison with the brightness per molecule for the free fluorophore yields BGal/BALEXA647 = 1.3 ± 0.3 and confirms that on average a single fluorophore accounts for the observed fluorescence signal.
Figure 3.

Fluorescence labeling of hGal-1. (a) Absorption spectra of hGal-1 labeled with ALEXA647 with a DOL≈1 (black) and a DOL≈1.3 (gray) in comparison to that of the freely diffusing, hydrolyzed fluorophore ALEXA647 (light gray). The increase in extent of extinction at ∼610 nm (arrow) at increased DOL due to fluorophore dimerization is clearly visible. (b) Exemplary FCS data (black line) for ALEXA647-labeled hGal-1. The decay on the μs-timescale (left arrow) is due to fluorophore photophysics, whereas the ms-decay (right arrow) represents translational diffusion of the protein. The data is fitted according to Eq. 2 (gray line).
The obtained FCS data (Fig. 3 b) could be well fitted with a model function for two-dimensional diffusion of a single species. It includes an additional decay on the microsecond timescale that accounts for photophysical processes (Eq. 2). The fast μs-fluctuations due to photophysics were independent of the studied protein when used as variable parameters in the nonlinear fit routine. We determined average values for the stretched-exponential decay parameters (A = 0.88, k = 2 × 10⁶ s−1, b = 0.31) that were fixed throughout all further data analysis. Relative diffusion constants were then estimated from fitting the correlation curves and determined reproducibly over months with a relative accuracy of <2% (see Fig. S1 in the Supporting Material). Absolute diffusion constants were determined by calibration with the freely diffusing hydrolyzed fluorophore ATTO655, for which the diffusion constant of D25°C = (4.28 ± 0.02) × 10−6 cm2 s−1 is known (42). Having established the experimental set-up, we proceeded to determine the behavior of human galectins comparatively.
Toward this end, we systematically determined the translational diffusion constants in aqueous solution at 20°C. The protein concentration was kept constant at ∼1 nM in all FCS experiments to exclude any aggregate formation. Diffusion constants were found to be on the order of 10−6 cm2 s−1 (Table 1), thus suggesting an effective hydrodynamic radius on the order of 2 nm according to Eq. 4. This is in agreement with previous estimates for hGal-1 (15). Experimental values can be compared to diffusion constants estimated from sequence information of the homologous proteins or available crystal structures. When assuming the typical compact globular shape for these closely related proteins, diffusion constants should be inversely proportional to the hydrodynamic radius according to the Stokes-Einstein equation (Eq. 4). The hydrodynamic and gyration radius of spherical molecules scale in approximation with the cubic root of the molecular mass (43). The measured diffusion constants qualitatively reflect this relation by yielding a relative difference of ∼0.9 for hGal-1 (MhGal-1 = 29 kDa) and hGal-3tr (MhGal-3tr = 15 kDa = 0.5 × MhGal-1). For the other investigated galectins, with molecular masses within a range of ± 20% of that of hGal-1, there was no obvious relation between the diffusion constant and the cubic root of the molecular mass. Thus, these galectins did not appear to adopt a spherical shape. A certain deviation was expected, however, because the chimeric hGal-3 will not adopt a globular shape due to its collagenase-sensitive stalk region, as intimated by ionization patterns in mass spectrometry (32) (contrary to its proteolytically truncated variant). The obtained data for the tandem-repeat-type galectins will report on the influence of linker presence. In the first step of examining the data, their validity must be ascertained. In principle, the obtained data are consistent with the assumption that hGal-1 is present entirely as homodimer, and none of the chimeric or tandem-repeat type galectins aggregate significantly at nanomolar concentrations. This conclusion is in accord to sedimentation equilibrium data with the chicken tandem-repeat-type galectin (44). We next proceeded to calculate these parameters based on structural data to facilitate a comparison.
Table 1.
Diffusion constants of human galectins
| Type | M(kDa)∗ | Dexp(10−6 cm2 s−1)† | DexpGal+lactose(10−6 cm2 s−1)† | DHydro(10−6 cm2 s−1)‡ | KdLac(10−6 M)§ | n§ | |
|---|---|---|---|---|---|---|---|
| hGal-1 | PT | 29 | 1.05 ± 0.01 | 1.11 ± 0.01 | 0.83 (1gzw (41)) | 99 ± 4 | 1.09 ± 0.05 |
| hGal-3 | Ch | 29 | 0.93 ± 0.02 | NC | — | NA | NA |
| hGal-3tr | Ch | 15 | 1.20 ± 0.01 | NC | 1.01 (2nmo (55)) | NA | NA |
| hGal-4 | TR | 36 | 1.02 ± 0.01 | NC | — | NA | NA |
| hGal-4PT | PT-like | 32 | 0.92 ± 0.01 | 0.96 ± 0.01 | — | 1.1 ± 0.1 | 0.93 ± 0.07 |
| hGal-8 | TR | 36 | 1.15 ± 0.01 | NC | — | NA | NA |
| hGal-9 | TR | 36 | 1.10 ± 0.01 | NC | — | NA | NA |
Ch, chimeric; NA, not applicable; NC, no change; PT, prototype; PT-like, prototype-like (no linker); TR, tandem-repeat-type.
The fluorescent label ALEXA647 adds 1.25 kDa to the molecular mass. The molecular mass determined by MALDI and ESI mass spectroscopy as reported by Dam et al. (37) rounded to the nearest kDa.
Standard error of the mean.
PDB codes with corresponding references for crystal structures in parenthesis.
Errors represent uncertainties from the nonlinear fit routine as provided by Origin software.
A refined estimate for the diffusion constant and hydrodynamic radius can be attained by assuming a solution structure that is similar to available crystal structures. Using an algorithm (HYDROPRO) that computes hydrodynamic properties of macromolecules based on the atomic coordinates provided as PDB coordinates for a given molecular structure (45), we have processed the respective data sets to calculate translational diffusion constants of hGal-1 and -3tr (Table 1). The diffusion constant for hGal-1 was experimentally found to be (1.05 ± 0.01) × 10−6 cm2 s−1, evidently larger than estimated by HYDROPRO (0.83 × 10⁻⁶ cm2 s−1) and also as measured by dynamic light scattering for bovine Gal-1 (0.79 × 10⁻⁶ cm2 s−1) (15,19). For proteolytically truncated hGal-3tr with a molecular mass about half of that for hGal-1 we measured D = (1.20 ± 0.01) × 10−6 cm2 s−1 compared to the HYDROPRO estimate of 1.01 × 10⁻⁶ cm2 s−1. The relative difference in diffusion constants between hGal-1 and hGal-3tr measured to be ∼0.8 are well reflected by HYDROPRO estimates. In addition, we consistently find a ∼20% difference between simulated and experimentally observed diffusion constants. An independent control experiment using two-focus FCS confirms our experimental results within a few percent and excludes any systematic influences from the calibration of FCS data (46). Thus, the difference between experimental data and computations can be attributed to parameter settings used in HYDROPRO calculations. In fact, a source of a difference can originate from adjustable parameters that make certain predictions on the hydration layer (45). Having examined hGal-1 and -3tr as controls, we proceeded to study tandem-repeat-type proteins.
Anomalous scaling of diffusion constants with molecular mass for tandem-repeat-type galectins
It is an open question how the linker peptide connecting both domains of tandem-repeat-type galectins influences biomolecular properties including shape and conformational dynamics as well as cross-linking capacity. We have therefore taken two different approaches to study this aspect: 1), by engineering a variant without the linker to turn the tandem-repeat-type protein hGal-4 into the prototype-like form hGal-4PT; and 2), by studying three different tandem-repeat-type galectins independently. First, we determined translational diffusion constants of hGal-4 with and without linker. FCS measurements yielded diffusion constants of (0.92 ± 0.01) × 10−6 cm2 s−1 and (1.02 ± 0.01) × 10−6 cm2 s−1 for hGal-4PT and hGal-4, respectively. It is evident that absence of the linker has an influence on this parameter. Because no crystallographic data are available for the full-length hGal-4, experimental values can only be compared with relative estimates based on the molecular mass. The insertion of the linker peptide between the two CRDs increases the molecular mass by ∼13%. Contrary to the expectation increase in molecular mass did not reduce the diffusion constant. Of note, the measured diffusion constant even increases by 11%. These data suggest a significantly different and rather compact structure as compared to the linkerless variant. In other words, the linker has a marked bearing on the relative positioning of the two CRDs. Its presence seems to endow a tandem-repeat-type lectin with spatial properties different from the prototype design. When examining two further tandem-repeat-type proteins with hGal-8 and -9, they show a rather large diffusion constant of (1.15 ± 0.05) × 10−6 cm2 s−1 and (1.10 ± 0.05) × 10−6 cm2 s−1, respectively, in relation to their molecular mass of ∼36 kDa. Insertion of a connecting peptide thus seems to have counterintuitive consequences when simply considering molecular mass increase.
In general terms, these experiments document the feasibility to use this parameter as sensor for detecting changes in shape/orientation of β-sandwich domains connected by a linker peptide. To explore the sensitivity further, our results give direction to detailed analysis of the hydrodynamic properties in the presence of ligand. The application of SANS technology showed a significant decrease of the gyration radius for hGal-1 on ligand binding (15). We therefore next addressed the issue of whether the technically considerably less demanding FCS approach will be useful also with respect to studying lectin properties after ligand binding.
Diffusion constants for galectins increase on lactose binding
FCS measurements were first run with hGal-1 to ascertain whether the method is sufficiently sensitive for this purpose. Indeed, a significant change in diffusion constants for hGal-1 was detected on binding to lactose. As shown in Fig. 4, the diffusion constant for hGal-1 increases from (1.05 ± 0.01) × 10−6 cm2 s−1 to (1.11 ± 0.01) × 10−6 cm2 s−1 when binding lactose. Thus, FCS is sufficiently sensitive to detect the shape alteration caused by lactose binding. This observation, highlighted in Fig. 1, prompted us to proceed to testing the other galectins accordingly. A similar change of ∼5% was observed in the case of the engineered hGal-4PT ((0.92 ± 0.07) × 10−6 cm2 s−1 vs. (0.96 ± 0.07) × 10−6 cm2 s−1 when loaded with lactose, Fig. 5), whereas the natural form was not responsive in this respect. Likewise, parameters of hGal-8 and -9 did not change on ligand binding. Of note, the addition of sugar at millimolar concentrations changes the viscosity and the refractive index of an aqueous solution, with impact on the observed diffusion constants. To exclude invalid interpretations, we therefore have analyzed these effects by studying diffusion of the free fluorophore ALEXA647 in lactose solutions. Negligible variations of the observed diffusion constants up to lactose concentrations of ∼1 mM were measured (Fig. S2).
Figure 4.

Diffusion constant D for hGal-1 measured by FCS at various concentrations of lactose. The binding curve was fitted by a Hill function (Eq. 6) yielding results as listed in Table 1. (Top) Average brightness per molecule B for hGal-1 estimated from each corresponding FCS measurement. The straight line represents the average value of B over all measurements. All error bars represent SE of 0.5%.
Figure 5.

Diffusion constant D for (a) hGal-4PT, the engineered hGal-4 variant without linker, and (b) hGal-4 measured by FCS at various concentrations of lactose. The binding curve in the left graph was fitted by a Hill function (Eq. 6) yielding results as listed in Table 1. (Top) The corresponding brightness per molecule B. Straight lines represent the average value of B over all measurements. All error bars represent SE estimated from repeated measurements.
It would seem that, when binding lactose, the slight increase in total molecular mass is counteracted by a conformational change in two cases. Its occurrence results in an increased diffusion constant. Despite sharing the global fold protein reactivities differ. This observation is in full agreement with SANS estimates for the gyration radius of hGal-1 (Rg= (1.91 ± 0.01) nm vs. Rg= (1.82 ± 0.01) nm when loaded with lactose) (15). Equally important, it confirms that gyration radius and effective hydrodynamic radius (being inverse proportional to diffusion constant) behave in a similar way. A comparison with HYDROPRO estimates of diffusion constants from crystal structures of free and lactose-loaded hGal-1 (41), which do not show any increase, indicates that ligand-induced conformational changes in solution cannot be explained on the basis of the x-ray crystal structures of lactose-loaded hGal-1. Its occurrence enabled us to proceed to delineate quantitative data on ligand affinity.
We determined a complete binding curve from measured diffusion constants at various lactose concentrations, which was successfully fitted by a Hill curve (Eq. 6). The fit parameters yielded estimates for the dissociation constant Kd and number of binding sites n for the interaction between protein and ligand at 20°C (Table 1). We found Kd = (99 ± 4) × 10−6 M for hGal-1, in accord with previous data from isothermal titration calorimetry (Kd = (170 ± 60) × 10−6 M) (41) and similar to the binding observed between hGal-1 and LacNAc (Kd = (100 ± 7) × 10−6 M) (37). The binding constant for hGal-4PT and lactose with Kd = (1.1 ± 0.1) × 10−6 M was significantly smaller than the one seen for hGal-1 and also smaller than the one found for hGal-4 and LacNAc (Kd = (35 ± 3) × 10−6 M) (37). All n values were equal to one within the estimated errors (Table 1). As the binding curves clearly reflect a bimolecular binding process between galectin and ligand, we conclude that the observed conformational change occurs on binding to the first CRD. Because the structurally bivalent galectins hGal-1 and hGal-4PT are active as cross-linking modules, binding a second ligand may not induce any additional conformational change that is reflected in the diffusion constant. In this case, and assuming equal avidity at both CRDs, the measured binding constants might underestimate the true binding constant for the bimolecular binding between one lactose molecule and a single CRD by a factor of 2 (because both hGal-1 and hGal-4PT present two CRDs).
When moving on to other members of the galectin family, no changes of diffusion constants were observed when adding lactose up to a concentration of 1 mM (Table 1). It would seem that carbohydrate recognition does not necessarily induce a conformational change that results in significant changes of hydrodynamic properties within this protein family. In the case of hGal-3tr, rearrangements of backbone loops on ligand binding had been observed by NMR spectroscopy (47,48). Our data provide evidence that such structural differences are too small to be reflected in the hydrodynamic properties of the protein. Having measured affinity based on the ligand-induced shape change, we next investigate the kinetics of lactose binding to hGal-1 and hGal-4PT.
Kinetics for binding between galectin and lactose
Repeated FCS measurements in five-min intervals analyzing the diffusion time of hGal-1 in the presence of lactose at concentrations between 10 μM and 5 mM showed relaxation of the observed diffusion constant from the starting value of (1.05 ± 0.01) × 10−6 cm2 s−1, representing free hGal-1, toward that of the lactose-loaded hGal-1 complex of (1.11 ± 0.01) × 10−6 cm2 s−1 over a few minutes (Fig. 6). The observed kinetics can be described by an exponential curve with a characteristic rate constant krel that slightly varies with lactose concentration clac. The data for krel(clac) increases linearly on raising ligand concentration with a slope of (2.0 ± 0.6) s−1 M−1 and an off-set of (5.7 ± 0.2) × 10−4 s−1 for concentrations <100 μM (corresponding to the binding constant), reaching saturation at high ligand concentrations with ∼10−3 s−1 (Fig. 6).
Figure 6.
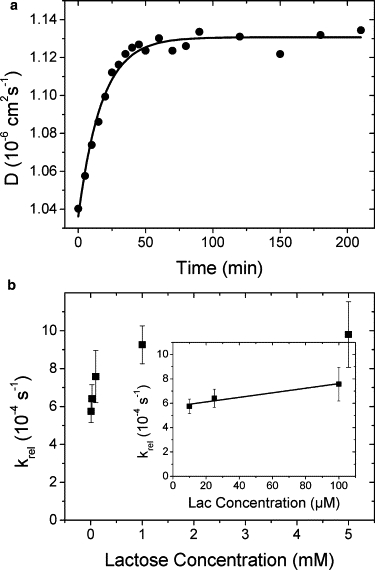
Kinetics of binding of lactose to hGal-1. (a) Diffusion constants D (circles) of hGal-1 in the presence of 5 mM lactose as function of time and fitted with an exponential rise function yielding a relaxation rate constant of (9.6 ± 0.7) × 10−4 s−1 (line). (b) Experimentally derived rate constants krel as function of lactose concentration clac (squares). Error bars represent uncertainties as estimated from the nonlinear fit routine in Origin software. (Inset) Experimentally derived rate constant krel for lactose concentrations clac < 100 μM fitted with a linear function (line) yielding an association rate constant (slope) of (2.0 ± 0.6) s−1 M−1 and a dissociation rate constant (offset) of (5.7 ± 0.2) × 10−4 s−1.
Assuming a pseudo-first-order binding process with association rate constant kas and dissociation rate constant kdis (this is justified by the fact that lactose is present at a much higher concentration than galectin: clac>10−5 M>>cgal≈10−9 M), the observed relaxation rate constant is krel = kasclac + kdis (49). From our measurements, we therefore estimate kas = (2.0 ± 0.6) s−1 M−1 and kdis = (5.7 ± 0.2) × 10−4 s−1 for lactose concentrations ∼100 μM. These values are in reasonable agreement with the measured dissociation constant of Kd = (0.99 ± 0.04) × 10−4 M, due to Kd = kdis/kas = (2.8 ± 0.9) × 10−4 M. An independent estimate of the characteristic rate constant for dissociation of lactose from bovine Gal-1 was measured previously by surface plasmon resonance (50). The study found kdis = (5 ± 2) × 10−4 s−1, in line with our results.
The association rate constant is influenced by intermolecular collisions driven by translational diffusion, orientational alignment through translational and rotational diffusion, and, possibly, conformational dynamics through an induced fit or conformational selection mechanism. Two proteins of spherical shape with a radius of ∼1.8 nm and uniformly distributed interaction sites would associate in a diffusion-limited way with a rate constant of ∼7 × 10⁹ M−1 s−1 (51). When the interfaces are required to align in a unique manner within 0.2 nm of the correct position by random encounters, the association rate constant would be ∼7 × 10² M−1 s−1 as shown by computer simulations (51). The fact that the observed association rate constant remains two to three orders of magnitude smaller suggests that adopting the correct binding alignment is more intricate than assumed in the above model system. The fact that the diffusion constant increases (and thus the hydrodynamic radius decreases) on lactose binding suggests that conformational changes or significant alterations of fast conformational dynamics occur on ligand binding. Structural compaction through binding would suggest an induced fit mechanism (52), whereas the freezing conformational dynamics hints at a binding mechanism by conformational selection (53). Either mechanism could slow down ligand binding and explain the observed association rates.
Similar kinetics were observed for hGal-4PT (Fig. S3). From measured data for krel(clac) with clac < 1 μM (approximately the dissociation constant) we determined an association rate constant kas = (1.7 ± 0.2) × 103 s−1 M−1 and a dissociation rate constant kdis = (12 ± 1) × 10−4 s−1. These values again are in reasonable agreement with the measured dissociation constant Kd = (1.1 ± 0.1) × 10−6 M, because Kd = kdis/kas = (0.71 ± 0.01) × 10−6 M. The data show that both rate constants are larger compared to those of hGal-1. The main deviation from the hGal-1 data set occurs in the association rate, with a disparity of three orders of magnitude. Thus, the difference in the dissociation constants between hGal-1 and hGal-4PT can be attributed mainly to the increased association rate constant. Apparently, the binding site in hGal-4PT is much more accessible for lactose, possibly due to different conformational dynamics in free hGal-4PT.
Conclusions
We have introduced FCS measurements of translational diffusion constants, and accordingly of the apparent hydrodynamic radii, for analyzing hydrodynamic behavior of human adhesion/growth-regulatory galectins. Members of each subgroup of structural display were tested including a truncated version of hGal-3 (hGal-3tr), and a linkerless hGal-4 variant (hGal-4PT).
Using hGal-1 and the chimera-type hGal-3 after proteolytic truncation as controls, translational diffusion constants were within 20% of those estimated by the computer algorithm HYDROPRO based on the PDB files of crystal structures from x-ray crystallography. A significant 13% difference in the diffusion constants between hGal-1 and full-length hGal-3, both with the same molecular mass, indicates clearly that a deviation from the globular-like shape exists for hGal-3, possibly due to stalk-like elongation by the collagenase-sensitive section. Our measurements shed light on impact of linker presence in tandem-repeat-type galectins. Presence of the linker led to anomalous scaling for tandem-repeat-type proteins, especially highlighted when comparing the physiological form of hGal-4 with the linkerless variant hGal-4PT. This result suggests some sort of compaction that is impossible without the linker, adding potential for a conformational flexibility to these proteins not acquired by a prototype design.
Confirming previous SANS measurements with hGal-1, we showed the high sensitivity of this approach to detect a conformational change on ligand binding. Moreover, we detected this response in the linkerless hGal-4 variant, whereas the other tested galectins were not responsive. Despite sequence homology these proteins, which can have distinct expression profiles in situ (54), react differently to ligand binding as summarized in Fig. 1. The observed decrease of hydrodynamic radii on ligand binding indicates structural rearrangement consistent with either an induced fit mechanism or a reduction of the conformational dynamics of the protein. This case study of galectin-4 underscores what we believe to be the relevance of the presence of the linker for structural aspects and also for ligand affinity.
Repeated FCS measurements over time showed binding kinetics for hGal-1 [hGal-4PT] and lactose with a dissociation rate constant of (5.7 ± 0.2) × 10−4 s−1 [(12 ± 1) × 10−4 s−1] and an association rate constant of (2.0 ± 0.6) M−1 s−1 [(1.7 ± 0.2) × 103 M−1 s−1], which is far below the diffusion-controlled collision rate constant. The difference in dissociation constants for hGal-1 and the prototype-like hGal-4 variant in binding lactose is associated mostly with a change in association rate constants.
Supporting Material
Three figures are available at http://www.biophysj.org/biophysj/supplemental/S0006-3495(10)00373-5. Figure S1: Reproducibility of FCS measurements and long-term stability of labeled galectin with respect to observed diffusion constant. Figure S2: Influence of lactose at various concentrations on the observed diffusion constants of a free dye. Figure S3: Kinetics of binding of lactose of hGal-4Pt.
Supporting Material
Acknowledgments
We thank J. Enderlein and A. Loman, Göttingen University, for help with a two-focus FCS measurement and fruitful discussion.
This work was supported by Deutsche Forschungsgemeinschaft.
Footnotes
Antonia Göhler's, Markus Sauer's, and Sören Doose's present address is Department of Biotechnology and Biophysics, Julius-Maximilians University, 97074 Würzburg, Germany.
References
- 1.Gabius H.-J., editor. The Sugar Code. Fundamentals of Glycosciences. Wiley-VCH; Weinheim: 2009. [Google Scholar]
- 2.Villalobo A., Nogales-González A., Gabius H.-J. A guide to signaling pathways connecting protein-glycan interaction with the emerging versatile effector functionality of mammalian lectins. Trends Glycosci. Glycotechnol. 2006;18:1–37. [Google Scholar]
- 3.Gabius H.-J. Glycans: bioactive signals decoded by lectins. Biochem. Soc. Trans. 2008;36:1491–1496. doi: 10.1042/BST0361491. [DOI] [PubMed] [Google Scholar]
- 4.Wu A.M., Wu J.H., Gabius H.-J. Effects of polyvalency of glycotopes and natural modifications of human blood group ABH/Lewis sugars at the Galβ1-terminated core saccharides on the binding of domain-I of recombinant tandem-repeat-type galectin-4 from rat gastrointestinal tract (G4-N) Biochimie. 2004;86:317–326. doi: 10.1016/j.biochi.2004.03.007. [DOI] [PubMed] [Google Scholar]
- 5.André S., Kožár T., Gabius H.-J. Substitutions in the N-glycan core as regulators of biorecognition: the case of core-fucose and bisecting GlcNAc moieties. Biochemistry. 2007;46:6984–6995. doi: 10.1021/bi7000467. [DOI] [PubMed] [Google Scholar]
- 6.Rappl G., Abken H., Reinhold U. CD4+CD7− leukemic T cells from patients with Sézary syndrome are protected from galectin-1-triggered T cell death. Leukemia. 2002;16:840–845. doi: 10.1038/sj.leu.2402438. [DOI] [PubMed] [Google Scholar]
- 7.André S., Kaltner H., Kopitz J. Determination of structural and functional overlap/divergence of five prototype galectins by analysis of the growth-regulatory interaction with ganglioside GM1 in silico and in vitro on human neuroblastoma cells. Int. J. Cancer. 2005;114:46–57. doi: 10.1002/ijc.20699. [DOI] [PubMed] [Google Scholar]
- 8.André S., Sanchez-Ruderisch H., Gabius H.-J. Tumor suppressor p16INK4a—modulator of glycomic profile and galectin-1 expression to increase susceptibility to carbohydrate-dependent induction of anoikis in pancreatic carcinoma cells. FEBS J. 2007;274:3233–3256. doi: 10.1111/j.1742-4658.2007.05851.x. [DOI] [PubMed] [Google Scholar]
- 9.Wang J.F., Lu Z.H., Wu G. Cross-linking of GM1 ganglioside by galectin-1 mediates regulatory T cell activity involving TRPC5 channel activation: possible role in suppressing experimental autoimmune encephalomyelitis. J. Immunol. 2009;182:4036–4045. doi: 10.4049/jimmunol.0802981. [DOI] [PubMed] [Google Scholar]
- 10.Sperandio M., Gleissner C.A., Ley K. Glycosylation in immune cell trafficking. Immunol. Rev. 2009;230:97–113. doi: 10.1111/j.1600-065X.2009.00795.x. [DOI] [PMC free article] [PubMed] [Google Scholar]
- 11.Gabius H.-J. Animal lectins. Eur. J. Biochem. 1997;243:543–576. doi: 10.1111/j.1432-1033.1997.t01-1-00543.x. [DOI] [PubMed] [Google Scholar]
- 12.Hughes, R. C. 2004. Galectins. Encyclopedia of Biological Chemistry 2:171–174.
- 13.Fred Brewer C. Binding and cross-linking properties of galectins. Biochim. Biophys. Acta. 2002;1572:255–262. doi: 10.1016/s0304-4165(02)00312-4. [DOI] [PubMed] [Google Scholar]
- 14.Ledeen R.W., Wu G. Neurobiology meets glycosciences. In: Gabius H.-J., editor. The Sugar Code. Fundamentals of Glycosciences. Wiley-VCH; Weinheim: 2009. pp. 495–516. [Google Scholar]
- 15.He L., André S., Gabius H.-J. Detection of ligand- and solvent-induced shape alterations of cell-growth-regulatory human lectin galectin-1 in solution by small angle neutron and x-ray scattering. Biophys. J. 2003;85:511–524. doi: 10.1016/S0006-3495(03)74496-8. [DOI] [PMC free article] [PubMed] [Google Scholar]
- 16.André S., Kaltner H., Gabius H.-J. Persubstituted cyclodextrin-based glycoclusters as inhibitors of protein-carbohydrate recognition using purified plant and mammalian lectins and wild-type and lectin-gene-transfected tumor cells as targets. Bioconjug. Chem. 2004;15:87–98. doi: 10.1021/bc0340666. [DOI] [PubMed] [Google Scholar]
- 17.Morris S., Ahmad N., Brewer C.F. Quaternary solution structures of galectins-1, -3, and -7. Glycobiology. 2004;14:293–300. doi: 10.1093/glycob/cwh029. [DOI] [PubMed] [Google Scholar]
- 18.Kaltner H., Solís D., Gabius H.-J. Prototype chicken galectins revisited: characterization of a third protein with distinctive hydrodynamic behavior and expression pattern in organs of adult animals. Biochem. J. 2008;409:591–599. doi: 10.1042/BJ20070419. [DOI] [PubMed] [Google Scholar]
- 19.He L., André S., Gabius H.-J. Small angle neutron scattering as sensitive tool to detect ligand-dependent shape changes in a plant lectin with β-trefoil folding and their dependence on the nature of the solvent. Glycoconj. J. 2009;26:111–116. doi: 10.1007/s10719-008-9164-2. [DOI] [PubMed] [Google Scholar]
- 20.Delacour D., Gouyer V., Huet G. Galectin-4 and sulfatides in apical membrane trafficking in enterocyte-like cells. J. Cell Biol. 2005;169:491–501. doi: 10.1083/jcb.200407073. [DOI] [PMC free article] [PubMed] [Google Scholar]
- 21.Morelle W., Stechly L., Huet G. Glycosylation pattern of brush border-associated glycoproteins in enterocyte-like cells: involvement of complex-type N-glycans in apical trafficking. Biol. Chem. 2009;390:529–544. doi: 10.1515/BC.2009.075. [DOI] [PubMed] [Google Scholar]
- 22.Kübler D., Hung C.W., Gabius H.-J. Phosphorylated human galectin-3: facile large-scale preparation of active lectin and detection of structural changes by CD spectroscopy. Biochim. Biophys. Acta. 2008;1780:716–722. doi: 10.1016/j.bbagen.2008.01.018. [DOI] [PubMed] [Google Scholar]
- 23.Magde D., Elson E.L., Webb W.W. Fluorescence correlation spectroscopy. II. An experimental realization. Biopolymers. 1974;13:29–61. doi: 10.1002/bip.1974.360130103. [DOI] [PubMed] [Google Scholar]
- 24.Rigler R., Elson E.S. Springer-Verlag; Berlin, Heidelberg, New York: 2001. Fluorescence Correlation Spectroscopy: Theory and Applications. [Google Scholar]
- 25.Frieden C., Chattopadhyay K., Elson E.L. What fluorescence correlation spectroscopy can tell us about unfolded proteins. Adv. Protein Chem. 2002;62:91–109. doi: 10.1016/s0065-3233(02)62006-6. [DOI] [PubMed] [Google Scholar]
- 26.Hess S.T., Huang S., Webb W.W. Biological and chemical applications of fluorescence correlation spectroscopy: a review. Biochemistry. 2002;41:697–705. doi: 10.1021/bi0118512. [DOI] [PubMed] [Google Scholar]
- 27.Krichevsky O., Bonnet G. Fluorescence correlation spectroscopy: the technique and its applications. Rep. Prog. Phys. 2002;65:251–297. [Google Scholar]
- 28.Haustein E., Schwille P. Fluorescence correlation spectroscopy: novel variations of an established technique. Annu. Rev. Biophys. Biomol. Struct. 2007;36:151–169. doi: 10.1146/annurev.biophys.36.040306.132612. [DOI] [PubMed] [Google Scholar]
- 29.Michalet X., Kapanidis A.N., Weiss S. The power and prospects of fluorescence microscopies and spectroscopies. Annu. Rev. Biophys. Biomol. Struct. 2003;32:161–182. doi: 10.1146/annurev.biophys.32.110601.142525. [DOI] [PubMed] [Google Scholar]
- 30.Kapanidis A.N., Weiss S. Fluorescent probes and bioconjugation chemistries for single-molecule fluorescence analysis of biomolecules. J. Chem. Phys. 2002;117:10953–10964. [Google Scholar]
- 31.Gabius H.-J. Influence of type of linkage and spacer on the interaction of β-galactoside-binding proteins with immobilized affinity ligands. Anal. Biochem. 1990;189:91–94. doi: 10.1016/0003-2697(90)90050-j. [DOI] [PubMed] [Google Scholar]
- 32.Kopitz J., André S., Gabius H.-J. Homodimeric galectin-7 (p53-induced gene 1) is a negative growth regulator for human neuroblastoma cells. Oncogene. 2003;22:6277–6288. doi: 10.1038/sj.onc.1206631. [DOI] [PubMed] [Google Scholar]
- 33.Purkrábková T., Smetana K., Gabius H.-J. New aspects of galectin functionality in nuclei of cultured bone marrow stromal and epidermal cells: biotinylated galectins as tool to detect specific binding sites. Biol. Cell. 2003;95:535–545. doi: 10.1016/j.biolcel.2003.08.002. [DOI] [PubMed] [Google Scholar]
- 34.André S., Pei Z.C., Gabius H.-J. Glycosyldisulfides from dynamic combinatorial libraries as O-glycoside mimetics for plant and endogenous lectins: their reactivities in solid-phase and cell assays and conformational analysis by molecular dynamics simulations. Bioorg. Med. Chem. 2006;14:6314–6326. doi: 10.1016/j.bmc.2006.05.045. [DOI] [PubMed] [Google Scholar]
- 35.Beer A., André S., Gabius H.-J. Human galectins as sensors for apoptosis/necrosis-associated surface changes of granulocytes and lymphocytes. Cytometry A. 2008;73A:139–147. doi: 10.1002/cyto.a.20510. [DOI] [PubMed] [Google Scholar]
- 36.André S., Sansone F., Ungaro R. Calix[n]arene-based glycoclusters: bioactivity of thiourea-linked galactose/lactose moieties as inhibitors of binding of medically relevant lectins to a glycoprotein and cell-surface glycoconjugates and selectivity among human adhesion/growth-regulatory galectins. ChemBioChem. 2008;9:1649–1661. doi: 10.1002/cbic.200800035. [DOI] [PubMed] [Google Scholar]
- 37.Dam T.K., Gabius H.-J., Brewer C.F. Galectins bind to the multivalent glycoprotein asialofetuin with enhanced affinities and a gradient of decreasing binding constants. Biochemistry. 2005;44:12564–12571. doi: 10.1021/bi051144z. [DOI] [PubMed] [Google Scholar]
- 38.Kim J., Doose S., Sauer M. The initial step of DNA hairpin folding: a kinetic analysis using fluorescence correlation spectroscopy. Nucleic Acids Res. 2006;34:2516–2527. doi: 10.1093/nar/gkl221. [DOI] [PMC free article] [PubMed] [Google Scholar]
- 39.Doose S., Barsch H., Sauer M. Polymer properties of polythymine as revealed by translational diffusion. Biophys. J. 2007;93:1224–1234. doi: 10.1529/biophysj.107.107342. [DOI] [PMC free article] [PubMed] [Google Scholar]
- 40.Scheibe G. Über die Veränderlichkeit der Absorptionsspektren in Lösungen und die Nebenvalenzen als ihre Ursache. Angew. Chem. 1937;50:212–219. [Google Scholar]
- 41.López-Lucendo M.F., Solís D., Romero A. Growth-regulatory human galectin-1: crystallographic characterization of the structural changes induced by single-site mutations and their impact on the thermodynamics of ligand binding. J. Mol. Biol. 2004;343:957–970. doi: 10.1016/j.jmb.2004.08.078. [DOI] [PubMed] [Google Scholar]
- 42.Dertinger T., Pacheco V., Enderlein J. Two-focus fluorescence correlation spectroscopy: a new tool for accurate and absolute diffusion measurements. ChemPhysChem. 2007;8:433–443. doi: 10.1002/cphc.200600638. [DOI] [PubMed] [Google Scholar]
- 43.De Gennes P.G. Cornell University Press; Ithaca, NY: 1979. Scaling Concepts in Polymer Physics. [Google Scholar]
- 44.Kaltner H., Solís D., Gabius H.-J. Unique chicken tandem-repeat-type galectin: implications of alternative splicing and a distinct expression profile compared to those of the three prototype proteins. Biochemistry. 2009;48:4403–4416. doi: 10.1021/bi900083q. [DOI] [PubMed] [Google Scholar]
- 45.García De La Torre J., Huertas M.L., Carrasco B. Calculation of hydrodynamic properties of globular proteins from their atomic-level structure. Biophys. J. 2000;78:719–730. doi: 10.1016/S0006-3495(00)76630-6. [DOI] [PMC free article] [PubMed] [Google Scholar]
- 46.Dertinger T., Loman A., Enderlein J. The optics and performance of dual-focus fluorescence correlation spectroscopy. Opt. Express. 2008;16:14353–14368. doi: 10.1364/oe.16.014353. [DOI] [PubMed] [Google Scholar]
- 47.Umemoto K., Leffler H., Prestegard J.H. Conformational differences in liganded and unliganded states of Galectin-3. Biochemistry. 2003;42:3688–3695. doi: 10.1021/bi026671m. [DOI] [PubMed] [Google Scholar]
- 48.Diehl C., Genheden S., Akke M. Conformational entropy changes upon lactose binding to the carbohydrate recognition domain of galectin-3. J. Biomol. NMR. 2009;45:157–169. doi: 10.1007/s10858-009-9356-5. [DOI] [PubMed] [Google Scholar]
- 49.Gutfreund H. Cambridge University Press; Cambridge, UK: 1995. Kinetics for the Life Sciences: Receptors, Transmitters and Catalysts. [Google Scholar]
- 50.Dettmann W., Grandbois M., Gaub H.E. Differences in zero-force and force-driven kinetics of ligand dissociation from β-galactoside-specific proteins (plant and animal lectins, immunoglobulin G) monitored by plasmon resonance and dynamic single molecule force microscopy. Arch. Biochem. Biophys. 2000;383:157–170. doi: 10.1006/abbi.2000.1993. [DOI] [PubMed] [Google Scholar]
- 51.Northrup S.H., Erickson H.P. Kinetics of protein-protein association explained by Brownian dynamics computer simulation. Proc. Natl. Acad. Sci. USA. 1992;89:3338–3342. doi: 10.1073/pnas.89.8.3338. [DOI] [PMC free article] [PubMed] [Google Scholar]
- 52.Koshland D.E. Application of a theory of enzyme specificity to protein synthesis. Proc. Natl. Acad. Sci. USA. 1958;44:98–104. doi: 10.1073/pnas.44.2.98. [DOI] [PMC free article] [PubMed] [Google Scholar]
- 53.Monod J., Wyman J., Changeux J.P. On nature of allosteric transitions—a plausible model. J. Mol. Biol. 1965;12:88–118. doi: 10.1016/s0022-2836(65)80285-6. [DOI] [PubMed] [Google Scholar]
- 54.Cada Z., Smetana K., Gabius H.-J. Immunohistochemical fingerprinting of the network of seven adhesion/growth-regulatory lectins in human skin and detection of distinct tumour-associated alterations. Folia Biol. (Praha). 2009;55:145–152. doi: 10.14712/fb2009055040145. [DOI] [PubMed] [Google Scholar]
- 55.Collins P.M., Kazuya A., Blancharda H. Slow diffusion of lactose out of galectin-3 crystals monitored by x-ray crystallography: possible implications for ligand-exchange protocols. Acta Crystallogr. D Biol. Crystallogr. 2007;63:415–419. doi: 10.1107/S090744490605270X. [DOI] [PubMed] [Google Scholar]
Associated Data
This section collects any data citations, data availability statements, or supplementary materials included in this article.