

Abstract
An image processing algorithm (AUTOROI) has been developed to totally automatically (or manually assisted) detect whole-kidney contours and generate renal regions of interest (ROI) for the extraction of the quantitative measurements used in the interpretation of Tc-99m-MAG3 renograms.
Methods
The 18-20th min dynamic frames post MAG3 injection were used to automatically define boxes surrounding each kidney which were then transposed to an early composite image for interpolative and directional background subtraction. Sobel operator and unsharp masking were applied for edge enhancement and resulting image histograms were equalized to better define poorly functioning kidneys. AUTOROI searched radially from the center of mass to define each kidney's ROI coordinates. AUTOROI was validated using MAG3 studies from 79 patients referred for suspected obstruction (79 L, 77 R kidneys) and 19 kidney donors with normal kidney function and no obstruction. Renal ROIs were manually defined by a nuclear medicine technologist with 20+ years of experience (reference standard) and an ABNM certified physician. AUTOROI and physician ROIs were automatically compared to the reference standard for determining border definition error.
Results
AUTOROI detected totally automatically the renal borders in 89% (172/194) of the kidneys from the entire group of 98 patients. The 22 kidneys missed automatically were subsequently detected by the assistance of a single manually placed fiducial point demarcating the liver/kidney boundary. These 22 kidneys were shown to be associated with markedly reduced MAG3 clearance. The mean error of AUTOROI for all 194 kidneys was 6.66 ± 3.77 mm and 7.31 ± 4.52 mm for the left and right kidneys respectively. The physician's error was 6.78 ± 2.42 mm and 6.65 ± 2.05 mm for the left and right kidneys respectively. This error difference between AUTOROI and the physician was not statistically significant.
Conclusion
AUTOROI provides an objective and promising approach to automated renal ROI detection.
Keywords: Automatic ROI definition, renal obstruction, Tc-99m renography
Introduction
Quantitative renogram parameters can assist in the diagnosis of obstruction and renovascular hypertension and can be useful in providing a methodology for comparing results between institutions. Over the past 5 years we have upgraded our original QuantEM™ software (1) to better extract quantitative MAG3 renogram parameters and have developed RENEX, an expert system used for assisting physicians in detecting renal obstruction using quantitative parameters extracted from pre and post furosemide Tc-99m MAG3 renal scans (2,3). We and others have observed that MAG3 images from patients with poorly functioning kidneys are often of reduced quality with poorly defined renal borders due to a high background activity, particularly in the liver, and a low kidney to background ratio. Because the right kidney is adjacent to and is often partially superimposed on the liver, reduced right kidney uptake combined with increased hepatic activity can make definition of the right kidney border more problematic (4). Consequently, manual kidney regions of interest (ROI) are likely to have increased intra and inter-observer variability; this problem is exacerbated when manual ROIs are defined by individuals with limited experience, a condition common in the United States where most MAG3 renal scans are performed in radiology practices that lack a board certified nuclear medicine physician or nuclear radiologist. Variability in ROI assignments could lead to changes in quantitative variables on sequential studies such as pre and post ACE inhibition studies which could be misinterpreted as clinically significant when, in fact, they simply reflect different ROIs. An automated ROI determination can reduce that source of error. In addition, an inappropriate kidney ROI may lead to misleading quantitative variables which could be misinterpreted by physicians with limited experience in interpreting renal scans. In addition, there is an increasing pressure to reduce medical costs which can be accomplished in a nuclear medicine department by procedures that save physician and/or technologist time. Automated processing of the renogram which requires robust software to define the renal ROI would reduce sources of error and minimize processing time.
Computer-derived kidney ROIs have been suggested as a more reproducible alternative to manual ROIs. These techniques have included factor analysis, cluster analysis, fuzzy logic, artificial neural networks and image registration (5-12). Factor analysis has been the most popular mathematical tool for separating dynamic renal structures and identifying the kidneys (5-10). A totally automatic method for defining renal ROIs using factor analysis has been limited by the inclusion of spurious non-physiological pixels outside the kidneys due to image noise which require operator intervention to eliminate and/or incorporation of prior information such as physiological constraints (10).
Semi-automated methods to define renal ROIs have also been developed and shown to significantly reduce operator variability in evaluating renal function in a small population (13). Nevertheless, using conventional techniques, a recent study showed that a semi-automated method failed to detect the renal borders in 30% of kidneys; the failures almost always occurred in kidneys with poor function (14).
Thus there is a general need for new software methods for the automated extraction of advanced quantitative features from MAG3 renograms of patients in order to increase the accuracy of the image interpretation procedure whether it is performed by human experts, knowledge based expert systems or statistical systems. Specifically, we needed to develop and well-characterize the performance of this algorithm to incorporate it into our comprehensive software renal quantification program (QuantEM II).
The goals of this current work are: 1) to develop a robust method to automatically detect renal borders from MAG3 dynamic studies without any operator intervention, 2) to implement a simple fail-safe option which uses manual definition of a single pixel fiducial identification to detect borders in kidneys that fail to be detected automatically, 3) to use these methods to generate more accurate and reproducible renal regions of interest (ROIs), and 4) to evaluate this algorithm (AUTOROI) to automatically detect kidney contours and generate renal ROIs in a large population of 98 subjects with and without suspected renal obstruction.
Materials and Methods
Patient population
Two groups of patients were used to test AUTOROI. Group A consisted of 79 patients (45 males) referred for suspected renal obstruction with a mean age of 58.1 ± 16.5 yrs. Seventy nine of these patients had left kidneys (MAG3 clearance = 116.9 ±80 mL/min/1.73m2) and 77 right kidneys (MAG3 clearance = 99.6 ±71 mL/min/1.73m2). To test whether there were performance differences for AUTOROI between patients with suspected renal obstruction and patients with normal kidneys, an additional group of 19 subjects (Group B) were sequentially selected from a database of 100 potential renal donors whose studies were also interpreted as having two normal kidneys with no obstruction and normal kidney function (172 ± 43 mL/min/1.73m2 left and 171.5 ±38 mL/min/1.73m2 right kidneys MAG3 clearance)(15). The group consisted of 12 females and 7 males with a mean age of 40.4 ± 11.2 yrs. All studies used for this development were obtained from the renal database of patients referred to our nuclear medicine service to evaluate suspected renal obstruction. This study was performed under the purview and approval of Emory's Institutional Review Board.
Acquisition Protocol
Patients were positioned supine, with the scintillation camera detector placed under the table. A three-phase dynamic acquisition (baseline scan) was begun as a single dose of 10 mCi (370 MBq) of Tc-99m MAG3 was injected; phase one consisted of 24 2-second frames, phase two was 16 15-second frames, and phase three was 40 30-second frames. For all the patients in the study, review of the baseline scan could not exclude obstruction and all patients in the study received an intravenous injection of 40 mg of furosemide followed immediately by a second single-phase 20 min dynamic acquisition consisting of 40 30-second frames. Thus, the three-phase dynamic acquisition followed by a second single-phase 20 min dynamic acquisition were acquired from the one initial Tc-99m MAG3 injected dose. Only the three-phase dynamic acquisition (baseline scan) was utilized for this AUTOROI study. In our institution, the baseline scan can exclude obstruction in approximately one third of patients; of note, the patients in this study had more problematic baseline scans evidenced by the need for furosemide to further evaluate obstruction.
Automatic ROI definition
Automatic definition of the kidney borders for generating left and right kidney ROIs consisted of five standard image processing steps. These steps are illustrated in a patient with normal kidneys in Figure 1 and in a patient with an obstructed left kidney in Figure 2. The general design of the algorithm is to use count profiles from a composite of late images in the MAG3 study with reduced liver and spleen counts to isolate the general location of the kidneys and to place a box around each kidney. These boxes are transposed to an early (2 min) image composite to perform interpolative background subtraction to reduce count cross-talk from other structures and increase image contrast. A Sobel edge detection operator followed by an unsharp masking operator is then applied to this high contrast kidney image to generate an image consisting of thick kidney borders (i.e. the kidneys disappear and are replaced by their borders) which are then extracted using a maximal count profile search. Specifically this algorithm works according to the following steps:
Figure 1.
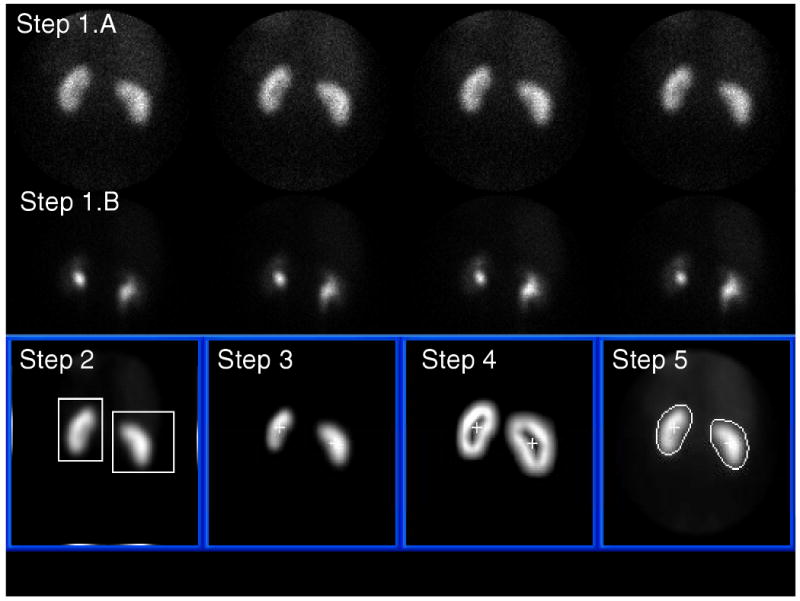
Automatic kidney ROI definition from a MAG3 study in a normal patient. Steps 1 through 5 refer to the image processing steps described in the methods section. See kidney borders compared to reference standard and to physician border definition in Figure 4.
Figure 2.
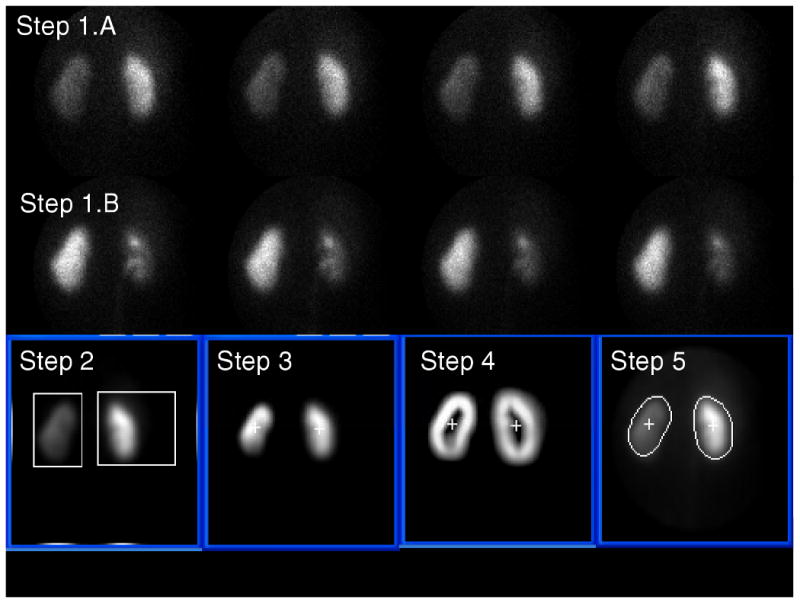
Automatic kidney ROI definition from a MAG3 study in a patient with an obstructed left kidney. Steps 1 through 5 refer to the image processing steps described in the methods section. See kidney borders compared to reference standard and to physician border definition in Figure 5.
In Step 1.A four 15 second dynamic frames representing the concentration of MAG3 between the 2nd and 3rd minute post injection are summed to form an early composite image of the renal parenchyma for border detection.
In Step 1.B four 30-second dynamic frames representing the concentration of MAG3 between the 18th and 20th minute post injection are summed to form a late composite image when hepatic and splenic background has decreased and the boundary between the right kidney and liver and the boundary between the left kidney and spleen can be better discriminated. This late composite image is used just to isolate where the kidneys are generally located, actual border detection is performed on the early composite images. In Step 2 the composite image from Step 1.B is, a) smoothed using a 5-point box operator to reduce image noise, b) the count profiles are summed vertically, and the result divided equally at the midpoint into two profiles c) two additional count profiles are summed horizontally from the center to the left for the left kidney and from the center to the right for the right kidney, d) and each of these four count profiles are searched from their maximum count to the two ends using both a threshold and first derivative test to help identify coordinate limits for two boxes surrounding each kidney.
In Step 3 coordinates of each box from Step 2 are used on the early composite image obtained from Step 1.A to perform interpolative background subtraction based on the count distribution outside the box defined by the coordinates (16,17) to help remove background and increase image contrast. The pixel counts outside each box are set to zero. An additional wedge background subtraction algorithm was implemented which subtracted a 45° background count directional wedge oriented left (higher counts) to right (lower counts) for the left kidney and right to left for the right kidney. The subtraction of this wedge background was necessitated because occasionally the top-right corner of the box used for interpolative background subtraction of the right kidney was automatically defined outside the camera's circular field of view where there were no counts, thus creating an under-subtraction of the liver background. The same was seen for the left kidney but less frequently.
Once the background counts are subtracted the image inside each box is histogram equalized (18) and the least intense kidney image normalized to the most intense image to bring out details in poor functioning kidneys. The center of mass of the counts from each box is used to identify an inner point inside each kidney. In Step 4 the edges of each kidney are enhanced using first a Sobel operator (18,19) applied to the images from each box in Step 3 followed by unsharp masking by subtracting the unenhanced image (16). The result is again histogram-equalized and 5-point smoothed to obtain kidney images of similar intensity with thick borders surrounding each kidney. In Step 5 the coordinates of a radial profile are detected for each kidney border-enhanced image from Step 4 by the computer searching radially from the previously identified inner point in each kidney using a threshold + first derivative test. This search usually identifies the central point across the thick border surrounding the kidney. The radius defined by this pixel was lengthened by an additional three pixels (9.6 mm) to include kidney scatter which coincided with experts' perception of accurate kidney ROIs during development. This search is performed for 40 samples every 9° to identify the borders of each kidney. The resultant radial profile is radially smoothed also performing a continuity test to assure that all border points are connected. These profiles define the coordinates of each kidney's ROI.
Steps 1-5 described above are totally automatic. For the cases where this automation failed to detect the kidney borders the user had the option to identify a single pixel as a fiducial seed point to define the top right corner of the right box to be used for background subtraction. Ideally this fiducial point was located along the most superior aspects of the kidneys and between the liver and right kidney. This single fiducial point placement was designed to assist in the border definition of both right and left kidneys since it changed the superior aspects of the background subtraction boxes closer to each kidney for improved correction and thus improved border definition. Failed automatic processing was identified when a kidney ROI was detected with more pixels outside the kidney than inside the kidney.
Reduced counts (dose) studies
In order to test the robustness of the AUTOROI algorithm in lower count studies that would mimic lower dose studies all the patients in group A and B were reprocessed using image composites with half the original counts by summing only half of the original frames used for processing. Thus for the early composite image used for border detection only two 15 sec frames were added together representing the concentration of MAG3 between 2 and 2.5 min post injection and for the late composite image used for isolating the kidneys two 30 sec frames were added representing the MAG3 concentration during the 18th minute. Except for using half the number of frames in the image composites, these reduced counts studies underwent the exact image processing as described above for automated kidney ROI detection of groups A and B and their results are labeled as groups A′ and B′.
Reference Standard Comparison
As a reference standard for determining the accuracy of automatically defining the renal ROIs, we used manually defined borders by a nuclear medicine technologist (RF) with 20+ years experience in drawing renal ROIs to generate renogram curves. To assess how the accuracy of ROI definition by AUTOROI compared to that of physicians, renal ROIs were also manually defined by an ABNM certified physician (SP).
AUTOROI and physician ROIs were automatically compared to the reference standard for each of the 40 angular samples using a common origin. Error was defined as the average difference in Euclidian distances (ordinary distance) between the renal border defined by the reference standard and that of AUTOROI and the physician, respectively, as shown in Figure 3; for purposes of illustration, an elliptical ROI is displayed as the reference standard. A two-tailed, paired Student t-test statistics was used between the AUTOROI radial error and physician's radial error to determine the p value. A two-tailed independent t-test with unequal variances was used to compare the mean kidney border radial error between the normal and obstructed groups and also the mean MAG3 clearance between groups. A p< .05 level was considered statistically significant.
Figure 3.
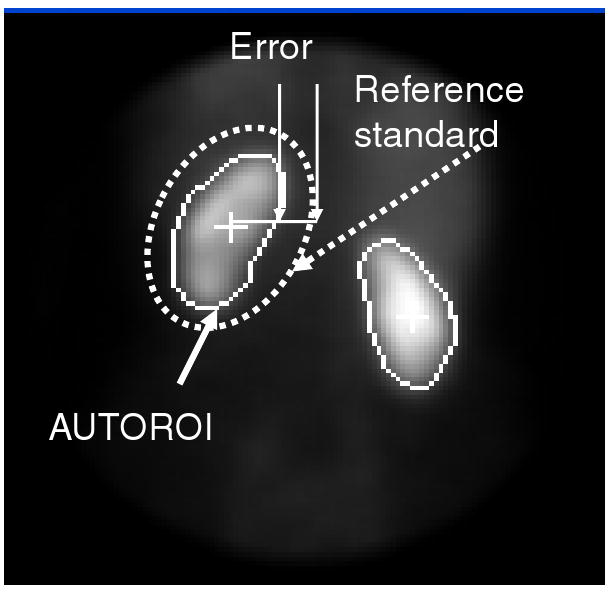
Error measurement between the borders automatically determined by AUTOROI and those manually assigned by the expert that served as the reference standard for each of 40 angular samples. The border defined by the reference standard is depicted in this figure as a dotted ellipse just for ease of display and explanation purposes.
Results
AUTOROI detected automatically the renal borders in 89% (172/194) of the kidneys from the entire group of 98 patients without any operator intervention. AUTOROI detected the kidney contours of the remaining 22 (15 right, 7 left) kidneys missed automatically using the assistance of the single manually placed fiducial point demarcating the liver/kidney boundary. This manually placed single fiducial point facilitated the border definition of all 15 right and 7 left kidneys missed by the totally automatic procedure. AUTOROI's mean radial error for detecting the renal borders from the entire group of 98 patients was 6.66 ± 3.77 mm and 7.31 ± 4.52 mm for the left and right kidneys respectively compared to the physician's mean radial error of 6.78 ± 2.42 mm and 6.65 ± 2.05 mm for the left and right kidneys respectively. The error difference between AUTOROI and the physician was not statistically significant. Compared to the normal kidney group, the group with suspected renal obstruction exhibited a MAG3 clearance that was statistically significantly lower both for the left (p = .002) and right (p<.001) kidneys. We further analyzed the data by separating the renal donor group from the group with suspected obstruction.
Group with Normal Kidneys
AUTOROI detected renal borders in all 38 kidneys of the 19 potential renal donors. The mean error for AUTOROI was 4.91±1.96 mm and 5.23±2.8 mm for the left and right kidneys, respectively, whereas the mean error for the physician was 6.24±1.87 and 6.48±1.48 for the left and right kidneys (Table 2). Compared to the physician, AUTOROI's error was significantly lower error (p = .02) for detecting the left kidney border with a trend towards a lower error (p = .08) for detecting the right kidney borders. An example comparing the defined borders by AUTOROI, the reference standard and the physician for the normal patient illustrated in Figure 1 are shown in Figure 4.
Table 2.
Mean Radial Error Kidney Border Definition for the Non-obstructed Group (n = 19)
| ˆ p < .05 | Left Kidney Mean error± SD (mm) | Right Kidney Mean error± SD (mm) |
|---|---|---|
| AUTOROI | 4.91ˆ ± 1.96 | 5.23 ± 2.8 |
| Physician | 6.24ˆ ± 1.87 | 6.48 ± 1.48 |
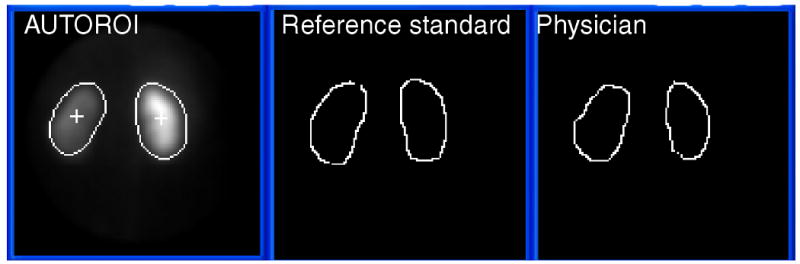
Figure 4.
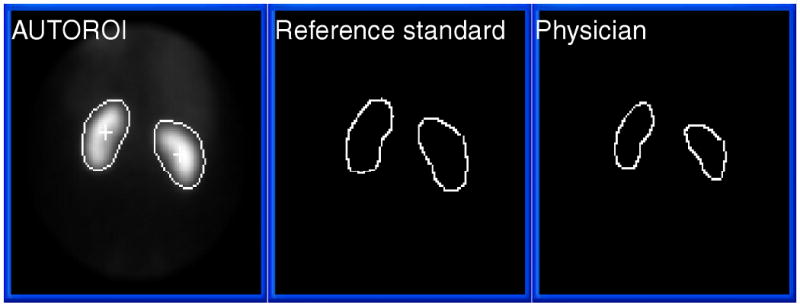
Automatic kidney ROI definition from a MAG3 study in a normal patient (from Figure 1) compared to the human expert used as a reference standard and to physician's border definition. For this study, the mean radial error for AUTOROI compared to the reference standard in this patient was 4.3 mm and 4.7 mm for the left and right kidney respectively. The mean radial error for the physician compared to the reference standard in this patient was 5.7 mm and 5.1 mm for the left and right kidney respectively.
Group with Suspected Renal Obstruction
AUTOROI automatically detected the renal borders in 134/156 kidneys (86%) from patients with suspected obstruction without any operator intervention; the remaining 22 kidneys (15 right kidneys) were detected with the manual-assistance of identifying a fiducial point. The mean MAG3 clearances of the 15 right kidneys not detected totally automatically was 27.7±20.5 (range 6-85) mL/min/1.73m2 which was markedly below the normal range (113-220 mL/min/1.73m2) determined in a prior study (15). The mean MAG3 clearances of the 7 left kidneys not detected totally automatically was similarly markedly reduced at 23.4±12.6 (range 9-46) mL/min/1.73m2. These quantitative data document the visual impression of reduced MAG3 accumulation in kidneys where AUTOROI fails to detect the kidney borders automatically.
In this suspected obstruction group the mean error of AUTOROI was 7.08±3.98 mm and 7.83±4.73 mm for the left and right kidneys, respectively (Table 3) compared to the physician's mean radial error for the left and right kidney borders of 6.91±2.53 mm and 6.69±2.17 mm, respectively. AUTOROI exhibited no statistical difference compared to the physician for detecting the left kidney border (p =.71) but there was a trend towards a higher error (p = .05) for detecting the right kidney border. An example comparing the defined borders by AUTOROI, the reference standard and the physician for the patient with an obstructed left kidney illustrated in Figure 2 are shown in Figure 5. Figure 6 illustrates an example of increased error of border definition of a right kidney with poor kidney function and obstruction. Figure 6 also shows how the manually placed fiducial point improves border definition in this patient's right kidney.
Table 3.
Mean Radial Error Kidney Border Definition for the Obstructed Group (n = 79)
| ˆ p < .05 | Left Kidney Mean error± SD (mm) | Right Kidney Mean error± SD (mm) |
|---|---|---|
| AUTOROI | 7.08 ± 3.98 | 7.83 ± 4.73 |
| Physician | 6.91 ± 2.53 | 6.69 ± 2.17 |
Figure 5.
Automatic kidney ROI definition from a MAG3 study in a patient with obstructed left kidney compared to the human expert used as a reference standard and to physician's border definition. For this study, the mean radial error for AUTOROI compared to the reference standard in this patient was 3.8 mm and 6.7 mm for the left and right kidney respectively. The mean radial error for the physician compared to the reference standard in this patient was 6.2 mm and 6.5 mm for the left and right kidney respectively.
Figure 6.
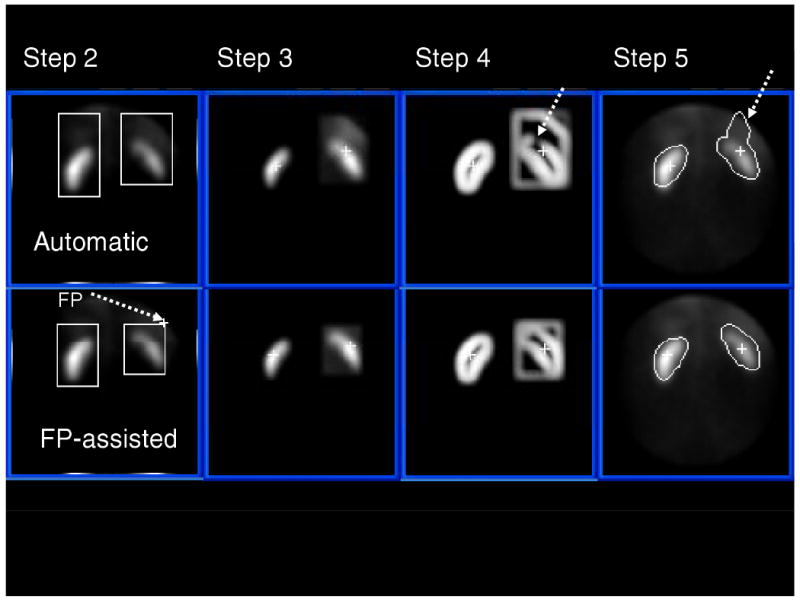
Comparison of Totally Automatic to Fiducial Point (FP) manually assisted kidney ROI definition from a MAG3 study in a patient with an obstructed right kidney in close proximity and uptake to the liver. Steps 2 through 5 refer to the image processing steps described in the methods section. The top row is an example of a study where the totally automatic algorithm missed detecting part of the right, upper cortex due to the loss of border definition as indicated by the dotted arrow on Step 4. Note also on the bottom row how the border definition of the right kidney is improved by the use of a single manually placed FP. This patient's right kidney exhibited a markedly low MAG3 clearance of 58 mL/min/1.73m2.
Compared to the results of the normal group, AUTOROI exhibited a significantly higher error for detecting both the left (p=.001) and right (p=.003) kidney borders in the group with suspected obstruction whereas there was no statistically significant difference in the physician's error for either the left (p=.20) or right (p=.63) kidneys. This increased error by AUTOROI in the suspected obstruction group coupled with AUTOROI's increased failure rate in detecting the border in kidneys with very low MAG3 clearance demonstrates the relationship between the algorithm's accuracy, robustness and kidney function.
Results in reduced counts (dose) studies
In the group of studies with half the original counts AUTOROI detected renal borders in all 38 kidneys of the 19 potential renal donors (group B′). The mean error for AUTOROI was 4.9 ± 2.31 mm and 4.79 ± 1.4 mm for the left and right kidneys, respectively. There was no statistical difference in the error in detecting the kidney border between this half counts study and the original study for either the left (p=.96) or right kidneys (p = .53). In the A′ group of patients with suspected renal obstruction AUTOROI detected the renal borders totally automatically in 132/156 kidneys. In this A′ group, the mean error for AUTOROI was 7.03 ± 4 mm and 6.93 ± 4.05 mm for the left and right kidney borders respectively. For this A′ group there was also no statistically significant difference in the error in detecting the kidney border between the half counts studies and the original studies for either the left (p=.64) or right kidneys (p = .98).
Discussion
In this study we designed, implemented, validated and characterized an image processing algorithm (AUTOROI) to totally automatically detect kidney contours and generate renal ROIs for the extraction of the quantitative measurements used in the interpretation of Tc-99m-MAG3 renograms. Clearly it is less difficult to design software to detect the renal borders in normal subjects. AUTOROI was specifically designed to detect the renal contours from the poor quality images of kidneys with a moderate to marked reduction in function. AUTOROI automatically detected the renal borders in 172/194 kidneys from the entire group of 98 patients and detected the renal borders in the remaining 22 with a single manually-assisted fiducial point. These 22 kidneys were shown to be associated with markedly reduced MAG3 clearance resulting in incorrect automatic placement of the boxes used for background subtraction.
The accuracy of AUTOROI was determined by comparing the coordinates of its detected borders vs. those manually assigned by an expert with 20 years of experience. There was no significant difference in the accuracy of AUTOROI compared to that of a board certified nuclear medicine physician for all left and right kidneys in all 98 patients. When these results were subdivided into the normal and suspected obstruction groups, AUTOROI automatically detected all kidney borders in the normal group with a significantly lower error for detecting the left kidney border and a trend towards a lower error for detecting the right kidney borders than the board certified nuclear medicine physician whereas in the suspected obstruction group, AUTOROI exhibited no statistical difference compared to the physician for detecting the left kidney border but a trend towards a higher error for detecting the right kidney border.
We also simulated a lower-count rate study with one half the original doses by only adding one half of the frames used for each portion of the processing. This generated data for the same non-obstructed and obstructed patients with new low-count (dose) studies. We reprocessed totally automatically all these low-count studies in all these patients and compared them to the manually defined ROIs by the expert used for the reference standard. The results in terms of number of kidneys detected automatically and significance of error between AUTOROI and physician were very similar to those with the high count studies. This confirms the robustness of the algorithm in lower dose studies. In some European countries were the injected MAG3 dose is even lower than the half dose simulated, the algorithm could easily be modified to include more dynamic frames in the image composites and thus generate composites with similar count densities as those evaluated here.
This overall evaluation has shown that AUTOROI is both robust and accurate in the large majority of patients. Nevertheless, when this algorithm is implemented clinically, care should be taken to ascertain how well the detected borders coincide with the kidney boundaries, particularly in patients with a marked reduction in renal function of either or both kidneys. The algorithm usually either detected the borders accurately or significantly failed generating a kidney ROI with more pixels outside the kidney than inside. This is because when AUTOROI failed it failed mainly due to not isolating the kidney's correctly (i.e. in poor functioning kidneys identifying another structure as the kidney) rather than not detecting the borders correctly once the kidney was properly isolated.
Previously, a semi-automated threshold ROI method was implemented and evaluated in 21 patients (13). Although the system was shown to estimate renal function with high accuracy, it differed from our approach in that the method required three manually placed ROIs, two over the kidneys and one over the liver and it was only evaluated in a small group of patients. In another investigation, two fully automatic methods for detecting kidney ROIs were evaluated using MAG3 studies from 17 patients, one method using image registration to a template or reference image and another using an artificial neural network (9). Similar to our approach, their ROIs were compared to reproducibility of the manually drawn ROIs. Different from our results, these investigators concluded that neither of these two methods was as reliable as the manually drawn ROIs (9). Factor analysis was used in another study to generate fuzzy ROIs to define the kidneys and was tested in 40 dynamic renal studies (8). In contrast to our totally automatic method, their approach necessitated a user-defined mask which constrained both the spatial and temporal domain where the fuzzy kidney region would be defined. These investigators found that the whole-kidney transit times calculated from their generated fuzzy ROIs demonstrated a substantially greater mean and standard deviation compared to the standard manual approaches. They also found that factor analysis was sensitive to patient motion.
Study limitations
One limitation of our algorithm is that it necessitated the manual assignment of a seed point at the top right corner of the right box used for background subtraction in 22/194 (11%) kidneys to achieve acceptable robustness. Another limitation of the study is that the effect of patient motion on border detection, a known problem when performing factor analysis, was not investigated. All studies were carefully quality controlled for patient motion but automatic detection and correction for kidney misalignment due to patient motion remains a parallel topic of investigation for our laboratory (20). We also did not investigate the effect of the error associated with automatic defining the whole-kidney ROIs on the subsequent generation of quantitative parameters from the renogram curve. These are all topics of our future research.
Another limitation of this investigation is that all MAG3 clearances reported here were extracted using manually drawn ROI's as part of the present QuantEM II processing and not with the described AUTOROI algorithm. This is because this integration of AUTOROI into QuantEM II requires significant development and this task was pending the present validation.
Finally, a limitation of the validation procedure is the use of a human as a reference-standard, particularly when we are comparing the algorithm's accuracy vs. a second human. The two human readers tended to see similar borders for the poorly functioning kidneys but this observation does not mean that these borders were optimal for assigning the ROI. There is no truly objective reference standard in a patient and a detailed answer to this challenging perception problem would require careful and detailed phantom studies which is beyond the scope of this investigation.
Conclusions
AUTOROI provides a robust, objective and accurate approach to automated renal ROI detection for the extraction of advanced quantitative features from MAG3 renograms of patients with suspected renal obstruction. This ROI definition approach will facilitate processing of renal scans; moreover, it promises to increase the accuracy and reliability of quantitative variables generated from the ROI and thereby enhances the accuracy of scan interpretation by physicians and by knowledge based or statistical expert systems. When implemented clinically, care should be taken to quality control how well the detected borders coincide with the kidney boundaries, particularly in patients with poorly functioning kidneys or in patients with a marked reduction in global renal function.
Table 1.
Mean Radial Error Kidney Border Definition for all 98 patients
| ˆ p < .05 | Left Kidney Mean error± SD (mm) | Right Kidney Mean error± SD (mm) |
|---|---|---|
| AUTOROI | 6.66 ± 3.77 | 7.31 ± 4.52 |
| Physician | 6.78 ± 2.42 | 6.65 ± 2.05 |
Acknowledgments
This work was supported by National Institute of Biomedical Imaging and Bioengineering, NIBIB and NIDDK, R01- EB008838. Some of the authors (EF, RF, AT) receive royalties from the sale of the application software QuantEM™ related to the research described in this article. The terms of this arrangement have been reviewed and approved by Emory University in accordance with its conflict-of-interest practice.
This work was supported by National Institute of Biomedical Imaging and Bioengineering, NIBIB and NIDDK, R01- EB008838 from the National Institute of Health.
References
- 1.Taylor A, Jr, Corrigan PL, Galt J, et al. Measuring technetium-99m-MAG3 clearance with an improved camera-based method. J Nucl Med. 1995;36:1689–1695. [PubMed] [Google Scholar]
- 2.Garcia EV, Taylor A, Halkar R, Folks R, Krishnan M, Dubovsky E. RENEX: An Expert System for the Interpretation of 99mTc-MAG3 Scans to Detect Renal Obstruction. J Nucl Med. 2006;47:320–329. [PubMed] [Google Scholar]
- 3.Taylor A, Hill A, Binongo J, Manatunga A, Halkar R, Dubovsky EV, Garcia EV. Evaluation of two diuresis renography decision support systems designed to determine the need for furosemide in patients with suspected obstruction. AJR. 2007;188:1395–1402. doi: 10.2214/AJR.06.0931. [DOI] [PMC free article] [PubMed] [Google Scholar]
- 4.White D, Houston A, Sampson W, Wilkins GP. Intra- and interoperator variations in region-of-interest drawing and their effect on the measurement of glomerular filtration rates. Clinical Nuclear Medicine. 1999;3:24. 177–181. doi: 10.1097/00003072-199903000-00008. [DOI] [PubMed] [Google Scholar]
- 5.Pavel DG, Orellana P, Olea E. Factor analysis of Tc-DTPA and I-hippuran radionuclide renal studies in nephro-urology. Eur J Nucl Med. 1989;15:514. [Google Scholar]
- 6.MacLeod MA, Houston AS. Factor analysis of dynamic structures in the diagnosis of renal disease. Eur J Nucl Med. 1989;15:601–604. doi: 10.1007/BF00256937. [DOI] [PubMed] [Google Scholar]
- 7.Russell DC, Yester MV, Dubovsky EV. Measurement of renal parenchymal transit time of Tc-99m MAG3 using factor analysis. Nuklearmedizin. 1990;29:170–176. [PubMed] [Google Scholar]
- 8.Samal M, Nimmon CC, Britton KE, Bergmann H. Relative renal uptake and transit time measruement using functional factor images and fuzzy regions of interest. Eur J Nucl Med. 1998;25:48–54. doi: 10.1007/s002590050193. [DOI] [PubMed] [Google Scholar]
- 9.Houston AS, White DRR, Sampson WFD, Macleod MA, Pilkington JB. An assessment of two methods for generating automatic regions of interest. Nucl Med Commun. 1998;19:1005–1016. doi: 10.1097/00006231-199810000-00011. [DOI] [PubMed] [Google Scholar]
- 10.Bergmann H, Dworak E, Konig B, Mostlbeck A, Samal M. Improved automatic separation of renal parenchyma and pelvis in dynamic renal scintigraphy using fuzzy regions of interest. Eur J Nucl Med. 1999;26:837–843. doi: 10.1007/s002590050457. [DOI] [PubMed] [Google Scholar]
- 11.Hannequin P, Liehn JC, Valeyre J. Cluster analysis for automatic image segmentation in dynamic scintigraphies. Nucl Med Commun. 1990;11:383. doi: 10.1097/00006231-199005000-00006. [DOI] [PubMed] [Google Scholar]
- 12.Barber DC. Automatic generation of regions of interest for radionuclide renograms. Proceedings of medical image understanding and analysis, Sheffield. 2003 [Google Scholar]
- 13.Inoue Y, Yoshikawa K, Yoshioka N, Watanabe T, Saigua S, Kaneko Y, Yokoyama I, Ohtomo K. Evaluation of renal function with 99m-Tc-MAG3 using semiautomated regions of interest. J Nucl Med. 2000;41:1947–1954. [PubMed] [Google Scholar]
- 14.Halkar RK, Chrem Y, Galt JR. Interoperator variability in quantitating the MAG3 renal uptake based on semiautomated and manual regions of interest. J Nucl Med. 1996;37:293P. abstract. [Google Scholar]
- 15.Esteves FP, Taylor A, Manatunga A, Folks RD, Krishnan M, Garcia EV. 99mTc-MAG3 renography: normal values for MAG3 clearance and curve parameters, excretory parameters and residual urine volume. AJR. 2006;187:W-610–617. doi: 10.2214/AJR.05.1550. [DOI] [PubMed] [Google Scholar]
- 16.Goris ML, Daspit SG, McLaughlin P, et al. Interpolative Background Subtraction. J Nucl Med. 1976;17:744–747. [PubMed] [Google Scholar]
- 17.Garcia EV, Maddahi J, Berman DS, Waxman A. Space-time quantitation of thallium-201 myocardial scintigraphy. J Nucl Med. 1981;22:309–317. [PubMed] [Google Scholar]
- 18.Garcia EV, Ezekiel A. Digital processing in cardiac imaging. Intl J Cardiac Imaging. 1985;1:5–27. doi: 10.1007/BF01786159. [DOI] [PubMed] [Google Scholar]
- 19.Pratt WK. Digital Image Processing. John Wiley and Sons; 1978. (Sobel p478), (template matching p551) [Google Scholar]
- 20.Folks RD, Manatunga D, Garcia EV, Taylor AT. Development of a method for automated detection of patient motion in dynamic renal studies. J Nucl Med. 2009;50 2:433P. abstract. [Google Scholar]