Abstract
To explore mechanisms of restrictive respiratory physiology and high pleural pressure (PPl) in severe obesity, we studied 51 obese subjects (body mass index = 38–80.7 kg/m2) and 10 nonobese subjects, both groups without lung disease, anesthetized, and paralyzed for surgery. We measured esophageal and gastric pressures (PEs, PGa) using a balloon-catheter, airway pressure (PAO), flow, and volume. We compared PEs to another estimate of PPl based on PAO and flow. Reasoning that the lungs would not inflate until PAO exceeded alveolar and pleural pressures (PAO > PAlv > PPl), we disconnected subjects from the ventilator for 10–15 s to allow them to reach relaxation volume (VRel) and then slowly raised PAO until lung volume increased by 10 ml, indicating the “threshold PAO” (PAO-Thr) for inflation, which we took to be an estimate of the lowest PAlv or PPl to be found in the chest at VRel. PAO-Thr ranged from 0.6 to 14.0 cmH2O in obese and 0.2 to 0.9 cmH2O in control subjects. PEs at VRel was higher in obese than control subjects (12.5 ± 3.9 vs. 6.9 ± 3.1 cmH2O, means ± SD; P = 0.0002) and correlated with PAO-Thr (R2 = 0.16, P = 0.0015). Respiratory system compliance (CRS) was lower in obese than control (0.032 ± 0.008 vs. 0.053 ± 0.007 l/cmH2O) due principally to lower lung compliance (0.043 ± 0.016 vs. 0.084 ± 0.029 l/cmH2O) rather than chest wall compliance (obese 0.195 ± 0.109, control 0.223 ± 0.132 l/cmH2O). We conclude that many severely obese supine subjects at relaxation volume have positive Ppl throughout the chest. High PEs suggests high PPl in such individuals. Lung and respiratory system compliances are low because of breathing at abnormally low lung volumes.
Keywords: esophageal pressure, compliance, elastance, gastric pressure, pressure-volume curve
obesity is a known cause of restrictive respiratory physiology and low lung volumes. Morbidly obese individuals [body mass index (BMI) ≥ 40 kg/m2] have reduced total lung capacity (TLC), functional residual capacity (FRC), and vital capacity (VC) (6, 26). These subjects often have FRC reduced to near residual volume (RV); the reduction of FRC is even greater in the supine position (26). Such reductions in lung volume suggest elevation of pleural pressure (PPl) in morbid obesity.
To date, the studies of respiratory restriction in the obese have focused on changes in PPl that determine chest wall and lung compliance (CCW, CL) rather than estimating PPl itself. Naimark and Cherniack (11) and later Sharp et al. (16) reported that chest wall compliance was significantly reduced in obesity while lung compliance was normal. Subsequent studies by Hedenstierna and Santesson (5) and Suratt et al. (20) reported contrary findings of normal CCw and decreased CL in the obese. More recently, Pelosi et al. (13) found both CCW and CL to be reduced in morbidly obese subjects.
All the aforementioned studies reported changes in esophageal pressures (PEs); none reported actual values of PEs, presumably due to concern about the validity of esophageal manometry in estimating PPl in the obese. Although esophageal balloon catheters have been used to estimate PPl in normal subjects (3), their use in the obese has not been validated.
In this study we report values of PPl as estimated independently by esophageal balloon and by using the relation between the airway pressure (PAO) and lung volume (VL) during passive inflation of the lungs. We studied severely obese subjects and normal-weight controls, anesthetized and paralyzed, and tested the hypotheses that our severely obese subjects had higher PPl than normal subjects and that PEs is a useful indicator of PPl in obese subjects. We also related PEs to estimated PPl, gastric pressure (PGa), and BMI and studied the compliance of the respiratory system (CRS), CCW. and CL.
SUBJECTS AND METHODS
Subjects.
Fifty morbidly obese subjects and one moderately obese subject, which we will collectively call “severely obese subjects,” and 10 nonobese subjects (BMI < 30), all with healthy lungs, were studied immediately after induction of general anesthesia for elective surgery at Beth Israel Deaconess Medical Center. The severely obese subjects had BMI ranging from 38.0 to 80.7 kg/m2 (48.5 ± 8.9, mean ± SD) and were aged 20 to 69 yr (43.8 ± 11.9 yr), and 33 were female (see Supplement available with the online version of this article). Ten control subjects had BMI ranging from 19.2 to 29 kg/m2 (25.2 ± 2.8 kg/m2) and were aged 21–61 yr (44.7 ± 11.4), and 8 were female. Two additional subjects originally recruited as controls were found to have mild obesity, BMI slightly above 30 kg/m2; they were not included in the analysis but are shown in the figures with distinct symbols. The research was approved by the Committee on Clinical Investigations, and subjects gave informed written consent before study.
Measurements.
Subjects were studied before surgical incision and immediately after induction of general anesthesia including complete muscle relaxation using vecuronium with or without succinylcholine. Subjects were supine and mechanically ventilated with 100% O2 with tidal volumes of 0.64 ± 0.11 liters (Supplemental Table S-1, available with the online version of this article) and no preset positive end-expiratory pressure (PEEP), although a small PEEP was present in all subjects due to ventilator characteristics. PGa and PEs were measured using an adult esophageal balloon catheter (Ackrad Laboratories), passed by mouth or nose to position the balloon's tip at 60 cm from the incisors to measure PGa and then withdrawn to 40 cm to measure PEs. (In 25 subjects in whom it was not possible to advance the balloon into the stomach, PGa was not measured.) The 10-cm-long balloon was inflated with 0.5–1.0 ml of air. PAO was measured at the endotracheal tube, and airflow was measured with a pneumotachometer (Fleisch pneumotachograph type 1, Metabo SA). Signals were digitized, displayed, and recorded using Windaq software and hardware (Dataq Instruments, Akron, OH).
Threshold inflation airway pressure, PAO-Thr.
A major aim of this study was to estimate the distribution of pleural pressure surrounding the lungs. To do this, we inferred PPl from the airway pressure needed to cause lung inflation. We reasoned that in a relaxed intubated subject with open airways, if the highest PPl to be found in the chest is subatmospheric, then inflation should begin immediately as the airway pressure (PAO) is raised above atmospheric pressure. By contrast, if the lowest PPl to be found in the chest is above atmospheric pressure, the lungs would not begin to inflate until PAO is raised above that lowest PPl (where the local transpulmonary pressure would first become positive). Therefore, the PAO at which the lung volume first begins to increase is an approximate indicator of the lowest PPl to be found in the chest at relaxation volume (VRel).
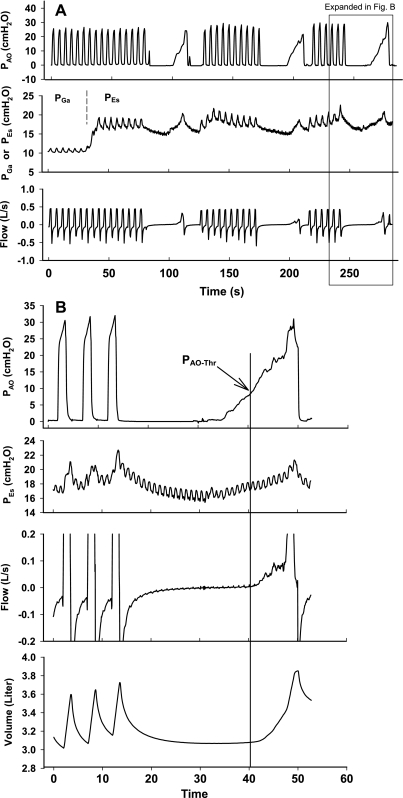
We determined the “threshold PAO” (PAO-Thr), the PAO required to initiate lung inflation during the slow increase in PAO from relaxation volume. To prevent noise in the flow signal from being interpreted as the start of inspiratory flow we needed to use a 10-ml increase in lung volume as our criterion for the start of inflation (Fig. 1). If there were no pulmonary resistive or elastic pressures to be overcome during a 10-ml inflation, PAO-Thr would be zero when the lowest PPl to be found in the chest at VRel was negative, and PAO-Thr would be equal to the lowest PPl to be found in the chest at VRel when the lowest PPl was positive. Under these theoretical conditions, PAO-Thr would be an upper bound of the lowest PPl to be found in the chest at VRel.
Fig. 1.
A: typical data from one experiment, illustrating the protocol (see text for explanation), showing airway pressure (PAO), gastric pressure (PGa), and esophageal pressure (PEs). Note the pressure rise when the balloon is withdrawn from stomach into the lower esophagus. B: third quasi-static inflation in A with expanded time scale and volume channel added. The gradual rise in PAO above the threshold airway pressure (PAO-Thr) causes lung inflation. PAO-Thr is 7.3 cmH2O in this example. (The threshold volume change of 10 ml is not visible at this scale.)
In reality, pulmonary resistance and lung elastance would raise the measured PAO-Thr above atmospheric pressure even with all the intrapulmonary airways open and PPl subatmospheric everywhere in the chest at VRel. To estimate how much PAO-Thr would be increased in such circumstances, we used a computational model to calculate the volume-time course of inflation, assuming that PAO increased at a constant rate, alveolar pressure (PAlv) = ΔV/CRS, and inspiratory flow rate = (PAO − PAlv)/RRS, where ΔV is the volume increment above VRel and RRS is respiratory resistance. We assumed a relatively high rate of increase in PAO = 4 cmH2O/s, a high RRS = 15 cmH2O · l−1 · s, and a low CRS = 0.02 l/cmH2O to conservatively estimate a high value of PAO-Thr due to resistance and elastance, namely 1.3 cmH2O (See Supplement, Fig S-1, available with the online version of this article). With these assumptions, PAO-Thr would be <1.3 cmH2O if most of the airways in the lung were open and PPl surrounding most of the lung at VRel was at atmospheric pressure or below. Conversely, PAO-Thr would be >1.3 cmH2O if most of the airways in the lung were closed (presumably due to positive pleural pressures at VRel) and/or if PPl surrounding most of the lung was above atmospheric pressure. Higher PAO-Thr values, by inference, would indicate commensurately higher PPl surrounding most of the lung at VRel.
Protocol.
The protocol is illustrated in Fig. 1A. We measured PGa and PEs during five or more tidal mechanical breaths. Then we disconnected the subject from the ventilator for 10–15 s to allow deflation to VRel, connected an Ambu bag to the endotracheal tube, and squeezed it to increase PAO gradually at 1- 3 cmH2O/s (mean = 1.5 cmH2O/s) until the bag was nearly empty. The deflation to VRel and subsequent quasi-static inflation for determination of PAO-Thr were repeated three times with at least one intervening minute of mechanical ventilation (Fig. 1A).
Analysis.
We measured PAO and PEs and PGa at end expiration (PEs-EE, PGa-EE) and at end inspiration (PEs-EI, PGa-EI) averaged over five consecutive tidal breaths. We also measured the PEs at VRel (PEs-Rel). Dynamic compliance of the respiratory system (CRS) was defined as average tidal volume change (ΔVL, found by integration of flow) divided by the average difference in PAO from end inspiration to end expiration at instants of zero flow: CRS = ΔVL/ΔPAO. Similarly, the dynamic compliance of the lung (CL) was defined as CL= ΔVL/ΔPL, where PL = transpulmonary pressure = PAO − PEs, and dynamic compliance of the chest wall (CCW) as CCW = ΔVL/ΔPEs.
To explore the mechanism of obesity-related restriction, we compared the elastance of the respiratory system (ERS = 1/CRS) with its additive components, lung and chest wall elastance (EL = 1/CL and ECW = 1/CCW; ERS = EL + ECW).
Statistics.
We used linear regression with correlation analysis to test the associations between PAO-Thr, PEs-Rel, BMI, and PGa, and Student's t-test to compare the compliance and elastance values between obese and control groups. Statistical significance was assumed for P < 0.05. Results are reported as means ± SD.
RESULTS
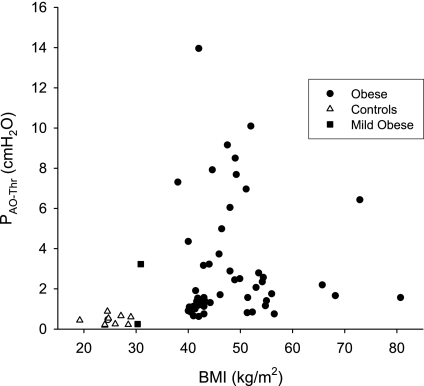
PAO-Thr ranged from 0.6 to 14.0 cmH2O (3.1 ± 3.0 cmH2O) in the obese group and from 0.2 to 0.9 cmH2O (0.4 ± 0.2 cmH2O) in the control group (P < 0.0001). In most of our obese subjects (22 female and 15 male), PAO-Thr was above 1.3 cmH2O indicating that most of the airways were closed and/or PPl surrounding most of the lung was above atmospheric pressure at VRel. By contrast, all control subjects had PAO-Thr below 1.3 cmH2O, indicating that most of the airways were open and PPl was subatmospheric surrounding most of the lung at VRel.
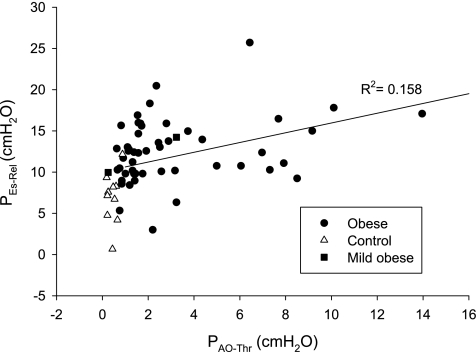
PEs-Rel ranged from 3.0 to 25.7 cmH2O (12.5 ± 3.9 cmH2O) in the severely obese group and from 0.7 to 12.2 cmH2O (6.9 ± 3.1 cmH2O) in the control group (P < 0.0001). In all subjects, there was a significant correlation between PEs-Rel and PAO-Thr (R2 = 0.16, P = 0.0015, Fig. 2) and a weak correlation in the obese group analyzed separately (R2 = 0.086, P = 0.0363).
Fig. 2.
PEs at relaxation volume (PEs-Rel) plotted against PAO-Thr, with line of regression (R2 = 0.16, P = 0.0015).
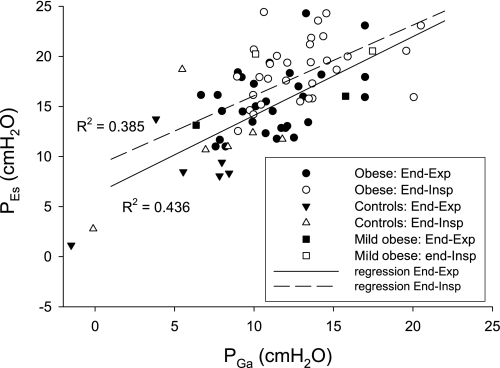
In the 30 obese subjects in whom it was possible to pass the balloon into the stomach, PGa-EE ranged from 6.7 to 17.0 cmH2O (11.5 ± 2.8 cmH2O). PGa and PEs were well correlated in all subjects at end expiration and end inspiration (R2 = 0.44, P < 0.0001 and R2 = 0.39, P < 0.0001 respectively, Fig. 3) and in the obese group analyzed separately (R2 = 0.17, P = 0.0225 and R2 = 0.13, P = 0.0470).
Fig. 3.
PGa at end expiration and end inspiration plotted against the corresponding PEs, with regression lines showing correlations (R2 = 0.44, P < 0.0001, and R2 = 0.39, P < 0.0001, respectively). The majority of subjects have above-normal intra-abdominal pressure (IAP) (PGa at end expiration ≥ 10 cmH2O).
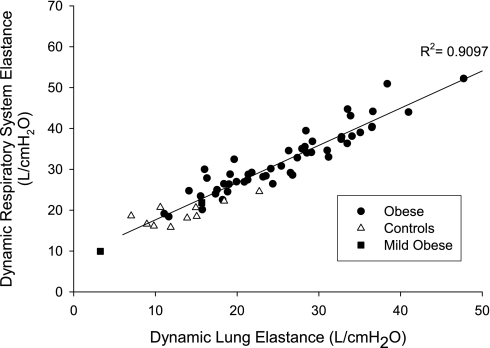
CRS in the severely obese group was lower than in the controls (P < 0.0001, Table 1). CCW in the obese group was not statistically different from values in the control group (Table 1), whereas CL was substantially lower in obese than in controls (P = 0.0016, Table 1). Respiratory system elastance (ERS), which is the sum of EL and ECW, was strongly correlated with EL in all subjects (R2 = 0.91, P < 0.0001, Fig. 4) and in the obese group (R2 = 0.90, P < 0.0001), whereas ERS was not significantly correlated with ECW. In all subjects, neither PEs-Rel nor PGa-EE was correlated with ECW. However, both PEs-Rel and PGa-EE were positively correlated with both EL and ERS (R2 ≥ 0.17, P ≤ 0.0092).
Table 1.
Range and mean values of CRS, CCW, and CL in severely obese and control subjects
| CRS, l/cmH2O | CCW, l/cmH2O | CL, l/cmH2O | |
|---|---|---|---|
| Control group (BMI < 30 kg/m2) | 0.041–0.063 (0.053 ± 0.007) | 0.086–0.539 (0.223 ± 0.132) | 0.044–0.142 (0.0.084 ± 0.029) |
| Severely obese group | 0.017–0.054 (0.032 ± 0.008) | 0.072–0.554 (0.195 ± 0.109) | 0.018–0.090 (0.043 ± 0.016) |
| P value (unpaired t-test) | P < 0.00001 | P = 0.5284 | P < 0.0016 |
Values are ranges (means ± SD). CRS, respiratory system compliance; CCW, chest wall compliance; CL, lung compliance; BMI, body mass index.
Fig. 4.
Dynamic respiratory system elastance (ERS) plotted against dynamic lung elastance (EL). ERS was principally determined by EL in our severely obese subjects (P < 0.0001).
In all subjects, BMI was positively correlated with ERS (R2 = 0.23, P < 0.0001) and EL (R2 = 0.20, P < 0.0003) but not with ECW. In the obese subjects, neither PAO-Thr (Fig. 5) nor PEs-Rel was correlated with BMI. When the BMI range was expanded to include the controls, a weak correlation was found for PAO-Thr (R2 = 0.068, P = 0.0425) and a stronger correlation for PEs-Rel (R2 = 0.26, P < 0.0001).
Fig. 5.
PAO-Thr plotted against body mass index (BMI). PAO-Thr was not correlated with BMI in our obese subjects (R2 = 0.0002) but was weakly correlated when the control group was included in the regression (R2 = 0.068). (There are superimposed symbols in the control group.)
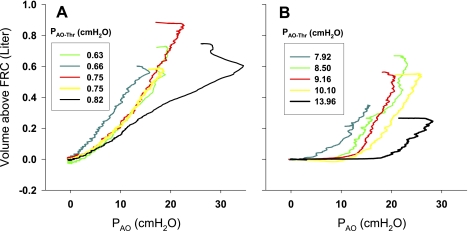
To explore the mechanism leading to high PAO-Thr, we analyzed data obtained during inflation of the lung with the Ambu bag. We reasoned that in subjects with low PAO-Thr, the inflation would begin with open airways, and the quasi-static inflation PAO-VL curve would be relatively linear, whereas in those obese subjects with high PAO-Thr, inflation would begin with many airways closed, and the quasi-static inflation PAO-VL curve would exhibit the effects of recruitment after prior airway closure. Comparing the quasi-static inflation PAO-VL curves from the obese subjects with the five highest and five lowest PAO-Thr values, we found that in the lowest PAO-Thr group (Fig. 6A), the inflation PAO-VL curves appear almost linear above VRel, consistent with open airways in a lung at a positive transpulmonary pressure (PAO − PPl) at end exhalation. By contrast, in the highest PAO-Thr group (Fig. 6B), the pressure rises before inflation begins, and the curves have a downward convexity or “knee” characteristic of air space recruitment, beyond which volume increases in a nearly linear fashion.
Fig. 6.
Quasi-static inflation PAO-lung volume (VL) curves of the lungs in morbidly obese subjects with the 5 lowest (A) and 5 highest (B) PAO-Thr. Curves of the subjects with the highest PAO-Thr exhibited a downward convexity (“knee”) early in inflation. FRC, functional residual capacity.
DISCUSSION
The major finding of this study is that pleural pressure in obese subjects at VRel, whether estimated using PEs or inferred from airway pressure and flow measurements, is greater than normal, often substantially above atmospheric pressure. This is the first report of resting values of PEs in anesthetized, paralyzed obese subjects. Steier et al. (18) reported elevated baseline PEs in conscious obese subjects, but most previous studies of PEs in supine subjects have ignored the resting “baseline” values of PEs, reporting only changes in PEs.
This is also the first study to estimate PPl in obese subjects by a method independent of PEs. The correlation between PEs-Rel and PAO-Thr suggests that both measurements can be used to estimate the likelihood of high effective PPl in obese supine subjects. However, although PEs and PAO-Thr are correlated, they differ substantially and variably. What could explain this difference? First, PEs is thought to be higher than PPl in the supine posture (7, 25). The esophagus is roughly midway between the ventral and dorsal boundaries of the thoracic cavity, and in the supine posture, there is a hydrostatic increase in pressure within the mediastinum due to the weight of the heart and mediastinal tissues above. Therefore, PEs is probably higher than PPl surrounding the lung at the same height in thorax, a discrepancy estimated to be ∼5 cmH2O (25). Second, the hydrostatic pressure gradient in the pleural space could cause PAO-Thr (i.e., the lowest pleural pressure surrounding a large part of the lung) to be lower than PPl at mid-lung height. Even when PPl at mid-lung height is positive (presumably causing airway closure and positive pressures in the dependent alveoli), PPl may be negative in nondependent lung regions, where open airways and atmospheric alveolar pressures at VRel enable PAO-Thr values to be low. Third, when widespread positive PPl at VRel causes closure of most of the small airways, PAO-Thr will be higher than PPl by the opening pressure required to open small airways closed by a meniscus (2). The opening pressure of healthy human airways is unknown, but opening pressure has been estimated to be in the range of 3 cmH2O in excised rat lungs (2), and it may not be much higher in healthy lungs that have not developed widespread atelectasis. In this study, when PAO-Thr is >1.3 cmH2O, PAO-Thr is an estimate of the minimum pleural pressure surrounding a substantial portion of the lung at VRel plus any opening pressure. In summary, PAO-Thr and PEs-Rel are correlated, although hydrostatic pressure gradients in the mediastinum and pleural space and the opening pressure of the collapsed airways weaken the correlation.
The second major finding is that, compared with control subjects, our severely obese subjects are characterized by lower CRS and CL, whereas CCW is usually normal. This finding differs from those of Naimark and Cherniak (11) and Sharp et al. (16), who measured compliance while subjects breathed spontaneously or relaxed respiratory muscles voluntarily. Both studies had reported normal CL with low CCW in obesity. However, more recent studies during muscle paralysis (5) or with confirmed diaphragm relaxation (20) reported normal CCW in obesity, suggesting that differences in CCW were due to the experimental method. Van Lith et al. (23) investigated this possibility by comparing elastance in six healthy obese subjects both during voluntary muscle relaxation and during anesthesia with paralysis. They found higher ERS and ECW during voluntary relaxation than during paralysis, suggesting that incomplete relaxation in early studies could have contributed to lower CCW in the obese (23). By exception, Pelosi et al.(13) found both CCW and CL to be significantly lower in anesthetized, paralyzed, morbidly obese subjects studied after major abdominal surgery.
It is possible that ventilation with 100% oxygen in our study could have contributed to development of atelectasis that reduced CL in the obese group (4). CL was not reduced in the control group, suggesting high PPl and consequent small airway closure would be required for the formation of atelectasis in obese subjects. Furthermore, the short duration of ventilation on 100% oxygen (∼10 min) argues against the primary role of atelectasis in reducing CL in the obese.
Another possibility is that CL is lower in obese subjects because the positional artifact that increases PEs in supine subjects is volume dependent (7). The importance of this artifact is said to decrease during inflation because upward movement of the ventral thorax lifts the heart and mediastinal contents, which no longer rest as heavily on the esophagus and balloon (7). However, the artifactual reduction in PEs during inflation would cause the apparent elastance of the lung to increase and that of the chest wall to decrease by the same amount, so the sum of these elastances, which is ERS, would not be altered. Therefore, the strong correlation of respiratory system elastance, which is independent of PEs, with lung elastance (R2 = 0.8962) argues against this explanation and suggests that the increase in ERS is caused by a real increase in EL. In addition, the above artifact could cause a downward concavity of the PEs-VL curve as the positive pressure artifact in PEs decreased during inflation (see rationale and depiction in Ref. 7). We examined the quasi-static inflation curves of chest wall (PEs-VL curves) in those subjects pictured in Fig. 6B and found no hint of the decreasing compliance that might be predicted by this mechanism (7).
The fact that CCw is normal in obese subjects is consistent with “mass loading” of the chest wall rather than “stiffening of the chest” by elastic loading, as demonstrated experimentally by Sharp et al. (15).
Model of P-V curves in obesity.
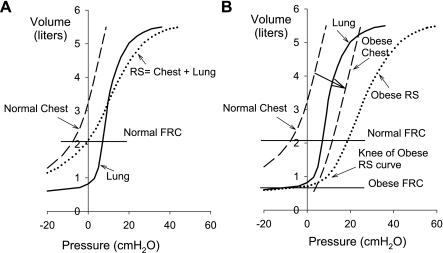
Another mechanism whereby high PPl could cause low compliance of the lung and respiratory system is shown schematically in Fig. 7. In Fig. 7A, pressure-volume (P-V) curves are drawn for a normal lung and chest wall, and the respiratory system P-V curve was constructed by adding the pressures across lung and chest wall. FRC (taken as equal to VRel) is the volume at which lung and chest wall recoil pressures are equal and opposite. In this depiction, the normal lung is shown as having a region of low compliance and stiffening at low volumes where airway closure occurs at negative transpulmonary pressures. This region of the inflation P-V curve of normal lungs is seldom observed in vivo, because normally transpulmonary pressures are not statically negative, especially in upright subjects (14). However, this behavior is observed routinely in experimental preparations, for example when excised lungs are exposed to sustained negative PAO (24). Stiffening of the lungs at very low volumes has also been demonstrated in healthy breath-hold divers after they empty their lungs below residual volume by employing glossopharyngeal exsufflation (8).
Fig. 7.
Hypothetical pressure-volume curves in normal (A) and obese (B) subjects, showing effects of increased pleural pressure (PPl) on lung behavior above FRC. In the normal respiratory system (RS; A), FRC is above closing volume, and the PAO-VL curve is relatively linear. In some obese subjects (B), the high PPl lowers FRC to closing volume. The normal lung appears noncompliant, and the inflation PAO-VL curve has a “knee.”
Figure 7B illustrates the possible effects of an increase in extrapulmonary volume, for example fat, within the chest wall or “mass loading” (15). The chest wall P-V curve as drawn exhibits higher pressures at any lung volume without being stiffer (i.e., without a decrease in slope), consistent with our observations of normal CCW and high PEs in many obese subjects. The volumes of intra-abdominal and mediastinal fat increase in obesity (9), which could cause the chest wall to contain more volume and the lung to be smaller than normal at VRel, making the pleural pressure more positive. Since the normal chest wall curve stiffens at low volumes, largely due to developing tension in the diaphragm (17), the chest wall curve becomes more compliant as chest wall volume increases. Thus increasing the volume of fat within the chest wall could actually increase its compliance over much of the vital capacity.
In the resulting respiratory system P-V curve in Fig. 7B, FRC has decreased to a lung volume near the former RV, where the lung's P-V curve is stiffened by small airway closure, a phenomenon that causes the respiratory P-V curve to exhibit a downward convexity (24) similar to that observed by Pelosi et al. (13) in anesthetized obese subjects.
This theoretical analysis is consistent with the quasi-static inflation PAO-VL curves of the obese subjects with the five highest and five lowest PAO-Thr values (Fig. 6). In the lowest PAO-Thr group, the inflation PAO-VL curves were nearly linear above VRel, consistent with most of the airways being open and PPl surrounding most of the lung being at or below atmospheric pressure (Fig. 6A). Increasing airway pressure caused inflation. By contrast, in the group with highest PAO-Thr, the PAO-VL curves have a “knee” or region of downward convexity above VRel, consistent with pleural pressure surrounding most of the lung being above atmospheric pressure, causing closure of most small airways at VRel. As PAO increased, initially there was little inflation until the airways opened and positive pleural pressure was exceeded, enabling progressive recruitment of lung regions until the PAO-VL curve followed a linear trajectory similar to those in the low PAO-Thr group.
During spontaneous breathing, positive end-expiratory alveolar pressure, known as intrinsic PEEP (PEEPi), is greater in obese subjects and is increased by the supine posture (12). PEEPi constitutes a threshold load for inspiration, increasing the work of breathing and increasing the dynamic elastance of the lung during tidal ventilation. Our findings that dynamic EL and ERS were positively correlated with PEs-Rel and PGa-EE suggest that high pleural pressures in the obese reduce the FRC, lowering expiratory flow rates, increasing PEEPi, and reducing the measured dynamic lung compliance.
As expected, PGa was elevated in most of our obese subjects. Assuming the equivalence of PGa and bladder pressure in assessing intra-abdominal pressure (IAP) (1), and using reference values of the World Congress on Abdominal Compartment Syndrome (10), we found 23 of 30 obese subjects (76%) had IAP greater than normal (PGa ≥ 10 cmH2O), and three of them (all female) had IAP in the range of abdominal hypertension (PGa ≥ 16.3 cmH2O).
PGa and PEs were correlated at end expiration and end inspiration in all subjects (Fig. 3) and in the obese group, as was reported in ventilated patients by Talmor et al. (21). However, the correlation is not very strong for several reasons. The distal esophagus is lower than the gastric fundus in supine subjects, causing a gravitational pressure gradient that raises PEs relative to PGa to differing degrees among subjects. In addition, there may be passive tension in the diaphragm in some subjects reducing PEs relative to PGa. Finally, the aforementioned effects of the mediastinal contents pressing on the esophagus contribute variability and weaken the correlation between PEs and PGa.
In obese and control subjects combined, there was a weak correlation of PAO-Thr with BMI and a stronger correlation of PEs with BMI. However, contrary to expectation, we found no correlation between BMI and PAO-Thr (Fig. 5) or PEs in our severely obese subjects, suggesting that obesity, per se, is not predictive of high pleural pressure. The question whether the pattern of obesity (abdominal vs. peripheral) might affect the elevation of PPl was tested in the final 13 obese subjects in whom we measured waist circumference (WC) and sagittal abdominal diameter (SAD), the anthropometric correlates of intra-abdominal fat volume and the intra-abdominal pressure (19, 22). Neither WC nor SAD was correlated with PAO-Thr or PEs-Rel in this cohort, nor was there any sex-based difference in the levels of PAO-Thr and/or PEs-Rel in obese subjects.
In conclusion many morbidly obese supine subjects appear to have high, often positive pleural pressure surrounding most of the lung while relaxed at VRel. High pleural pressure would cause tidal breathing to be initiated from low end-expiratory volumes where the lungs are less compliant and airways are prone to close on exhalation. This finding is variable and not predictable from BMI, WC, or SAD. High esophageal pressure is a useful, if imperfect, indicator of the likelihood of high pleural pressure in these subjects.
GRANTS
This work was supported by grant HL-52586 from the National Institutes of Health.
DISCLOSURES
None of the authors has any financial interest that could be affected by the subject of this report. No conflicts of interest are declared by the authors.
Supplementary Material
ACKNOWLEDGMENTS
We thank Lauren Marquis, Dr. Carlos Puyo, Dr. Vimal Akhouri, and Beth Israel Deaconess Medical Center surgeons for help in recruiting subjects and acquiring data.
REFERENCES
- 1. Collee GG, Lomax DM, Ferguson C, Hanson GC. Bedside measurement of intra-abdominal pressure (IAP) via an indwelling naso-gastric tube: clinical validation of the technique. Intensive Care Med 19: 478–480, 1993 [DOI] [PubMed] [Google Scholar]
- 2. Frazer DG, Stengel PW, Weber KC. Meniscus formation in airways of excised rat lungs. Respir Physiol 36: 121–129, 1979 [DOI] [PubMed] [Google Scholar]
- 3. Fry DL, Stead WW, Ebert RV, Lubin RI, Wells HS. The meaurement of intraesophageal pressure and its relationship to intrathoracic pressure. J Lab Clin Med 40: 664–673, 1952 [PubMed] [Google Scholar]
- 4. Hedenstierna G, Rothen HU. Atelectasis formation during anesthesia: causes and measures to prevent it. J Clin Monit Comput 16: 329–335, 2000 [DOI] [PubMed] [Google Scholar]
- 5. Hedenstierna G, Santesson J. Breathing mechanics, dead space and gas exchange in the extremely obese, breathing spontaneously and during anaesthesia with intermittent positive pressure ventilation. Acta Anaesthesiol Scand 20: 248–254, 1976 [DOI] [PubMed] [Google Scholar]
- 6. Jones RL, Nzekwu MM. The effects of body mass index on lung volumes. Chest 130: 827–833, 2006 [DOI] [PubMed] [Google Scholar]
- 7. Knowles JH, Hong SK, Rahn H. Possible errors using esophageal balloon in determination of pressure-volume characteristics of the lung and thoracic cage. J Appl Physiol 14: 525–530, 1959 [Google Scholar]
- 8. Loring SH, O'Donnell CR, Butler JP, Lindholm P, Jacobson F, Ferrigno M. Transpulmonary pressures and lung mechanics with glossopharyngeal insufflation and exsufflation beyond normal lung volumes in competitive breath-hold divers. J Appl Physiol 102: 841–846, 2007 [DOI] [PubMed] [Google Scholar]
- 9. Mahabadi AA, Massaro JM, Rosito GA, Levy D, Murabito JM, Wolf PA, O'Donnell CJ, Fox CS, Hoffmann U. Association of pericardial fat, intrathoracic fat, and visceral abdominal fat with cardiovascular disease burden: the Framingham Heart Study. Eur Heart J 30: 850–856, 2009 [DOI] [PMC free article] [PubMed] [Google Scholar]
- 10. Malbrain ML, Cheatham ML, Kirkpatrick A, Sugrue M, Parr M, De Waele J, Balogh Z, Leppaniemi A, Olvera C, Ivatury R, D'Amours S, Wendon J, Hillman K, Johansson K, Kolkman K, Wilmer A. Results from the International Conference of Experts on Intra-abdominal Hypertension and Abdominal Compartment Syndrome. I. Definitions. Intensive Care Med 32: 1722–1732, 2006 [DOI] [PubMed] [Google Scholar]
- 11. Naimark A, Cherniack RM. Compliance of the respiratory system and its components in health and obesity. J Appl Physiol 15: 377–382, 1960 [DOI] [PubMed] [Google Scholar]
- 12. Pankow W, Podszus T, Gutheil T, Penzel T, Peter J, Von Wichert P. Expiratory flow limitation and intrinsic positive end-expiratory pressure in obesity. J Appl Physiol 85: 1236–1243, 1998 [DOI] [PubMed] [Google Scholar]
- 13. Pelosi P, Croci M, Ravagnan I, Vicardi P, Gattinoni L. Total respiratory system, lung, and chest wall mechanics in sedated-paralyzed postoperative morbidly obese patients. Chest 109: 144–151, 1996 [DOI] [PubMed] [Google Scholar]
- 14. Salazar E, Knowles JH. An analysis of pressure-volume characteristics of the lungs. J Appl Physiol 19: 97–104, 1964 [DOI] [PubMed] [Google Scholar]
- 15. Sharp JT, Henry JP, Sweany SK, Meadows WR, Pietras RJ. Effects of Mass Loading the Respiratory System in Man. J Appl Physiol 19: 959–966, 1964 [DOI] [PubMed] [Google Scholar]
- 16. Sharp JT, Henry JP, Sweany SK, Meadows WR, Pietras RJ. The total work of breathing in normal and obese men. J Clin Invest 43: 728–739, 1964. [DOI] [PMC free article] [PubMed] [Google Scholar]
- 17. Smith JC, Loring SH. Passive mechanical properties of the chest wall. In: Handbook of Physiology. The Respiratory System. Mechanics of Breathing. Bethesda, MD: Am. Physiol. Soc., 1986, sect. 3, vol. III, pt. 2, chapt. 25, p. 429–442 [Google Scholar]
- 18. Steier J, Jolley CJ, Seymour J, Ward K, Lunt A, Reilly C, Polkey MI, Moxham J. Obese patients develop an intrinsic positive end expiratory pressure (PEEP) when supine. Am J Respir Crit Care Med 177: A275, 2008 [Google Scholar]
- 19. Sugerman H, Windsor A, Bessos M, Wolfe L. Intra-abdominal pressure, sagittal abdominal diameter and obesity comorbidity. J Int Med 241: 71–79, 1997 [DOI] [PubMed] [Google Scholar]
- 20. Suratt PM, Wilhoit SC, Hsiao HS, Atkinson RL, Rochester DF. Compliance of chest wall in obese subjects. J Appl Physiol 57: 403–407, 1984 [DOI] [PubMed] [Google Scholar]
- 21. Talmor D, Sarge T, O'Donnell CR, Ritz R, Malhotra A, Lisbon A, Loring SH. Esophageal and transpulmonary pressures in acute respiratory failure. Crit Care Med 34: 1389–1394, 2006 [DOI] [PMC free article] [PubMed] [Google Scholar]
- 22. Valsamakis G, Chetty R, Anwar A, Banerjee AK, Barnett A, Kumar S. Association of simple anthropometric measures of obesity with visceral fat and the metabolic syndrome in male Caucasian and Indo-Asian subjects. Diabet Med 21: 1339–1345, 2004 [DOI] [PubMed] [Google Scholar]
- 23. Van Lith P, Johnson FN, Sharp JT. Respiratory elastance in relaxed and paralyzed states in normal and abnormal men. J Appl Physiol 23: 472–486, 1967 [DOI] [PubMed] [Google Scholar]
- 24. Venegas JG, Harris RS, Simon BA. A comprehensive equation for the pulmonary pressure-volume curve. J Appl Physiol 84: 389–395, 1998 [DOI] [PubMed] [Google Scholar]
- 25. Washko GR, O'Donnell CR, Loring SH. Volume-related and volume-independent effects of posture on esophageal and transpulmonary pressures in healthy subjects. J Appl Physiol 100: 753–758, 2006 [DOI] [PubMed] [Google Scholar]
- 26. Yap JC, Watson RA, Gilbey S, Pride NB. Effects of posture on respiratory mechanics in obesity. J Appl Physiol 79: 1199–1205, 1995. [DOI] [PubMed] [Google Scholar]
Associated Data
This section collects any data citations, data availability statements, or supplementary materials included in this article.


