Abstract
An outbreak of anthrax in Saskatchewan in 2006 affected more than 800 animals at 150 locations. The purpose of this study was to assess the spatial and temporal patterns among the cases to determine if there were any significant trends associated with this outbreak. Case and population data were first analyzed for each individual farm location and then again as aggregate data per rural municipality using spatial and spatiotemporal statistical methods such as Oden’s Ipop, Cuzick-Edwards’ test, spatial scan test, and other mapping techniques. East central Saskatchewan was identified as a primary high risk area, particularly during July 2006. The results of the study led to the conclusion that within this high-risk region, flooding in spring followed by hot and dry conditions could have been a factor in the development of the outbreak.
Résumé
Analyse spatiale d’une éclosion d’anthrax en Saskatchewan en 2006. Une éclosion d’anthrax en Saskatchewan en 2006 a touché plus de 800 animaux à 150 emplacements. L’objet de cette étude a été d’évaluer les tendances spatiales et temporelles parmi les cas afin de déterminer s’il y avait des tendances significatives associées à cette éclosion. Les cas et les données de population ont d’abord été analysés pour chaque ferme individuelle puis examinés de nouveau en tant que des données globales par municipalité rurale en utilisant des méthodes statistiques spatiales et spatiotemporelles comme l’Ipop d’Oden, le test de Cuzick-Edwards, l’épreuve d’empan spatial et d’autres techniques cartographiques. Le centre-est de la Saskatchewan a été identifié comme une région à risque élevé primaire, particulièrement en juillet 2006. Les résultats de l’étude ont permis de tirer la conclusion que, dans cette région à risque élevé, les inondations printanières suivies d’un temps chaud et sec auraient pu contribuer au développement de l’éclosion.
(Traduit par Isabelle Vallières)
Introduction
Anthrax occurs sporadically on the prairies nearly every year (1). Outbreaks are generally limited to a few cases driven by man-made environmental disturbance, flooding, drought or other natural disturbances which bring the spores up to the surface where grazing animals can be exposed. Past anthrax outbreaks in Saskatchewan livestock have been given little attention in the reported literature. In 2006, more than 800 cases of anthrax in domestic animals (cattle, bison, horses, sheep, goats, cervids, and pigs) on more than 150 farm locations were documented by the Canadian Food Inspection Agency (CFIA) in east-central Saskatchewan (2). This area had experienced extremely wet conditions and flooding after the fall of 2005, which was followed by a hot, dry summer in 2006 (2).
The use of Geographical Information Systems (GIS) allows for visual inspection of the data by mapping the locations of anthrax cases. Application of modern spatial or temporal statistical and epidemiological methods allows for further exploration and modeling of the data to gain deeper insight into the data collected during an outbreak (3). The data can be examined for patterns by looking at either individual points or aggregated data over defined geographic regions. The data can also be analyzed by examining different temporal divisions, such as days, weeks, months, or years. The ultimate goal of spatial and temporal analysis is to differentiate real and statistically significant patterns or clusters in the disease distribution from randomly occurring patterns, especially chance clusters.
A cluster of cases is defined as an unusual occurrence of events close in space, time, or both (4). If the analysis is limited to visual inspection of case maps, false clusters can be identified which are due to underlying population dynamics, such as variations in the population density, or unknown factors. The methods used herein make it possible to identify real clusters of cases from amongst the underlying populations at risk, identify areas and periods of time of higher risk, and provide indications for areas of further investigation (3,4).
The spatial and spatiotemporal analysis of the 2006 anthrax outbreak in Saskatchewan is described. The objective was to evaluate the sites where anthrax cases occurred for spatial and temporal patterns and compare these patterns to those of control and historical anthrax case locations to determine if the disease clustered in space or time. The information gathered from this analysis will be applied to subsequent analyses of a case-control risk factor study and a predictive risk mapping study.
Materials and methods
Recent anthrax outbreak: 2006
A case was defined as an animal with classic symptoms of anthrax, including sudden death, sudden illness characterized by bleeding, difficulty breathing, or edema that usually rapidly progresses to death, and either confirmed as a positive anthrax case by the CFIA Lethbridge Laboratory, an OIE Reference Laboratory for Anthrax, or located on a premise with a previously indentified positive animal (2). Any positive samples found by non-accredited laboratories were sent to the CFIA for confirmation.
As part of the CFIA control efforts, every farm location that had had a diagnosed case of anthrax was entered into a database which contained the spatial location information, the date of first death, the date of last death, the number of deaths, the date of vaccination for anthrax, the species affected, and the total number of animals on the farm. Other questions were asked about farm management but were not used in this analysis. If a farm had more than one parcel of land with anthrax cases separated by distance (half a mile or more) or a physical barrier such as a grid road, they were considered separate farm locations for the analysis. Hereafter “case farm” will refer to the locations used in the analysis.
Study area and control farm selection
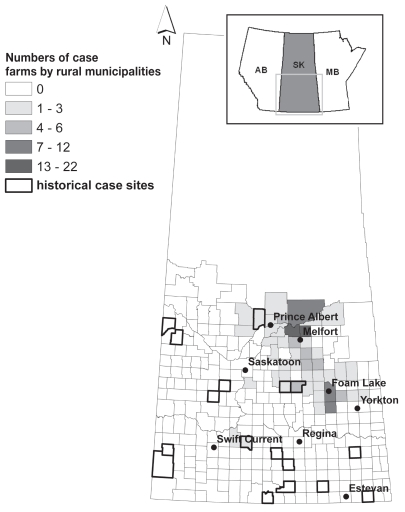
The study area was defined as the southern portion of the province of Saskatchewan, Canada (Figure 1). This is the geographical extent of most of the land mass dedicated to agriculture within the province and most human and livestock populations. Hereafter, any reference to “Saskatchewan” or the “study area” will refer to the southern portion of Saskatchewan (SK).
Figure 1.
Number of case farms by rural municipality (RM) in 2006. The area showing the rural municipality boundaries is the study area. The rural municipalities with recorded anthrax outbreaks in previous years are included.
Control farms were selected for the spatial analysis using geographical stratified sampling. The goal of this selection process was to enroll a minimum of 250 control farms randomly across the entire study area. The study area was divided into 17 agricultural census divisions based on defined Statistics Canada geographical boundaries. Within each of these census divisions, the number of cattle farms and percentage of total provincial cattle farms was determined using Statistics Canada 2006 agriculture census database. The census information was used to determine the minimum number of farms to be contacted per census division to create a geographically representative control group. For each division, veterinary clinics were contacted until at least one agreed to work with investigators to identify suitable control farms.
A “control farm” had no evidence of anthrax or suspicious deaths in 2006, had cattle (with or without other livestock), and was willing to participate in a short telephone survey about farm management practices that existed in 2006. Farm owners were contacted by phone in the summer of 2007 and if they agreed to participate they were interviewed using a standardized interview format and similar questions to those of the owners of case farms. If cattle moved around during the 2006 season, the pasture used the most during the months of June, July, and August was designated the spatial location for use in the following analysis.
Historical anthrax outbreaks: 1912–2005
Historical outbreaks reported to the CFIA were entered into a database which included information on: month of diagnosis, number of farms involved, number and species of animals involved, and location if known [town, rural municipality (RM), or land location]. The information was then mapped by RM.
Data analysis — 2006 outbreak
All GIS applications were done in ArcGIS 9.2 (ESRI, Redlands, California, USA). Spatial and spatiotemporal data analysis was conducted using R 2.6.1 (The R Foundation for Statistical Computing, Vienna, Austria), SaTScan v7.0.3 (Kulldorff M and Information Management Services, www.satscan.org, Boston, Massachusetts, USA) and ClusterSeer v2 (TerraSeer, Ann Arbor, Michigan, USA). For data management, MSExcel (Microsoft, Redmond, Washington, USA) was applied.
For the purpose of individual farm-level analysis, the case location database was limited to those farms with bovine cases of anthrax (n = 125). All of the case and control farm locations were stored and displayed as point locations. For RM level analysis, all farms with cattle, sheep, horses, goats, elk, deer, and bison were included aggregated into RM database. The 2 farm locations with only swine cases were excluded from the case location database because there was no way to identify the appropriate population at risk. The Statistics Canada 2006 agriculture census database does not report the number of farms with outdoor swine operations. The RM level information was displayed as number of farms within the regional location boundaries.
The 2006 data were analyzed spatially and temporally at both the individual farm location and RM level. Then the data were descriptively compared to historical data. First, methods were used to test for evidence of overall clustering in the dataset. The method used was Oden’s Ipop for the regional or aggregated dataset and Cuzick-Edwards’ test and K-function analysis for the individual dataset. Oden’s Ipop is a modification of Moran’s I which offers the ability to see if regional count data indicate spatial variation not attributable to random chance or heterogeneity of underlying populations (3,4). Cuzick-Edwards’ test assesses individual point data for evidence of clustering while adjusting for heterogeneity of the underlying population by using control sites as a surrogate for the entire population at risk. This methodology also allows for the investigation of some confounding factors (4). The use of the K-function analysis technique provides information on whether or not the variation occurs on a large or smaller or both geographical scales.
Once evidence of clustering was determined in step one, the next step was to identify where the clusters existed in space and time. Kuldorff’s space-time scan statistic [incidence per RM (by week) in a Poisson model] was used for RM level analysis and spatiotemporal scan statistic [binomial model of point data for case and control farms (by week)] for individual farm-level analysis. Both of these methodologies are able to locate cluster sites in both space and time as well as testing the significance of the specific clusters (3,4).
In the 3rd step, maps were created to identify the areas where herds had the highest risk for contracting anthrax. This was accomplished by applying kernel density estimation to the individual point dataset. This method creates an intensity function which details the probability of observing an event at any particular location within the study area (3–5). The ratio of the intensity maps for both the cases and the control results in an odds map which shows the geographical variation and range of odds of disease occurrence. By incorporating the background risk defined by the spatiotemporal scan test, an exploratory relative risk map is created (5,6). The relative risk map allows quantification of the potential importance of unknown factors and whether they warrant further investigation.
Finally, a velocity vector map was developed (3,7). A vector velocity of the week each RM first reported an anthrax case on any premise was used to explore the geographical progression of reported anthrax diagnosis over time. The week of first reported anthrax premise by RM (for all species affected) and the centroid coordinates for each RM were entered in a database. Least square regression using linear, quadratic, cubic, and higher-order polynomials of these coordinates to predict week of first reported case was conducted and the best model fit was reported. Partial differential equations were derived from the fitted model, giving a vector of the magnitude (velocity) and the direction of spread for each location.
Results
Recent anthrax outbreak: 2006
In June 2006, the first case of anthrax for the year was diagnosed in Saskatchewan. Using the CFIA internal electronic database and completed paper copies of information collected for each case farm location, 155 separate sites (excludes 2 swine only sites) were identified, 125 of which had at least one bovine death. The 155 anthrax sites were located in 46 different RMs (Figure 1); out of these sites, the 125 bovine anthrax case locations covered only 40 RMs. The bovine-only farm locations were used exclusively in further individual farm-level spatial and temporal analysis.
In 2007, of the 51 clinics listed in the geographical regions used for control farm selection, the first 21 contacted were willing to participate in the project but 3 were dropped due to an inability to follow-through in an acceptable time period. With the help of these clinics, a total of 271 potential control farms were identified. Of these, a total of 259 eligible control farms (met control definition) were enrolled in a telephone interview process. Data on all 259 participating control farms were used in spatial and spatiotemporal investigations at the aggregate RM level, while 256 control farms provided detailed information for spatial referencing, which allowed a further individual farm-level data analysis. The 259 control farms represented 127 different RMs and were considered a satisfactory representation of the underlying population originally used as selection criteria.
Historical anthrax outbreaks: 1912–2005
A total of 23 Saskatchewan anthrax outbreaks have been reported to the CFIA since 1912 (Table 1) from 17 different RMs (Figure 1). There was no location information for the outbreak in 1912 which was confined to 1 farm killing 4 animals (species unknown). Anthrax outbreaks were rarely reported prior to the 1960’s. Most of the outbreaks reported occurred during the months of June, July, August, and September. Historical anthrax cases were previously reported in RMs with anthrax cases in 2006: 164, 309, 310, and 493 (Figure 1).
Table 1.
Past anthrax outbreaks reported to Canadian Food Inspection Agency
| Year | Month | RMa | Number of farms | Number of cases | Animal species |
|---|---|---|---|---|---|
| 1912 | N/Ab | N/A | 1 | 4 | N/A |
| 1948 | N/A | 493 | 1 | 2 | Cattle |
| 1951 | N/A | 111 | 2 | 8 | Cattle |
| 1952 | July | 12 | 1 | 3 | Cattle |
| 1957 | July | 131 | 1 | 6 | Lion, cougar, bobcat civet, raccoon, fitch |
| 1964 | July | 164 | 1 | 17 | Cattle |
| August | 40 | 1 | 6 | Cattle | |
| 1965 | August | 124 | 1 | 15 | Cattle |
| 1967 | September | 287 | 1 | 2 | Cattle |
| 316 | 1 | 1 | Horse | ||
| 1970 | February | 3 | 1 | 1 | Cattle (cow) |
| 1971 | May | 37 | 1 | 1 | Cattle (bull) |
| December | 111 | 1 | 3 | Cattle | |
| 1972 | December | 472 | 1 | 1 | Cattle (cow) |
| 1973 | June | 37 | 1 | 3 | Cattle |
| 1980 | February | 141 | 1 | 5 | Cattle |
| 1994 | July | 316 | 1 | 1 | Cattle (cow) |
| August | 100 | 1 | 8 | Cattle | |
| 2000 | September | 309 | 1 | 1 | Cattle |
| 2001 | September | 310 | 1 | 2 | Cattle |
| 2004 | January | 440 | 1 | 10 | Cattle |
RM = rural municipality; by identification number.
N/A = not available.
Data analysis results
There was evidence of clustering of anthrax cases in the 2006 outbreak. This was indicated by Oden’s Ipop at the RM level (Ipop’ 9.07, P = 0.002), Cuzick-Edward’s test at the individual farm level (P = 0.001) and plotting results from the K-function of the farm level data which indicate clustering at large geographical distances (results not shown).
Rural municipality level space-time statistical methods identified one primary cluster of 53 RMs in the east-central area of the province from June 25 to August 5, 2006 (P = 0.01) (Table 2). Scan test identified 3 space-time clusters (Table 2; Figure 2) for the individual point dataset where the primary space-time cluster occurred from June 30th to July 29th, 2006 (Table 2).
Table 2.
Cluster detection of anthrax case farms, Saskatchewan, 2006
| Analysis type | Cluster | Time period | RMs in cluster | Expected cases | Observed cases | Relative risk | P-value | Cluster radius (kma) |
|---|---|---|---|---|---|---|---|---|
| RM | ||||||||
| level | primary | June 25 – August 5 | 53 | N/Ab | N/A | N/A | 0.01 | N/A |
| spatiotemporal | secondary | July 23–29 | 2 | N/A | N/A | N/A | 0.01 | N/A |
| scan analysis | secondary | July 30 – August 5 | 1 | N/A | N/A | N/A | 0.02 | N/A |
| Individual | ||||||||
| level | primary | June 30 – July 29 | N/A | 12.1 | 37 | 3.9 | 0.001 | 56.69 |
| spatiotemporal | secondary | July 20 – August 18 | N/A | 10.2 | 31 | 3.7 | 0.001 | 61.74 |
| scan analysis | secondary | July 10 – August 7 | N/A | 8.9 | 26 | 3.6 | 0.001 | 106.69 |
RM — rural municipality.
km = kilometers.
N/A = not applicable.
Figure 2.
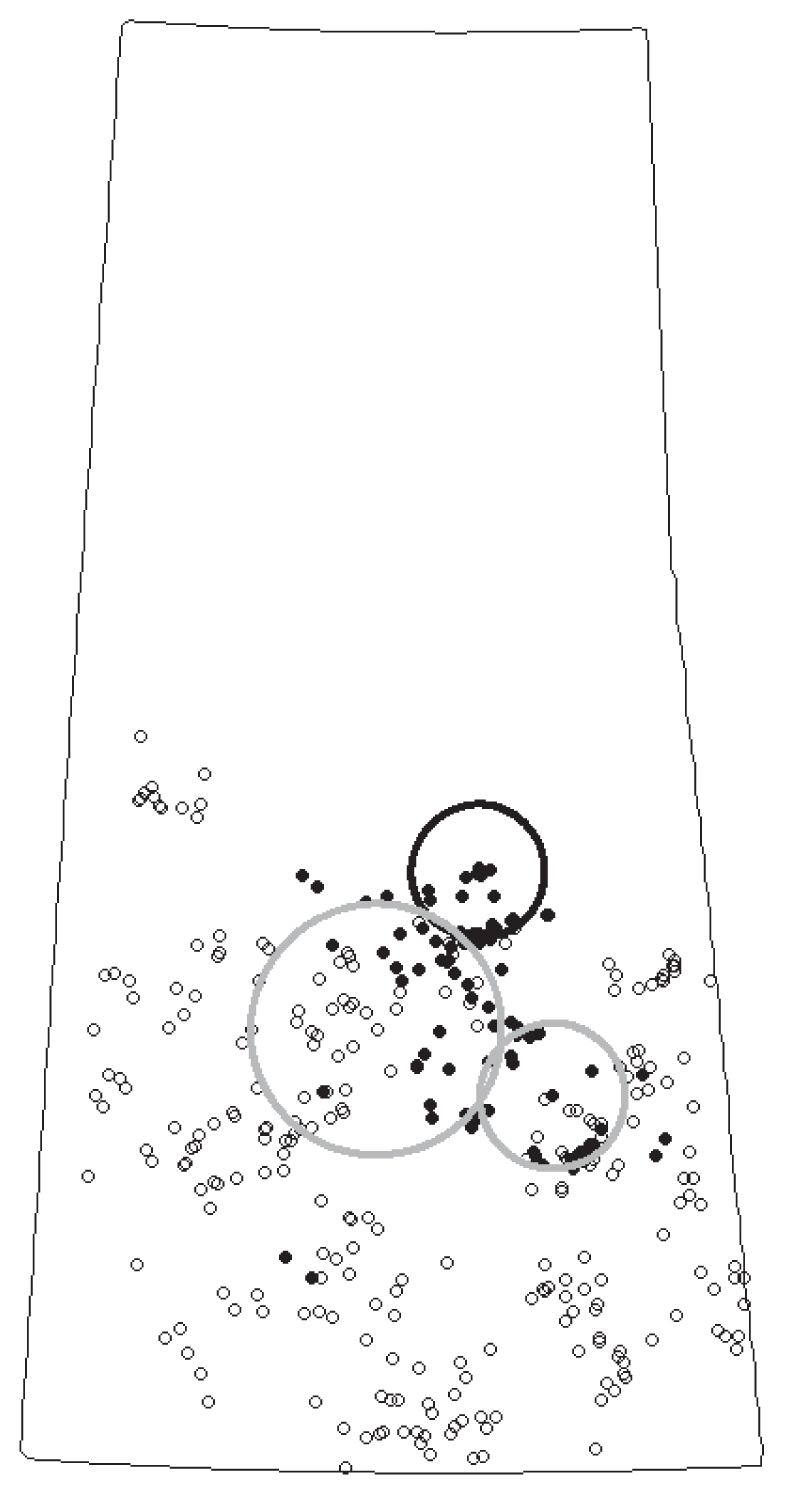
Results of the spatiotemporal SaTScan analysis for individual bovine farms. Case locations are depicted as small closed black circles and control locations depicted as small open black circles. Larger dark-colored circle outline depicts primary cluster and larger light-colored circle outline depicts secondary cluster(s).
The disease map based on the odds estimated from individual farm level data, indicated that the east central portion of Saskatchewan had twice the odds of disease compared with the rest of the province (Figure 3). The exploratory relative risk map based on spatiotemporal background risk showed that the highest relative risk existed in the east-central portion of the province (Figure 4), the area which included the clusters identified by both previous spatiotemporal scan test analyses.
Figure 3.
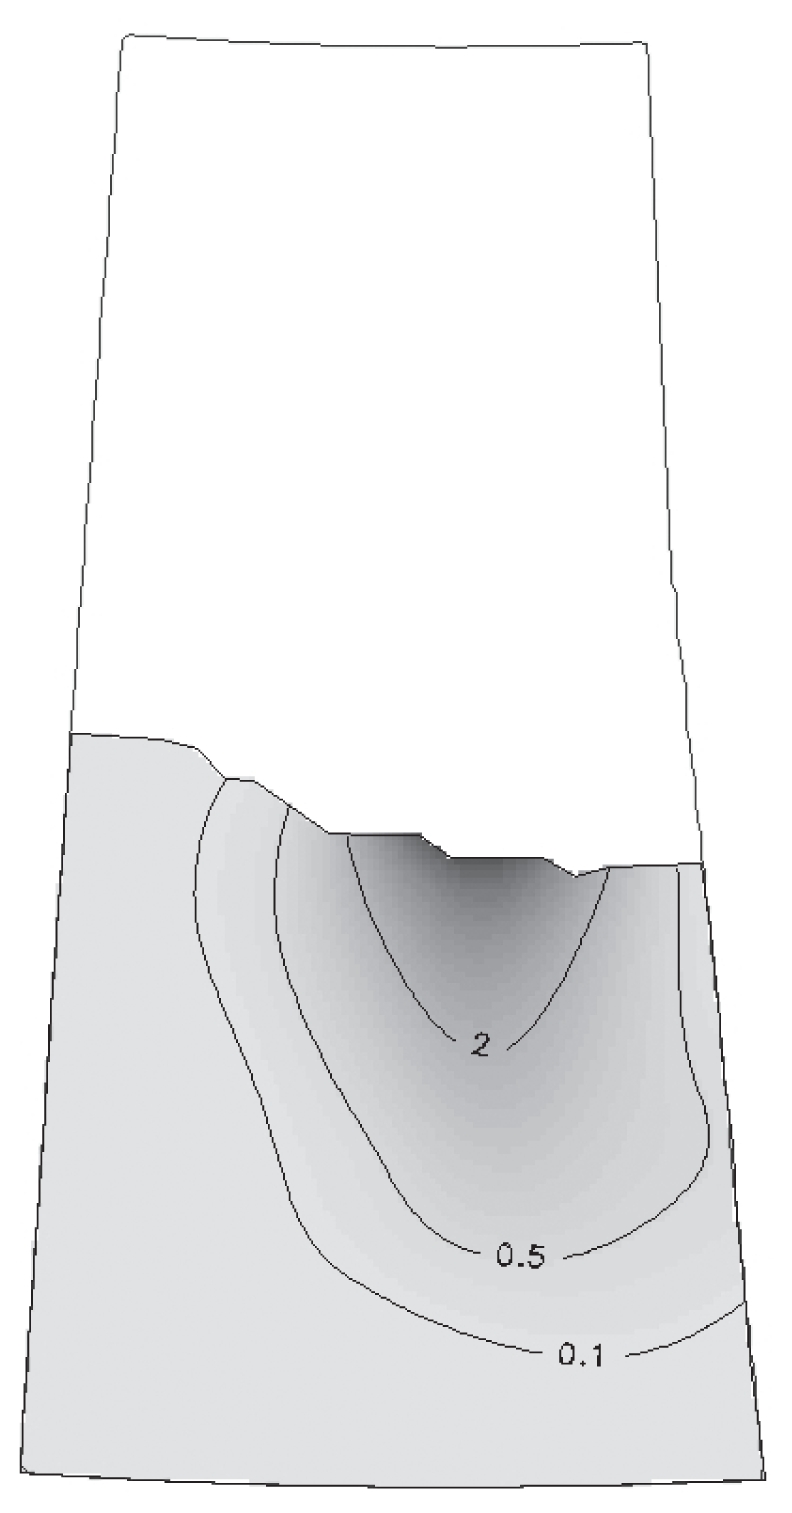
Odds map (kernel density estimation of cases compared to controls). Contour lines indicate zones marked by odds estimates.
Figure 4.
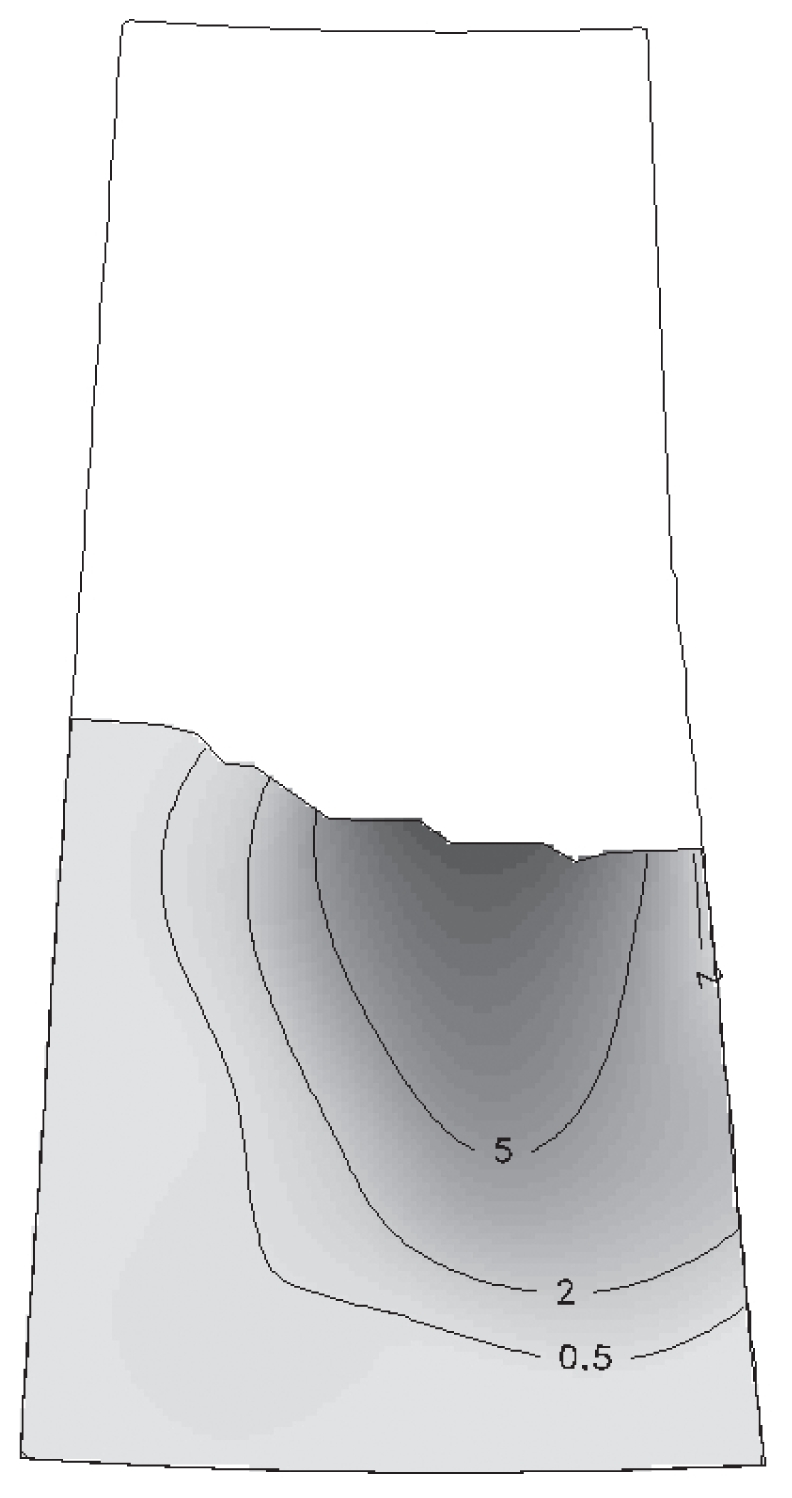
Exploratory relative risk map with background risk determined by spatiotemporal SatScan analysis. Contour lines indicate zones marked by relative risk estimates.
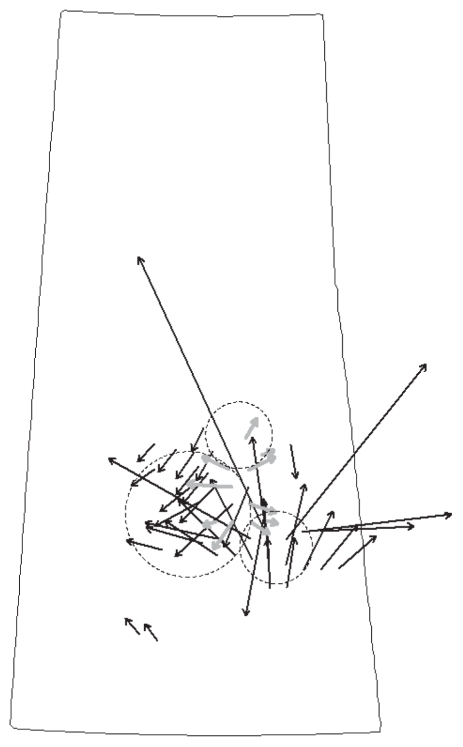
The vector velocity map identified 3 separate movements of spread in the identification of first reported anthrax premises by RM (Figure 5). The magnitude of spread (velocity) was not evaluated because it was deemed to be less reliable due to the inclusion of 2 anthrax locations not involved in the primary cluster of case locations. Each of these corresponded to one of the space-time clusters identified in the scan test. The initial spatial change from week to week was north to south but most of the time the change was east or west from a central area of the outbreak.
Figure 5.
Vector velocity map with arrows depicting direction (arrowhead) and velocity (length) of spatial change for identification of anthrax by RM in Saskatchewan from June 18 to August 26. Included is the location of the relevant spatiotemporal clusters identified by SaTScan.
Discussion
The east-central portion of the province was consistently identified in all analyses as the highest risk area for development of anthrax cases. In 2006, this area was also the location of extreme flooding events followed by hot, dry summer temperatures. Other studies have identified risk factors for anthrax outbreaks which included gleysolic or organic soils, old anthrax grave sites, soil disruptions or flooding, hot, dry temperatures, and heavy precipitation events (8–10,11). An Alberta study detailing a localized 1999 anthrax outbreak identified unusually warm and dry spring conditions followed by a heavy rainfall in July as a key risk factor for development of the outbreak (11). It was speculated that the heavy rainfall may have dispersed the spores through natural drainage patterns providing opportunities for exposure of animals to dormant anthrax spores in the environment through grazing. Anthrax is not spread through direct contact from animal to animal; however, there is speculation that wind, natural water drainage, flies, and other insects may be involved in the spread of anthrax from farm to farm (1,8,11). In our study, the method of spore dispersion could not be definitively determined but based on the spatial analysis results there is mounting evidence of a spatial and temporal pattern to the movement of anthrax that will be explored further.
Based on the database of past reported anthrax outbreaks in Saskatchewan, anthrax cases were previously reported in 3 RMs which lie on the outer fringe of the high risk area for the 2006 outbreak. It is also likely that past cases of anthrax occurred within the high risk region (or outside the high risk area) but were not reported to the CFIA because the affected animals were undiscovered, undiagnosed, or misdiagnosed or the cases occurred prior to the available CFIA records. It is unlikely that such a dramatic outbreak could have occurred historically but gone unreported. However, there were likely cases recorded within this outbreak that might not have been captured if the magnitude of the entire outbreak had not been so large. Contamination of the soil from carcasses of animals that died from anthrax in previous outbreaks could have been the source of exposure for subsequent outbreaks on the same premises. If natural drainage after flooding were to disperse the spores, this could account for the large geographical extent of this outbreak.
Initially, the RM level analysis identified the east central area of Saskatchewan as a cluster of anthrax cases. When the individual farm locations are used, the analysis identified 3 clusters with slightly different time periods. The primary one was located between Prince Albert and Melfort and the secondary clusters were located around Foam Lake and between Saskatoon and Melfort. This could be due to distinct environmental conditions for each cluster but definitely indicates overall favorable conditions for the larger geographic area involved in the outbreak compared with the non-outbreak area. Perhaps these areas experienced different environmental temperatures and precipitation amounts which contributed to the timing of anthrax cases. Perhaps these areas have different capacities for insect populations, thus creating different exposures for animals within the areas.
Temporally, there were 2 periods identified in our analysis of the 2006 outbreak. Mid-June to mid-July cases were also seen in the 1999 domestic animal outbreak in Alberta as well as in an outbreak in free-ranging bison in the North West Territories in 2006 (10,11). The secondary clusters identified in our analysis accounted for the remainder of the cases with risk periods extending from mid-July until mid-August. These time periods are consistent with historical cases of anthrax within Saskatchewan that would have been due to grazing and not winter feeding of contaminated feed. Further clarification of the role of environmental conditions, such as vegetation cover, temperature, and precipitation, is warranted and will be pursued in subsequent analyses.
The identification of cases of anthrax by first report in each RM mirrored the spatiotemporal analysis. Anthrax initially started in the Melfort area, but thereafter moved outward from a more central area of the outbreak. Much speculation exists as to the role of flying insects and wind in the spread of anthrax. The picture of the vector velocity maps suggests a radial outbreak pattern, which supports farm to farm spread by flies or biting insects rather than wind. The results also bring up questions as to whether control measures aimed at creating a perimeter of vaccination around the outbreak could have prevented cases in the later half of the outbreak. In the first 3 wk of the outbreak, only 4 RMs reported cases; the number of RMs reporting their first cases increased dramatically in the 4th and subsequent weeks. This lead time would give officials enough time to implement a vaccination protocol to prevent further cases in the area; particularly if an outbreak of this magnitude could be predicted early in its course. The use of a vaccination zone around infected farms was deemed successful in stemming an outbreak of anthrax in Australia in 1997 (12).
As anthrax is usually a sporadic condition on the prairies, it is likely that there were cases of anthrax missed early on in the outbreak. Mature cattle deaths can be missed on pasture with only a low proportion of those found resulting in subsequent workup or postmortem examination [Waldner C, University of Saskatchewan, personal communication]. Depending on where and when any unidentified anthrax cases might have occurred, the results of the analysis could be misleading. Due to the selection of controls based on cattle census data for 2006, the individual farm location dataset used for most of the analysis was for bovine locations only, which represented 81% of all locations of anthrax cases. Comparison of the RM level and the individual level analysis showed that the conclusions were similar whether or not the analysis was restricted to locations having bovine cases.
This analysis identified an area of high risk for anthrax cases in 2006. It also identified trends and possible theories which need to be further examined; such as whether or not the use of vaccination zones would have been beneficial earlier in this outbreak or if weather events could be used to predict bad years. Further analysis using a case-control study and predictive risk mapping will attempt to identify preventive measures and risk factors for the occurrence of anthrax cases in the identified high risk area. CVJ
Footnotes
Reprints will not be available from the authors.
Use of this article is limited to a single copy for personal study. Anyone interested in obtaining reprints should contact the CVMA office ( hbroughton@cvma-acmv.org) for additional copies or permission to use this material elsewhere.
References
- 1.Dragon DC, Elkin BT, Nishi JS, Ellsworth TR. A review of anthrax in Canada and implications for research on the disease in northern bison. J Appl Micro. 1999;87:208–213. doi: 10.1046/j.1365-2672.1999.00872.x. [DOI] [PubMed] [Google Scholar]
- 2.Himsworth C, Argue C. Cross Canada Disease Report: Anthrax in Saskatchewan 2006: An outbreak review. Can Vet J. 2008;49:235–237. [PMC free article] [PubMed] [Google Scholar]
- 3.Waller LA, Gotway CA. Applied Spatial Statistics for Public Health Data. Hoboken, New Jersey: John Wiley and Sons; 2004. [Google Scholar]
- 4.Carpenter TE. Methods to investigate spatial and temporal clustering in veterinary epidemiology. Prev Vet Med. 2001;48:303–320. doi: 10.1016/s0167-5877(00)00199-9. [DOI] [PubMed] [Google Scholar]
- 5.Berke O, Grosse Beilage E. Spatial relative risk mapping of pseudorabies-seropositive pig herds in an animal dense region. J Vet Med B. 2003;50:322–325. doi: 10.1046/j.1439-0450.2003.00689.x. [DOI] [PubMed] [Google Scholar]
- 6.Berke O. Exploratory disease mapping: Kriging the spatial risk function from regional count data. Int J Health Geo. 2004;3:18. doi: 10.1186/1476-072X-3-18. [DOI] [PMC free article] [PubMed] [Google Scholar]
- 7.Berrang-Ford L, Berke O, Abdelrahman L, Waltner-Toews D, McDermott J. Spatial analysis of sleeping sickness, southeastern Uganda, 1970–2003. Emerg Inf Dis. 2006;12:813–820. doi: 10.3201/eid1205.051284. [DOI] [PMC free article] [PubMed] [Google Scholar]
- 8.Dragon DC, Rennie RP. The ecology of anthrax spores: Tough but not invincible. Can J Vet Res. 1995;36:295–301. [PMC free article] [PubMed] [Google Scholar]
- 9.Gates CC, Elkin BT, Dragon DC. Investigation, control and epizootiology of anthrax in a geographically isolated free-roaming bison population in northern Canada. Can J Vet Res. 1995;59:256–264. [PMC free article] [PubMed] [Google Scholar]
- 10.Nishi JS, Ellsworth TR, Lee N, Dewar D, Elkin BT, Dragon DC. Cross-Canada Disease Report: An outbreak of anthrax (Bacillus anthracis) in free-roaming bison in the Northwest Territories, June–July 2006. Can Vet J. 2007;48:37–38. [PMC free article] [PubMed] [Google Scholar]
- 11.Parkinson B, Rajić A, Jenson C. Investigation of an anthrax outbreak in Alberta in 1999 using a geographic information system. Can Vet J. 1999;44:315–318. [PMC free article] [PubMed] [Google Scholar]
- 12.Turner AJ, Galvin JW, Rubira RJ, Condron RJ, Bradley T. Experiences with vaccination and epidemiological investigations on an anthrax outbreak in Australia in 1997. J Appl Micro. 1999;87:294–297. doi: 10.1046/j.1365-2672.1999.00894.x. [DOI] [PubMed] [Google Scholar]


