

Abstract
Although fundamental cause theory has been highly influential in shaping the research literature on health disparities, there have been few empirical demonstrations of the theory, particularly in dynamic perspective. In this study, we examine how income disparities in cholesterol levels have changed with the emergence of statins, an expensive and potent new drug technology. Using nationally representative data from 1976 to 2004, we find that income gradients for cholesterol were initially positive, but then reversed and became negative in the era of statin use. While the advantaged were previously more likely to have high levels of cholesterol, they are now less likely. We consider our case study against a broader theoretical framework outlining the relationship between technology innovation and health disparities. We find that the influence of technologies on socioeconomic disparities is subject to two important modifiers: (1) the nature of the technological change and (2) the extent of its diffusion and adoption.
While mortality declined in the twentieth century, and causes of death and intervening risk factors shifted dramatically, socioeconomic status (SES) remained persistently associated with age-specific mortality. Some studies show that socioeconomic gradients have, at best, declined modestly (Warren and Hernandez 2007), while others show that gradients have widened (Lynch 2003; Pappas et al. 1993). In a seminal article published over a decade ago, Link and Phelan (1995) argued that social factors such as SES can operate as persistent and “fundamental causes of disease” because they are associated with a wide variety of resources that can be marshaled to improve health in a diverse and changing environment. To date, however, there have only been a few examples of empirical support or tests of the theory, and they have generally focused on whether SES gradients in mortality are stronger for causes of death that are considered more preventable, indirectly assessing the role of resources in procuring potential interventions (Phelan and Link 2005; Phelan et al. 2004).
In this study, we examine how income gradients in cholesterol levels have changed with the emergence of “statins” (or HMG-CoA reductase inhibitors). Though cholesterol was recognized as an important risk factor for cardiovascular disease as early as the 1960s, it was not amenable to effective pharmaceutical manipulation until the introduction of statins in the late 1980s. This innovation offered, for the first time, highly potent drug control of cholesterol. As an expensive new technology that treats an asymptomatic condition, statins may have been disproportionately adopted by those with greater resources, promoting disparities in cholesterol that favor the wealthy. We advance prior work on fundamental cause theory by examining a specific risk factor for mortality rather than mortality itself. As mortality is most often influenced by myriad factors, the finding of variation in mortality gradients offers limited insight into precise mechanisms. Furthermore, we consider the role of a specific intervention (statins), instead of relying on the less specific classification of causes of death as more or less responsive to preventive measures.
We also integrate fundamental cause theory with two related yet distinct theoretical frameworks. First, we consider a well-established literature on the diffusion of innovations. Second, we consider Goldman and Lakdawalla’s (2005) theory of health disparities and medical technology. As in fundamental cause theory, technologies are linked to increased disparities, but Goldman and Lakdawalla offer a distinct theoretical model based on the idea that technological innovation raises the productivity of health care. We also draw from this model to argue that certain technologies can act to contract rather than expand social disparities. Overall, we find that the influence of technologies on socioeconomic disparities is subject to two important modifiers: (1) the nature of the technological change and (2) the extent of its diffusion and adoption.
THEORY AND BACKGROUND
Social Conditions as a Fundamental Cause of Disease
Link and Phelan’s (1995) fundamental cause theory seeks to explain why the association between SES and health persists across time. According to the theory, SES functions as a “fundamental cause of disease” because it (1) involves access to important resources that allow individuals to avoid diseases and their consequences and (2) affects multiple risk factors and disease outcomes that change over time. Basic resources that can be used to one’s health advantage are highly varied and include wealth, knowledge, skills, power, and social connections. Because these resources are general, flexible, and multipurpose in nature, they are adaptable to changing conditions over time. Human health over the past two centuries can be characterized as a highly dynamic system, with significant changes in the most salient and deadly diseases. In the United States, for example, tuberculosis and other infectious diseases were superseded as leading causes of death by chronic diseases, including lung cancer and cardiovascular disease. Intervening risk factors such as sanitation declined in importance while factors such as smoking, blood pressure, and cholesterol gained significance. As some diseases are brought under control, new diseases and causal mechanisms emerge, requiring research to elucidate risk factors and innovations in diagnostic tools and treatments. Those with the most resources are best able to take advantage of these developments because social and economic resources are generally transportable from one situation to another. Hence, no matter what the array of risks and diseases are at any time point, those who are advantaged will tend to fare better, and social disparities in health will persist over the long run.
Despite the wide influence of this theory, there have been few empirical tests or demonstrations. Phelan et al. (2004) showed that SES has a stronger association with causes of death that are more preventable. To the extent that resources are critical to the production of social gradients in morality, gradients should be stronger for outcomes for which we know more about prevention or treatment. Hence, these findings are consistent with a role for resources in the formation of health disparities. The authors are careful to note, however, that their findings reflect an inference rather than a direct test of the theory because they only assess the influence of SES in a single period of time. They argue that a more direct test of the dynamic aspect of the theory would examine how socioeconomic gradients change over time in relation to emerging health information and technology. Elsewhere, Link et al. (1998) have argued that in order to find support for the fundamental cause perspective, it is necessary to show that social gradients change in ways that favor higher SES persons when new risk factors, treatments, and other medical technologies emerge. In this study, we examine cholesterol levels in dynamic perspective, using nationally representative data that capture the period before and after the emergence of a cholesterol-lowering technology. Like the Phelan et al. (2004) study, we consider whether gradients are stronger when a condition is treatable, which similarly lends support to the role of resources. We take the additional step, however, of testing whether the social gradient actually changes when a single condition transitions from being (essentially) untreatable to treatable.
In other work, Phelan and Link (2005) examine changing mortality patterns by race and SES for two types of diseases: (1) those for which our capacity to prevent death has increased and (2) those for which it has not. In a comparison of trend data assembled from various sources, they show that disparities have emerged for the former type of disease (e.g., heart disease mortality), but not for the latter (e.g., ovarian cancer mortality). Glied and Lleras-Muney (2008) also consider the association between technological progress and disparities in mortality, but they offer more robust evidence by explicitly modeling the relationship. They find that education gradients in mortality became steeper among causes of death for which there was greater technological progress. We build on prior work by examining how gradients for a more specific health outcome change in relation to a technology that has a direct and near-immediate effect on the outcome. In contrast, changes in mortality gradients can arise from a wide variety of different inputs and offer less insight into actual or potential mechanisms. Here, we drill the examination down to a specific risk factor, technology, and intervening process linking SES to cardiovascular mortality.
Diffusion of Innovations
As technological developments are a key component of fundamental cause theory, we also consider the more general literature on the diffusion of innovations. Work in the area of health innovations has focused primarily on factors that influence diffusion, identifying a vast array of variables typically relating to attributes of the innovation and aspects of the health care organizational structure. As an innovation, statins have a number of attributes favoring effective diffusion and adoption. Classical diffusion theory considers the following factors: “relative advantage” (e.g., effectiveness relative to alternatives), lack of “complexity” (e.g., simplicity of use), “compatibility” (fit with existing values and practices), “observability” (outcomes can be observed), and “trialability” (users can experiment on a limited basis) (Rogers 2003). Statins possess, to some degree, all of these attributes, and each can be considered from the standpoint of both physician and patient as the adopter. Empirical data suggest that the diffusion of statins has indeed been rapid. While the first statin came on the market in the late 1980s, three statins were in routine clinical use by 1990, and seven were widely prescribed by 2002 (Bellosta, Paoletti, and Corsini 2002). From 1996 to 1999, the use of statins among patients with high cholesterol increased by nearly 400 percent in the United States (Lewin Group 2000).
Relatively less attention has been devoted to social disparities in diffusion despite empirical evidence of disparities for a variety of medical technologies, including new drug use (Boutwell and Mitchell 1993; Link et al. 1998; Lleras-Muney and Lichtenberg 2002). Socioeconomic disparities in technology diffusion could result from differences in a variety of factors including the ability to cover financial costs, the ability to adhere to treatment recommendations, access to higher quality physicians or health care systems, access to specialists, and attitudes toward the benefits of innovations (Glied and Lleras-Muney 2008). While it is important to identify such pathways, it is also useful to redirect our attention to the tenacity of SES as an “upstream” factor affecting diffusion. It is precisely because SES is associated with flexible, multipurpose resources that disparities in diffusion are observed for a variety of different innovations across time. As with the more general literature on health disparities, fundamental cause theory can serve as an important theoretical anchor in the study of technology diffusion.
Medical Technology and Disparities: The Productivity of Health Inputs
Goldman and Lakdawalla (2005) have proposed a theoretical model for the relationship between medical technology and health disparities. As in fundamental cause theory, they argue that the introduction of technologies can lead to increasing disparities. This model, however, can be used to supplement or advance Link and Phelan’s (1995) fundamental cause model in two respects. First, it offers an alternate conceptualization of the link between technology and disparities based on the productivity of health care. Second, it allows for the possibility that technologies can contract rather than increase disparities. Goldman and Lakdawalla begin with the proposition that medical technologies raise the productivity of health care and that such improvements will disproportionately benefit the heaviest users. They then argue that this can exacerbate socioeconomic disparities in health because high status persons are the heaviest health care users, accounting for health status. The advent of statins, for example, raises the productivity of going to the doctor and having one’s cholesterol checked. Here, as in fundamental cause theory, one would expect statins to promote disparities in favor of high SES persons.
Goldman and Lakdawalla’s (2005) model, however, also allows for a technology-induced contraction in disparities. While new technologies can raise the productivity of health care, they can also lower the productivity of other inputs such as patient effort. If high status persons tend to invest more effort, then disparities will decrease as the relative advantage conferred by this investment is diminished. Pharmacological treatment of hypertension, for example, is much simpler than lifestyle changes and reduces requirements for patient effort. Rather than exercising more, quitting smoking, changing one’s diet, and trying to lose weight, patients simply take a pill. Goldman and Lakdawalla find empirical support for this hypothesis, showing that the introduction of beta-blockers to treat hypertension coincided with a contraction of education disparities in hypertensive heart disease. Here, the technology appears to have functioned as a countervailing mechanism, working against disparities (Lutfey and Freese 2005). In contrast to beta-blockers, highly active antiretroviral therapy (HAART) for HIV can be quite complex, involving three or more different drugs and a large number of pills taken in a specific sequence. Compliance with this treatment is demanding, requiring substantial investments of patient time, effort, and skill. In this case, Goldman and Lakdawalla show that educational disparities in immune function among HIV patients expanded following the introduction of HAART, suggesting that this innovation was of greater benefit to high SES patients.
Hence, the effect of a medical innovation on social disparities may depend on whether it changes the productivity of patient effort. In fact, we can extend Goldman and Lakdawalla’s (2005) model by noting that this process is not limited to changes in the relative value of patient effort. Technologies could also contract disparities by changing the productivity of other types of resource-related inputs. The introduction of a vaccine, for example, could offer a low-cost route to preventing a disease, thereby decreasing the productivity of access to expensive treatments for the disease and potentially contracting gradients in disease-related mortality. In contrast, fundamental cause theory tends to focus solely on how resources facilitate access to technologies, conferring health advantages to those with more resources. Taking the above considerations into account, we can amend fundamental cause theory to note that technologies can also lessen the value of certain SES-associated resources, conferring a relative gain to lower status persons and reducing disparities. Like beta-blockers, statins are also much more effective than lifestyle changes and thereby have the potential to reduce the impact of patient effort. They are also much simpler to take than HAART. Following this line of thinking, statins may have disproportionately helped lower-income persons, contracting health disparities or shifting advantage away from higher-SES persons.
Statins: Innovation in Drug Therapy for Cholesterol
Despite earlier knowledge of the adverse effects of high cholesterol, research on cholesterol-lowering drugs reached a plateau in the 1970s. Existing drugs were either poorly tolerated or minimally effective, and drug therapy was used sparingly (Lewin Group 2000; NCEP 2002). In the late 1980s, however, the introduction of statins offered, for the first time, pharmaceutical therapy that was highly effective and relatively free of short-term side effects. Statins are far more powerful than prior cholesterol-lowering drugs and, of particular importance, are highly effective in lowering low density lipoprotein (LDL), the fraction of total cholesterol that is most closely associated with heart disease and the principal target of treatment guidelines (NCEP 2002). Statins can achieve reductions of up to 50 percent or more in LDL (Jones et al. 1998), but they are expensive. Simvastatin (brand name “Zocor”) is one of the most effective and frequently prescribed statins, and its cost was over $120 a month in 2003 for a starting dose of 20 milligrams per day (The Medical Letter 2003). In addition to being costly, statin use requires access to lab services and physicians who prioritize prevention, adhering to guidelines for cholesterol screening and treatment. It also requires resources such as patient willingness and ability to fast overnight and present for a scheduled blood draw. Blood analysis is essential for diagnosis, drug titration, and monitoring side effects.
Overarching Secular Trends in Cholesterol: Diet versus Drugs
Cholesterol levels have been falling since the 1970s, if not earlier. Population estimates show that mean total cholesterol (mg/dL) was 222 in 1960–1962, declined to 215 by 1976–1980, and further declined to 203 by 1999–2002 (Carroll et al. 2005). As drug therapy prior to statins was minimally effective and poorly tolerated by patients, it is likely that the earlier changes in cholesterol were predominately the result of dietary changes. The American diet did change over this period: data from 1977 to 1990 show that, for men, average daily cholesterol intake decreased by 22 percent for men and 36 percent for women (Ippolito and Mathios 1996). These changes were no doubt influenced by a steady accumulation of research demonstrating links between diet and health, and the growth of public health campaigns targeting cardiovascular disease.
Unlike the period from the 1960s through the 1980s, progress during the past 20 years may be attributable, for the most part, to drug therapy (with statins). Carroll et al. (2005) show that in the period between 1988–1994 and 1999–2002, dietary saturated fat and cholesterol did not change much, while the use of lipid-lowering medications increased markedly, especially among older age groups. Mean saturated fat intake as a percentage of total calories decreased by less than one percentage point in both men and women. For cholesterol, mean intake decreased by only 2 percent in men, and actually increased by 5 percent in women. In contrast, the proportion of lipid-lowering medications nearly tripled in this period. Among those 60 and over, it increased from 7 percent to 24 percent in men and from 9 percent to 22 percent in women. Therefore, Carroll et al. argue that decreases in cholesterol levels over this time interval have likely been influenced more by medication use than lifestyle changes. Dietary changes, though, have probably continued to play some role and, to the extent they vary by SES, may also contribute to changing disparities.
Socioeconomic Disparities in Cholesterol
Though data are quite limited, some studies suggest that higher SES groups once consumed relatively larger amounts of fat and high-cholesterol foods (e.g., red meat, cream, butter, and eggs) (Ippolito and Mathios 1996; Marmot et al. 1978a). Hence, it may be the case that those who were better off used to have richer diets both because they could afford them and because meat and dairy products were considered very healthful. In the first half of the twentieth century, serious malnutrition from diets lacking these foods (e.g., pellagra) was still a major health problem. There are some data suggesting that social gradients in cholesterol were positive (e.g., cholesterol level increasing with SES) in the 1960s and 1970s (Blane et al. 1996; Marmot et al. 1978b). In contrast, more recent data suggest that cholesterol may be inversely associated with SES (Iribarren et al. 1997; Kushi et al. 1988). While statins have largely been celebrated as a key agent in our continued progress against cardiovascular disease, little is known about how social disparities may have changed as statins were introduced and disseminated. Prior studies examining disparities at a single point in time do not permit an assessment of whether a given pattern is stable or part of a dynamic process.
In this article, we examine income disparities in cholesterol levels over the last three decades in the United States, using consistently collected and nationally representative data from a single source to examine gradients before and after the introduction of statins. We expect income gradients to be positive (higher cholesterol with higher income) in the period preceding the advent of statins. According to fundamental cause theory (Link and Phelan 1995), the introduction of new technologies creates a health advantage for those who have better resources because they have a greater ability to access or incorporate new developments. Assuming that gradients were once positive, this suggests that gradients might have flattened initially and eventually become negative (lower cholesterol with higher income) over time. Following Goldman and Lakdawalla’s (2005) model, a similar pattern would be expected if statins have increased the productivity of medical care and disproportionately benefitted high-income persons as its heaviest users. If, however, statins have diffused widely to people at all incomes, then income gradients may be relatively flat in the current period. Even if higher-income persons were more likely to have engaged in lifestyle changes over this period, the relative advantage conferred by this effort would be superseded by the diffusion of drug therapy to persons at all incomes.
METHODS
Data
We use three successive “waves” of the National Health and Nutrition Examination Survey (NHANES): II (1976–1980), III (1988–1994), and Continuous (1999–2004). The NHANES waves are designed to provide nationally representative, cross-sectional estimates at successive points in time, and they provide data from in-person interviews as well as laboratory exams.
Variables
Our outcomes of interest are total cholesterol levels and fasting low density lipoprotein (LDL) levels. Low density lipoprotein is the portion of total cholesterol that is most directly targeted by statin therapy, and it is most appropriately assessed after fasting because food can lead to a transient elevation in results. In analyses of total cholesterol, we restrict our sample to adults aged 20 and over who were not pregnant and who participated in the clinical exam component of the study. In analyses of fasting LDL, we additionally restrict our sample to those who had fasted for an appropriate amount of time prior to having their blood drawn.
We use the poverty income ratio (PIR) to measure income status. The poverty income ratio is calculated by the NHANES and is the ratio of a family’s income to its appropriate poverty threshold given family size and composition. In contrast to the household income data in the NHANES, the PIR is a continuous rather than interval measure, adjusts for household characteristics, and accounts for inflation both between waves and across years within the same wave. The poverty income ratio is top-coded at different values in the three survey waves, so we top-code this variable at 5.0 (that is, five times the poverty threshold) to create consistency across waves. We focus on income rather than education as an indicator of SES because educational categories have shifted substantially in meaning and value during this period. For example, the proportion with education beyond high school has increased from 33 percent in 1976–1980 to 54 percent in 1999–2004, changing the social and economic salience of graduating from high school. In addition, there is a limitation to the education data in the NHANES: “More than high school” is the highest category provided in the 1999–2004 data. This is not an adequately detailed categorization to address our study questions, as over half the population currently falls into this top category. We do, however, conduct sensitivity tests adjusting all models for education (see below).
Survey year is based on the midpoint for each wave of the NHANES, with the earliest wave (1976–1980) coded as 0. A change of one unit in the survey year variable is coded to represent ten years. As the midpoints of the first (1978) and second (1991) waves are separated by 13 years, the second wave (1988–1994) is coded as 1.30. In similar fashion, the third wave (1999–2004) is coded as 2.35. Modeling time as a categorical variable instead (i.e., with an indicator for each wave) did not change our findings in any substantive fashion. Covariates include age, sex, race-ethnicity, and measured body mass index (BMI: weight [kg] divided by height [m2]). Age (measured in years) is modeled as a continuous variable and includes a squared term, as preliminary analyses revealed a curvilinear relationship with cholesterol. Race-ethnicity categories include: non-Hispanic white, non-Hispanic black, Mexican American, and other race. For NHANES II, we define non-Hispanic white or black as persons who are coded as white or black for race but do not have any of several Hispanic ancestry codes. For later waves, the NHANES provides a combined race-ethnicity code. Due to differences in the assessment of ethnicity in NHANES II relative to later waves, and because Mexican Americans were not oversampled until after this wave, we do not include a Mexican American category for NHANES II. Our primary findings were robust, however, to sensitivity analyses where all persons in NHANES II with “Mexican” ancestry codes are coded as Mexican American rather than other race.
Principal Analyses
We use multivariate linear regression to assess the influence of income on lipid levels over time. Cholesterol (or LDL) is modeled as the dependent variable, and income, survey year, and other covariates are included as predictor variables. To formally test our hypothesis that income disparities have changed over time, we include an interaction term between income and survey year. If, for example, income gradients have changed to the advantage of higher-income persons over the course of this 30-year period, the coefficient for the interaction term will be negative and significant. As statins are predominately indicated and prescribed in the setting of high lipid values, we additionally consider high cholesterol (≥240 mg/dL) and high LDL (≥160 mg/dL) as dichotomous outcomes and model them using logistic regression. Cut-points are based on nationally accepted clinical classifications (NCEP 2002). We also conduct sensitivity tests where we adjust all of our models for education as well as an interaction between education and survey year. Here, we use the three education categories consistently available for all years: “less than high school,” “high school,” and “more than high school.”
Analyses throughout are conducted in STA-TA 9.2, incorporate survey sampling weights, and account for the design structure of the NHANES. Final examined sample weights are used in analyses of total cholesterol, and fasting sample weights are used in analyses of fasting LDL. These weights allow for unbiased national estimates when analyzing the subsamples with data on each outcome. Analyses are stratified by sex as overall trends in serum lipids are well known to vary by sex (Carroll et al. 2005).
Supplementary Analyses
Although the NHANES include medication data, we do not consider adjustments for statin use in our models because statin use is endogenous to the outcome. While statin use predicts lipid levels, lipid levels also predict statin use since only those with high levels are eligible to receive statins. We do, however, consider two types of supplementary analyses. First, we examine the relationship between income and statin use in analyses where statin use itself is modeled as an outcome. Here, we use data from the last two waves of the NHANES (when statins were available), and we condition on clinical eligibility by restricting the sample to those who are either on statins or have an LDL level ≥160 mg/dL (recommended clinical threshold for treatment). We use logistic regression to model statin use as a function of income adjusting for age, race, BMI, and survey year. This portion of the analyses can be thought of as a synthetic case-control study where the “cases” are statin users and the “controls” are nonusers who were nonetheless at risk for statin use based on measured LDL level. Second, we rerun our main model for high LDL, but simulate the absence of statins by assigning all persons on statins to the high LDL category. We then compare the estimated interaction between income and survey year from this model with the estimate from the original model. If statins have played a major role in the changing income gradient, then the interaction term should be attenuated in this second model. However, if statins have not played much of a role, then the interaction term should be very similar between the two models. Both of these supplementary analyses are subject to an important limitation. Some persons may have been started on statins at thresholds under 160 mg/dL. Furthermore, it is difficult to infer the direction of potential bias. On the one hand, this group may tend to be higher-income persons with more resources and better access to care. On the other hand, this group may tend to be lower-income persons who had lower clinical thresholds for starting statins because of higher-risk profiles (e.g., from additional health problems). Hence, we consider these analyses to be exploratory in nature, and results should be interpreted bearing this limitation in mind.
RESULTS
Sample characteristics for each of the three survey waves are given in Table 1. For both women and men, average levels for total cholesterol and LDL show considerable declines in the period from NHANES II (1976–1980) to the most recent data (1999–2004). With respect to clinically salient cut-points, the prevalence of high cholesterol decreased from 28 percent to 17 percent among women, and from 25 percent to 17 percent among men. Similarly, the prevalence of high LDL decreased from 25 percent to 12 percent among women, and from 26 percent to 14 percent among men. Average PIR increased slightly and the interquartile range broadened, consistent with increasing income disparities in the 1980s. Average BMI also increased over time.
TABLE 1.
Sample Characteristics
| Mean (Inter-quartile Range) or Frequency (%) | ||||
|---|---|---|---|---|
| NHANES II (1976–1980) | ||||
| Variable | Women (N = 5,916) | Men (N = 5,394) | ||
| Total Cholesterol (mg/dL) | 214.7 | (179–245) | 211.2 | (179–239) |
| Fasting LDL (mg/dL) | 133.5 | (104–159) | 135.6 | (107–161) |
| High Total Cholesterol (%) | 28.1 | 24.9 | ||
| High Fasting LDL (%) | 24.5 | 25.6 | ||
| Poverty Income Ratio (PIR) | 2.5 | (1.5–3.4) | 2.8 | (1.8–3.8) |
| Age | 42.8 | (29–56) | 41.9 | (28–54) |
| Race-Ethnicity (%) | ||||
| Non-Hispanic White | 82.9 | 84.2 | ||
| Non-Hispanic Black | 10.5 | 9.2 | ||
| Mexican-American | — | — | ||
| Other Race | 6.6 | 6.6 | ||
| BMI | 25.2 | (21.2–27.8) | 25.5 | (22.7–27.7) |
|
NHANES III (1988–1994) | ||||
|---|---|---|---|---|
| Variable | Women (N = 7,415) | Men (N = 6,863) | ||
| Total Cholesterol (mg/dL) | 205.4 | (174–233) | 202.1 | (173–228) |
| Fasting LDL (mg/dL) | 124.5 | (98–147) | 130.1 | (105–152) |
| High Total Cholesterol (%) | 20.7 | 17.7 | ||
| High Fasting LDL (%) | 15.8 | 18.8 | ||
| Poverty Income Ratio (PIR) | 2.8 | (1.5–4.0) | 3.0 | (1.7–4.4) |
| Age | 45.6 | (31–58) | 43.6 | (30–55) |
| Race-Ethnicity (%) | ||||
| Non-Hispanic White | 77.5 | 78.1 | ||
| Non-Hispanic Black | 10.7 | 9.4 | ||
| Mexican-American | 4.3 | 5.3 | ||
| Other Race | 7.5 | 7.3 | ||
| BMI | 26.5 | (21.9–29.9) | 26.6 | (23.5–29.0) |
|
NHANES 1999–2004 | ||||
|---|---|---|---|---|
| Variable | Women (N = 5,469) | Men (N = 5,678) | ||
| Total Cholesterol (mg/dL) | 202.9 | (175–228) | 201.9 | (174–226) |
| Fasting LDL (mg/dL) | 119.0 | (95–141) | 123.0 | (99–144) |
| High Total Cholesterol (%) | 17.1 | 16.7 | ||
| High Fasting LDL (%) | 12.3 | 13.8 | ||
| Poverty Income Ratio (PIR) | 2.9 | (1.4–4.7) | 3.1 | (1.7–5.0) |
| Age | 47.1 | (34–59) | 45.0 | (32–55) |
| Race-Ethnicity (%) | ||||
| Non-Hispanic White | 73.3 | 73.3 | ||
| Non-Hispanic Black | 10.9 | 9.6 | ||
| Mexican-American | 6.4 | 7.9 | ||
| Other Race | 9.5 | 9.2 | ||
| BMI | 28.2 | (23.1–31.9) | 28.0 | (24.4–30.6) |
Notes: Data reflect survey sampling weights. Sample sizes are smaller for data on fasting LDL–NHANES II: 2,388 women, 2,170 men; NHANES III: 3,172 women, 2,848 men; NHANES 1999–2004: 2,412 women, 2,474 men.
Principal Models
Table 2 displays the results of linear regression models for cholesterol and LDL. Our coding of the survey year variable allows us to interpret the coefficient of PIR even though there is an interaction term between PIR and survey year in the model. The coefficient for PIR represents its effect on the outcome variable in the baseline survey wave (1976–1980), since this wave is coded as zero. Among women and men, the association between PIR and lipid levels is positive for both cholesterol and LDL in the first wave. Higher-income levels are associated with higher lipid levels. While the coefficient is positive for both men and women, the association is stronger and statistically significant for men. For both sexes and both outcomes, however, the interaction term between PIR and survey year is negative and statistically significant, indicating significant change over time. For example, in the case of LDL, the effect of a one unit change in PIR is estimated to decrease by 1.059 units every ten years in women, and by 1.089 units every ten years in men. In fact, the gradients reverse in direction: initially positive gradients decline over time and become negative. Thus, despite a positive association in the earliest wave, the association between PIR and lipid levels in the most recent wave (1999–2004) is negative for both sexes and both outcomes. For cholesterol, the estimated coefficient for PIR in the final wave is −.813 (p = .034) among women and −.738 (p = .060) among men (values are calculated and shown in the last row of the table). For fasting LDL, the estimated coefficient for PIR in the final wave is −1.504 (p = .003) among women and −.849 (p = .085) among men. Though not all estimates are statistically significant, blacks and Mexican American women have lower lipid levels relative to whites, and Mexican American men have higher levels. Finally, average lipid levels increase with age and BMI, which is consistent with expectations.
TABLE 2.
OLS Regression Models for Cholesterol and LDL
| Total Cholesterol | ||||
|---|---|---|---|---|
| Women (N = 18,000) |
Men (N = 17,935) |
|||
| Variable | β | (SE) | β | (SE) |
| PIR (in first wave:1976–1980)a | .723 | (.537) | 1.661*** | (.379) |
| Year (10-year increments) | −5.812*** | (1.010) | −2.809** | (.923) |
| PIR × Year | −.653* | (.299) | −1.021*** | (.243) |
| Age | 2.918*** | (.131) | 3.953*** | (.128) |
| Age2 | −.019*** | (.001) | −.035*** | (.001) |
| Race | ||||
| Non-Hispanic Black | −4.208*** | (1.111) | −2.435 | (1.306) |
| Mexican-American | −3.525** | (1.170) | 2.566* | (1.107) |
| Other Race | −3.636** | (1.349) | 4.277* | (2.090) |
| Non-Hispanic White | — | — | — | — |
| BMI | .616*** | (.070) | .810*** | (.092) |
| Constant | 110.638** | (3.629) | 89.672*** | (3.526) |
| PIR (in last wave:1999–2004) | −.813* | (.379) | −.738 | (.389) |
|
Fasting LDL | ||||
| Women (N = 7,972) |
Men (N = 7,492) |
|||
| Variable | β | (SE) | β | (SE) |
| PIR (in first wave:1976–1980)a | .984 | (.710) | 1.712* | (.711) |
| Year (10-year increments) | −5.387*** | (1.307) | −3.304* | (1.320) |
| PIR × Year | −1.059** | (.390) | −1.089** | (.379) |
| Age | 2.146*** | (.187) | 3.033*** | (.157) |
| Age2 | −.015*** | (.002) | −.028*** | (.002) |
| Race | ||||
| Non-Hispanic Black | −3.544* | (1.486) | −4.155** | (1.402) |
| Mexican-American | −4.008** | (1.504) | .570 | (1.543) |
| Other Race | −2.749 | (1.869) | .262 | (2.029) |
| Non-Hispanic White | — | — | — | — |
| BMI | .707*** | (.097) | .435*** | (.112) |
| Constant | 52.377*** | (4.743) | 49.051*** | (4.925) |
| PIR (in last wave:1999–2004) | −1.504** | (.500) | −.849 | (.488) |
p < .05;
p < .01;
p < .001
PIR = poverty income ratio and β = change in cholesterol estimated for a one-unit increase in PIR
PIR = poverty income ratio and β = change in LDL estimated for a one-unit increase in PIR
Figure 1 graphs the estimated income gradients for cholesterol and LDL in the first and last waves. Gradients change from positive to negative for both sexes and each outcome. Additionally, the figures highlight the fact that those at the upper end of the income scale have experienced a much larger decline in lipid levels than those at the lower end. For example, among men, LDL decreased by 20.6 units over this period for high-income persons (PIR = 5), but by only 10.3 units for those at the poverty level (PIR = 1). Hence, the decline experienced by the wealthy was double that experienced by the poor.
Figure 1.
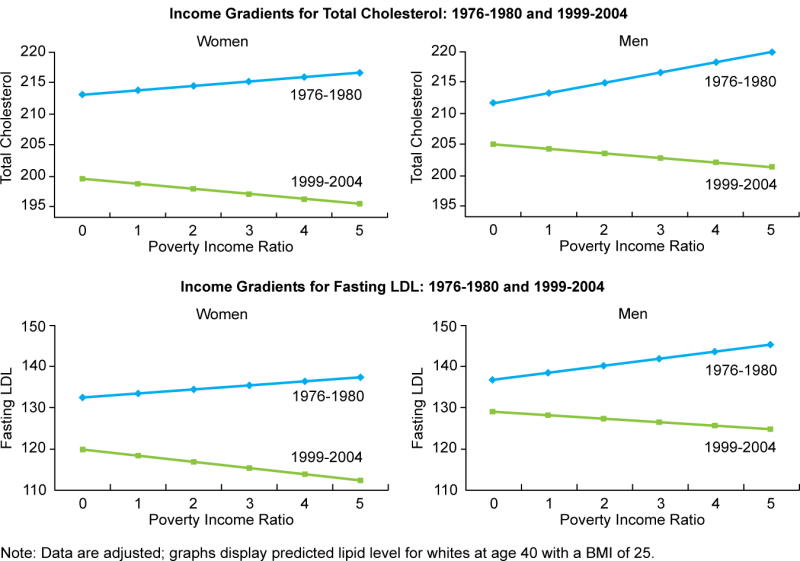
Table 3 displays the results of logistic regression models for high cholesterol (≥ 240 mg/dL) and high LDL (≥ 160 mg/dL). Results are similar to those found for the continuous versions of these variables. The estimated coefficient for the interaction term between income and survey year is again significantly negative for both sexes and both outcomes, and income gradients again shift from positive to negative over the 30-year period. For women in the last wave (1999–2004), each one unit increase in PIR is associated with a 10 percent decline in the odds of having high cholesterol (OR = .904, p < .001) and a 14 percent decline in the odds of having high LDL (OR = .864, p < .001) (values are calculated and shown in the last row of each table). Hence, compared to a woman with a PIR of 1, a woman with a PIR of 5 has .67 times lower odds of having high cholesterol (relative risk [RR] = .70), and .56 times lower odds of having a high LDL level (RR = .59).1 For men, the estimated odds ratios for each unit increase in PIR in the last wave are .926 (p = .007) for high cholesterol and .900 (p = .016) for high LDL. Compared to a man with a PIR of 1, a man with a PIR of 5 has .73 lower odds of having high cholesterol (RR = .77) and .66 lower odds of having a high LDL level (RR = .70).
TABLE 3.
Logistic Regression Models for High Cholesterol and High LDL
| High Total Cholesterol (≥240 mg/dL) | ||||
|---|---|---|---|---|
| Women (N= 18,000) |
Men (N= 17,935) |
|||
| Variable | OR | [95% CI] | OR | [95% CI] |
| PIR (in first wave:1976–80)a | 1.051 | [.992–1.115] | 1.080** | [1.029–1.133] |
| Year (10-year increments) | .801*** | [.712–.901] | .912 | [.813–1.023] |
| PIR × Year | .938** | [.903–.974] | .937*** | [.906–.968] |
| Age | 1.189*** | [1.163–1.217] | 1.201*** | [1.179–1.224] |
| Age2 | .999*** | [.999–.999] | .998*** | [.998–.999] |
| Race | ||||
| Non-Hispanic Black | .774*** | [.673–.891] | .860 | [.728–1.016] |
| Mexican-American | .653*** | [.544–.782] | .989 | [.860–1.137] |
| Other Race | .817* | [.689–.969] | 1.253* | [1.005–1.562] |
| Non-Hispanic White | — | — | — | — |
| BMI | 1.027*** | [1.019–1.035] | 1.031*** | [1.021–1.040] |
| PIR (in last wave:1999–04) | .904*** | [.855–.955] | .926** | [.875–.979] |
|
High Fasting LDL (≥160 mg/dL) | ||||
| Women (N= 7,972) |
Men (N= 7,492) |
|||
| Variable | OR | [95% CI] | OR | [95% CI] |
| PIR (in first wave:1976–80)a | 1.022 | [.930–1.124] | 1.108* | [1.012–1.212] |
| Year (10-year increments) | .769** | [.651–.907] | .901 | [.751–1.079] |
| PIR × Year | .931* | [.879–.986] | .915** | [.866–.968] |
| Age | 1.154*** | [1.116–1.193] | 1.190*** | [1.158–1.224] |
| Age2 | .999*** | [.999–.999] | .998*** | [.998–.999] |
| Race | ||||
| Non-Hispanic Black | .915 | [.735–1.138] | .852 | [.680–1.066] |
| Mexican-American | .631** | [.467–.853] | 1.007 | [.797–1.272] |
| Other Race | .901 | [.667–1.219] | .951 | [.694–1.301] |
| Non-Hispanic White | — | — | — | — |
| BMI | 1.026*** | [1.013–1.040] | 1.011 | [.994–1.027] |
| PIR (in last wave:1999–04) | .864*** | [.797–.936] | .900* | [.827–.980] |
p < .05;
p < .01;
p < .001
PIR = poverty income ratio and OR = change in odds estimated for a one-unit increase in PIR
Sensitivity analyses where models from Tables 2 and 3 adjust for education as well as an interaction between education and survey year did not change our results for income in any substantive or meaningful fashion. Interaction terms between income and survey year remained statistically significant in seven out of the eight models, and coefficients were highly similar in magnitude. Estimates for income gradients in the first and last waves were also very similar in magnitude, and conclusions with respect to statistical significance were the same except that two of the estimates went from nonsignificant to significant. These analyses suggest that the findings for income are not simply driven by a correlation between income and education. With respect to the estimates for education itself, no consistent pattern was observed across these sensitivity models. Most of the coefficients for education in the first and last waves were nonsignificant, as were the interaction terms between education and survey year. It is possible that the education variables we use are simply too crude to capture a social gradient.
Supplementary Models
We conducted two exploratory supplementary analyses. First, we predict statin use among those who are clinically eligible in a synthetic case-control study. Here, we find that income is positively associated with being on a statin, adjusting for covariates. Each unit increase in PIR increases the odds of statin use by 15 percent among women (OR = 1.146, p = .032) and 14 percent among men (OR = 1.141, p = .045). Thus, for example, those with a PIR of 5 have approximately 70 percent greater odds of being on a statin than those with a PIR of 1, accounting for clinical need. Second, we reran the models for high LDL with all persons on statins assigned to the high LDL category to simulate the absence of statins and explore how income gradients might have changed over time under this scenario (Table 4). Relative to the original model (Table 3), the interaction term between income and year is attenuated and becomes nonsignificant among men, with the OR changing from .915 (p = .002) in the original model to .961 (p = .104) in the second model. Additionally, the inverse income gradient in the last wave is attenuated and loses significance among men, with the OR for PIR changing from .900 (p = .016) to .971 (p = .331). Among women, the OR for the interaction term also loses significance, changing from .931 (p = .014) to .962 (p = .191). The OR for PIR in the last wave is attenuated but remains significant among women, changing from .864 (p < .001) to .908 (p = .016). These changes are consistent with the notion that statin use has played a role in the reversal of income gradients observed in the main models. As previously discussed, however, we consider these analyses to be exploratory because the findings are limited by the fact that we cannot directly infer what LDL levels would have been in the absence of statins (for those who are on statins).
TABLE 4.
Logistic Regression Model for High LDL (As Defined by LDL ≥ 160 or Being on a Statin)
| Women (N = 7,972) |
Men (N = 7,492) |
|||
|---|---|---|---|---|
| Variable | OR | [95% CI] | OR | [95% CI] |
| PIR (in first wave:1976–80)a | .995 | [.903–1.096] | 1.068 | [.975–1.169] |
| Year (10-year increments) | .917 | [.769–1.093] | 1.039 | [.879–1.227] |
| PIR × Year | .962 | [.907–1.020] | .961 | [.915–1.008] |
| Age | 1.166*** | [1.127–1.207] | 1.181*** | [1.153–1.209] |
| Age2 | .999*** | [.999–.999] | .999*** | [.998–.999] |
| Race | ||||
| Non-Hispanic Black | .801* | [.650–.987] | .772* | [.622–.958] |
| Mexican-American | .599*** | [.454–.789] | .822 | [.665–1.016] |
| Other Race | .947 | [.710–1.265] | .906 | [.670–1.226] |
| Non-Hispanic White | — | — | — | — |
| BMI | 1.026*** | [1.014–1.038] | 1.024** | [1.007–1.041] |
| PIR (in last wave:1999–04) | .908* | [.840–.982] | .971 | [.916–1.030] |
p < .05;
p < .01;
p < .001
PIR = poverty income ratio and OR = change in odds estimated for a one-unit increase in PIR
DISCUSSION
Though cardiovascular disease remains a leading cause of death in postindustrial nations such as the United States, the past few decades have witnessed tremendous progress in the reduction of cardiovascular mortality (Miniño et al. 2007). This improvement is widely applauded in the medical community and beyond, and is frequently used as an exemplar for successful returns on investments in medical research and technology (Murphy and Topel 2003). For example, in the National Institutes of Health Budget Requests presented to Congress, advances in the treatment and prevention of heart disease have figured prominently as examples of the success of federally-funded research (NIH 2007). About one-third of the reduction in cardiovascular mortality is estimated to result from pharmaceutical innovation (e.g., drugs to lower blood pressure and cholesterol) (Cutler and Kadiyala 2003). While statins have largely been welcomed as a key contributor to our progress against cardiovascular mortality, little attention is devoted to the question of the diffusion of statin use and how statins may have disproportionately benefitted those with greater resources.
We find that income disparities in cholesterol levels have undergone dramatic changes since the introduction of statins. Income gradients were positive in an era prior to statins, but became negative in the period subsequent to the advent and dissemination of statins. While the more advantaged were once more likely to have high levels of cholesterol and LDL, they are now definitively less likely. Additionally, exploratory analyses suggest that income is positively associated with statin use accounting for clinical need. While statins hold great promise for improving cardiovascular health, it appears that they may have contributed to expanding social disparities in cardiovascular risk.
While fundamental cause theory (Link and Phelan 1995) has been highly influential in shaping the health disparities literature, there has been little empirical validation of the theory to date, particularly in dynamic perspective. Prior studies have shown changes in mortality gradients for diseases that have experienced progress in prevention or treatment (Phelan and Link 2005; Glied and Lleras-Muney 2008), but did not relate such changes to specific disease mechanisms and the timing of new interventions. We extend this work by showing how gradients for a specific risk factor change over time in relation to the arrival of a resource-related technology specifically targeting that risk factor. Furthermore, to our knowledge no prior work has demonstrated a “flip” in social gradients relative to the emergence of a technological innovation.
On the issue of health disparities and technology per se, the fundamental cause model (Link and Phelan 1995) tends to focus on the connection between resources and access to technologies, while Goldman and Lakdawalla’s (2005) model takes a different approach, focusing on the role of technology in raising the productivity of health care. Goldman and Lakdawalla argue that increases in the productivity of health care will disproportionately benefit the heaviest users, who are presumably higher SES persons. In our example, we can think of statins as raising the productivity of all aspects of health care relating to the management of cholesterol (e.g., doctor visits, lab tests, drug therapy). Though the conceptual approach varies, the empirical expectation is similar for both models: innovations can lead to increasing health disparities. Hence, we find support for both models in our results.
We also borrowed from Goldman and Lakdawalla’s (2005) model, however, to note that technological innovations can reduce disparities when they lessen the value of other health inputs where high SES persons hold an advantage. Fundamental cause theory is focused on how resources affect (access to) technologies. We propose to further develop fundamental cause theory by incorporating the notion that technologies can also have an effect on resources, increasing the productivity of some while decreasing the productivity of others. Hence, it is important to consider the nature of technological change. In our case, statins could have worked in favor of lower-income persons by decreasing the marginal value of dietary adjustments, which were likely to be more widely adopted among higher-income persons. However, we found significant negative income gradients in the current wave of data, suggesting that statins did not, on balance, have a leveling effect on disparities. This can be attributed in large part to the fact that there were significant disparities in diffusion. We showed that, adjusting for clinical need, high-income persons had far greater odds of being on a statin compared to low-income persons. While statins may very well have decreased the productivity of lifestyle changes, they are still being used in far greater proportion by higher-income people. Despite similarities between statin use and Goldman and Lakdawalla’s example of blood pressure treatment, there are some differences that may have affected the diffusion of statins. Statins are much more expensive than first-line hypertension drugs, and the diagnosis and management of cholesterol is more complex, requiring lab analyses and fasting on the part of the patient. Blood pressure is simply and noninvasively assessed, and blood pressure monitoring has been a routine component of clinical care for decades.
From a conceptual standpoint, these findings bring us back to fundamental cause theory and the influence of flexible and transportable resources on access to innovations. Technologies that have the potential to contract disparities will not do so unless they also diffuse broadly, a point that is not directly addressed in Goldman and Lakdawalla’s framework. Social conditions can be thought of as a fundamental cause of disparities in diffusion, and this process will dampen the potential of new technologies to contract overall health disparities in the long run.
Our findings also speak to the diffusion of innovations literature, providing further evidence of disparities in diffusion and highlighting the need for greater attention to social disparities in this literature. We showed that the uptake of statins was positively associated with income. Similarly, Link et al. (1998) showed that innovations in cancer screening (pap test and mammography) were associated with SES upon implementation. Our examination goes one step further, though, by considering whether this disparity of diffusion coincides with a disparity in health. One wants to know not only whether high SES persons adopt first, but also whether they benefit from earlier adoption. We show that high-income persons also experienced the largest declines in cholesterol, contributing to the formation of a health advantage. The recent introduction of less expensive generic statins, however, holds promise for equalizing diffusion and reducing disparities in the future. Simvastatin, the generic version of Zocor, was approved in 2006, and the patent on Lipitor (the brand-name version of atorvastatin) is set to expire in 2010. Monitoring income gradients in the coming years may help elucidate the relative contributions of income per se (with lowered prices) versus access, knowledge, and patient and physician effort in maintaining disparities.
Socioeconomic gradients in cardiovascular mortality and disease have also reversed over time. Once known as a rich man’s disease in the 1930s and 1940s, persons of lower socioeconomic strata were at higher risk by the 1970s (Marmot et al. 1978a; Yeracaris and Kim 1978). Our finding that gradients in cholesterol reversed sometime during the late 1980s or early 1990s suggests that these changes were unlikely to have played a major role in the initial reversal of cardiovascular gradients in the United States. Nevertheless, new disparities in cholesterol will likely contribute to the maintenance or exacerbation of cardiovascular gradients, especially when combined with existing SES differentials in smoking, diabetes, hypertension, and obesity (Chang and Lauderdale 2005; Kanjilal et al. 2006). Indeed, social gradients in cardiovascular mortality have been widening over the last three decades (Singh and Siahpush 2002).
In a study of cocaine use, Meich (2008) proposed that emerging disparities could be explained by either a “remnant” perspective, where lower SES people are less likely to opt out of an unhealthy behavior over time, or a “recruitment” perspective, where lower SES persons are more likely to opt in. Given that cholesterol levels have decreased at all income levels but more so for high-income people, our case appears to be driven mostly by a remnant-type process.
There are limitations to our study. First, our analytic options are limited by the cross-sectional nature of the data. To more directly investigate the influence of statin use on disparities, we would ideally have panel data rather than repeated cross-sections, with lipid levels on all persons before and after the advent of statins and repeated data on medications and diet. A strength of the NHANES data, however, is that it is nationally representative and has measured values of both fasting LDL and total cholesterol. Second, our findings are no doubt driven by some combination of pharmaceutical intervention and continued dietary modifications. Higher SES was associated with lower intake of high fat foods by the late 1980s (Shimakawa et al. 1994). From a clinical standpoint, however, the efficacy of lifestyle modifications varies widely, and recommended LDL targets have decreased over time, becoming increasingly difficult to attain with dietary adjustments (NCEP 2002). Furthermore, as previously discussed, Carroll et al. (2005) have argued that decreases in lipid levels during the 1990s were more the result of medications than lifestyle changes because medication use increased significantly while fat and cholesterol intake remained essentially stable. Overall, it is likely that statins were (and continue to be) increasingly prescribed to meet with lower target levels, lower thresholds for initiating drug therapy, and a more aggressive approach to primary prevention (NCEP 2002). Though cholesterol levels have been in decline for all groups since the 1970s, disparities clearly favoring higher-income persons did not emerge until the last decade, suggesting that statins played a substantive role in this shift. Additionally, results from our exploratory analyses simulating the absence of statins are consistent with the hypothesis that statin use contributed to the change in income gradients over time.
In conclusion, we find that income disparities in lipid levels have reversed over the past three decades, changing from a positive to a negative gradient during a period in which highly effective medications were disseminated. The influence of technologies on socioeconomic disparities is subject to two important modifiers: (1) the nature of the technological change and (2) the extent of its diffusion and adoption. While resources affect access to technologies, some technologies can also affect resources, lessening the productivity of various health inputs. In our case, statins could have helped to equalize cholesterol levels by overtaking the value of lifestyle inputs. Significant disparities in diffusion and adoption, however, resulted in a net effect of gradients favoring the wealthy. It is important to note that average cholesterol levels declined during this period at all income levels. Hence, statins have contributed to an overall improvement, yielding absolute health benefits at all incomes. Health-enhancing innovations, however, are typically implemented in a context of inequalities (Link et al. 1998), and an innovation that raises average health can nevertheless create new links between social factors and disease pathways.
Lastly, our study of cholesterol in particular speaks to the persistence of social gradients in mortality over the past century, as outlined by fundamental cause theory. Social gradients persist over time because a variety of individual components are constantly in flux, with shifting diseases and risk factors, unequal access to interventions, and the formation of new gradients as old gradients flatten out. Cardiovascular disease has replaced infectious diseases as the leading cause of death over the past century, and cholesterol has emerged as a newly salient risk factor. We show how the wealthy have disproportionately benefitted from the development of a technology to treat this new risk factor, which will likely extend to disparities in cardiovascular mortality and, ultimately, contribute to the maintenance of disparities in overall mortality. Hence, we provide a detailed look at one piece of a complex web of events, offering a window on the “moving parts,” so to speak, of a larger process wherein disparities in health are maintained over the long run. Ultimately, fundamental social causes will only be redressed by changing the underlying inequality of resources (Link and Phelan 1995).
Acknowledgments
This research was supported in part by grant K12-HD043459 from the National Institute of Child Health and Human Development (to Virginia Chang). We are grateful to Jason Schnittker, Theodore Iwashyna, the JHSB editor, and four anonymous reviewers for their constructive comments and suggestions. Early versions of this article benefited from presentations at the annual meetings of the Population Association of America (New Orleans, 2008) and the Society of General Internal Medicine (Pittsburgh, 2008).
Biographies
Virginia Chang is an attending physician at the Philadelphia Veterans Affairs Medical Center, Assistant Professor of Medicine in the Division of General Internal Medicine at the University of Pennsylvania School of Medicine, and Assistant Professor of Sociology in the Department of Sociology at the University of Pennsylvania. Her research integrates perspectives from medicine, sociology, and epidemiology to study the relationships between health and various aspects of sociocultural life. Much of her work has centered on obesity and its social determinants and consequences.
Diane Lauderdale is Associate Professor of Epidemiology in the Health Studies Department and the College at the University of Chicago. Her research interests include social determinants of health behaviors and chronic disease epidemiology.
Footnotes
Virginia Chang is with the Philadelphia Veterans Affairs Medical Center and the Departments of Medicine and Sociology at the University of Pennsylvania. Diane Lauderdale is with the Department of Health Studies at the University of Chicago.
Relative risks are computed for whites at age 40 with a BMI of 25.
Contributor Information
VIRGINIA W. CHANG, University of Pennsylvania
DIANE S. LAUDERDALE, University of Chicago
References
- Bellosta Stefano, Paoletti Rodolfo, Corsini Alberto. History and Development of HMG-CoA Reductase Inhibitors. In: Schmitz G, Torzewski M, editors. HMG-CoA Reductase Inhibitors. Basel, Switzerland: Birkhauser Verlag; 2002. pp. 1–18. [Google Scholar]
- Blane D, Hart CL, Davey Smith G, Gillis CR, Hole DJ, Hawthorne VM. Association of Cardiovascular Disease Risk Factors with Socioeconomic Position during Childhood and during Adulthood. British Medical Journal. 1996;313:1434–38. doi: 10.1136/bmj.313.7070.1434. [DOI] [PMC free article] [PubMed] [Google Scholar]
- Boutwell RC, Mitchell JB. Diffusion of New Technologies in the Treatment of the Medicare Population: Implications for Patient Access and Program Expenditures. International Journal of Technology Assessment in Health Care. 1993;9:62–75. doi: 10.1017/s0266462300003032. [DOI] [PubMed] [Google Scholar]
- Carroll Margaret D, Lacher David A, Sorlie Paul D, Cleeman James I, Gordon David J, Wolz Michael, Grundy Scott M, Johnson Clifford L. Trends in Serum Lipids and Lipoproteins of Adults, 1960–2002. Journal of the American Medical Association. 2005;294:1773–81. doi: 10.1001/jama.294.14.1773. [DOI] [PubMed] [Google Scholar]
- Chang Virginia W, Lauderdale Diane S. Income Disparities in Body Mass Index and Obesity in the United States, 1971–2002. Archives of Internal Medicine. 2005;165:2122–28. doi: 10.1001/archinte.165.18.2122. [DOI] [PubMed] [Google Scholar]
- Cutler David M, Kadiyala Srikanth. The Return to Biomedical Research: Treatment and Behavioral Effects. In: Murphy Kevin M, Topel Robert H., editors. Measuring the Gains from Medical Research: An Economic Approach. Chicago, IL: The University of Chicago Press; 2003. pp. 110–62. [Google Scholar]
- Glied Sherry, Lleras-Muney Adriana. Technological Innovation and Inequality in Health. Demography. 2008;45:741–61. doi: 10.1353/dem.0.0017. [DOI] [PMC free article] [PubMed] [Google Scholar]
- Goldman Dana P, Lakdawalla Darius N. A Theory of Health Disparities and Medical Technology. Contributions to Economic Analysis and Policy. 2005;4:1–30. [Google Scholar]
- Ippolito PM, Mathios AD. Information and Advertising Policy: A Study of Fat and Cholesterol Consumption in the United States, 1977–1990. Washington, DC: Bureau of Economics Staff Report, Federal Trade Commission; 1996. [Google Scholar]
- Iribarren Carlos, Luepker Russell V, McGovern Paul G, Arnett Donna K, Blackburn Henry. Twelve-Year Trends in Cardiovascular Disease Risk Factors in the Minnesota Heart Survey. Archives of Internal Medicine. 1997;157:873–81. [PubMed] [Google Scholar]
- Jones Peter, Kafonek Stephanie, Laurora Irene, Hunninghake Donald. Comparative Dose Efficacy Study of Atorvastatin versus Simvastatin, Pravastatin, Lovastatin, and Fluvastatin in Patients with Hypercholesterolemia (The CURVES Study) American Journal of Cardiology. 1998;81:582–87. doi: 10.1016/s0002-9149(97)00965-x. [DOI] [PubMed] [Google Scholar]
- Sanjat Kanjilal, Gregg Edward W, Cheng Yiling J, Zhang Ping, Nelson David E, Mensah George, Beckles Gloria LA. Socioeconomic Status and Trends in Disparities in 4 Major Risk Factors for Cardiovascular Disease Among US Adults, 1971–2002. Archives of Internal Medicine. 2006;166:2348–55. doi: 10.1001/archinte.166.21.2348. [DOI] [PubMed] [Google Scholar]
- Kushi LH, Folsom AR, Jacobs DR, Jr, Luepker RV, Elmer PJ, Blackburn H. Educational Attainment and Nutrient Consumption Patterns: The Minnesota Heart Survey. Journal of the American Dietetic Association. 1988;88:1230–36. [PubMed] [Google Scholar]
- Lewin Group. Pharmaceutical Partners for Better Healthcare Diffusion of Treatments Study: Statin Use for Hypercholesterolemia Cross-Country Study. Alexandria, VA: The Lewin Group; 2000. [Google Scholar]
- Link Bruce G, Northridge Mary E, Phelan Jo C, Ganz Michael L. Social Epidemiology and the Fundamental Cause Concept: On the Structuring of Effective Cancer Screens by Socioeconomic Status. The Milbank Quarterly. 1998;76:375–402. doi: 10.1111/1468-0009.00096. [DOI] [PMC free article] [PubMed] [Google Scholar]
- Link Bruce G, Phelan Jo. Social Conditions as Fundamental Causes of Disease. Journal of Health and Social Behavior. 1995;35:80–94. [PubMed] [Google Scholar]
- Lleras-Muney Adriana, Lichtenberg Frank R. Working Paper No. 9185. National Bureau of Economic Research; Cambridge, MA: 2002. The Effect of Education on Medical Technology Adoption: Are the More Educated More Likely to Use New Drugs? [Google Scholar]
- Lutfey Karen, Freese Jeremy. Toward Some Fundamentals of Fundamental Causality: Socioeconomic Status and Health in the Routine Clinic Visit for Diabetes. American Journal of Sociology. 2005;110:1326–72. [Google Scholar]
- Lynch Scott M. Cohort and Life-Course Patterns in the Relationship between Education and Health: A Hierarchical Approach. Demography. 2003;40:309–31. doi: 10.1353/dem.2003.0016. [DOI] [PubMed] [Google Scholar]
- Marmot MG, Adelstein AM, Robinson Nicola, Rose GA. Changing Social-Class Distribution of Heart Disease. British Medical Journal. 1978a;2:1109–12. doi: 10.1136/bmj.2.6145.1109. [DOI] [PMC free article] [PubMed] [Google Scholar]
- Marmot MG, Rose Geoffrey, Shipley M, Hamilton PJS. Employment Grade and Coronary Heart Disease in British Civil Servants. Journal of Epidemiology and Community Health. 1978b;32:244–49. doi: 10.1136/jech.32.4.244. [DOI] [PMC free article] [PubMed] [Google Scholar]
- Medical Letter, The. Three New Drugs for Hyperlipidemia. The Medical Letter on Drugs and Therapeutics. 2003;45:17–9. [PubMed] [Google Scholar]
- Miech Richard. The Formation of a Socioeconomic Health Disparity: The Case of Cocaine Use during the 1980s and 1990s. Journal of Health and Social Behavior. 2008;49:352–66. doi: 10.1177/002214650804900308. [DOI] [PMC free article] [PubMed] [Google Scholar]
- Miniño Arialdi, Heron Melonie P, Murphy Sherry L, Kochanek Kenneth D. Deaths: Final Data for 2004. National Vital Statistics Reports. 2007;55:1–120. [PubMed] [Google Scholar]
- Murphy Kevin M, Topel Robert H. Measuring the Gains from Medical Research: An Economic Approach. Chicago, IL: The University of Chicago Press; 2003. [Google Scholar]
- National Cholesterol Education Program. Third Report of the National Cholesterol Education Program (NCEP) Expert Panel on Detection, Evaluation, and Treatment of High Blood Cholesterol in Adults (Adult Treatment Panel III) Final Report. Circulation. 2002;106:3143–3421. [PubMed] [Google Scholar]
- National Institutes of Health. FY 2007 Director’s Budget Request Statement. 2007 Retrieved October 28, 2008 ( http://www.nih.gov/about/director/budgetrequest/fy2007directorsbudgetrequest.htm)
- Pappas Gregory, Queen Susan, Hadden Wilbur, Fisher Gail. The Increasing Disparity in Mortality between Socioeconomic Groups in the United States, 1960 and 1986. New England Journal of Medicine. 1993;329:103–109. doi: 10.1056/NEJM199307083290207. [DOI] [PubMed] [Google Scholar]
- Phelan Jo C, Link Bruce G. Controlling Disease and Creating Disparities: A Fundamental Cause Perspective. Journals of Gerontology: SERIES B. 2005;60B:27–33. doi: 10.1093/geronb/60.special_issue_2.s27. [DOI] [PubMed] [Google Scholar]
- Phelan Jo C, Link Bruce G, Diez-Roux Ana, Kawachi Ichiro, Levin Bruce. ‘Fundamental Causes’ of Social Inequalities in Mortality: A Test of the Theory. Journal of Health and Social Behavior. 2004;45:265–85. doi: 10.1177/002214650404500303. [DOI] [PubMed] [Google Scholar]
- Rogers Everett M. Diffusion of Innovations. New York: The Free Press; 2003. [Google Scholar]
- Shimakawa Tomoko, Sorlie Paul, Carpenter Myra A, Dennis Barbara, Tell Grethe S, Watson Robert, Williams O Dale. Dietary Intake Patterns and Sociodemographic Factors in the Atherosclerosis Risk in Communities Study. Preventive Medicine. 1994;23:769–80. doi: 10.1006/pmed.1994.1133. [DOI] [PubMed] [Google Scholar]
- Singh Gopal K, Siahpush Mohammad. Increasing Inequalities in All-Cause and Cardiovascular Mortality among US Adults Aged 25–64 Years by Area Socioeconomic Status, 1969–1998. International Journal of Epidemiology. 2002;31:600–13. doi: 10.1093/ije/31.3.600. [DOI] [PubMed] [Google Scholar]
- Warren John Robert, Hernandez Elaine M. Did Socioeconomic Inequalities in Morbidity and Mortality Change in the United States over the Course of the Twentieth Century? Journal of Health and Social Behavior. 2007;48:335–51. doi: 10.1177/002214650704800401. [DOI] [PMC free article] [PubMed] [Google Scholar]
- Yeracaris Constantine A, Kim Jay H. Socioeconomic Differentials in Selected Causes of Death. American Journal of Public Health. 1978;68:342–51. doi: 10.2105/ajph.68.4.342. [DOI] [PMC free article] [PubMed] [Google Scholar]