

Abstract
Oral cancer is a complex disease that is characterized by histologic and genetic heterogeneity. The evolution and progression of this disease is thought to result from the accumulation of alterations in molecular pathways. Although the oral cavity is accessible for routine screening of suspicious lesions, gene alterations are known to accrue in histologically normal tissues. Therefore some cancer forerunners may remain undetected clinically or histologically. Recently, emerging optical and molecular technologies have provided a powerful means for redefining the extent of the field of alteration. Often this means expanding upon regions detectable with standard white light approaches. In this report we used a newly developed optical technique, direct fluorescence visualization, to define a contiguous field that extended beyond the margins of a clinically visible oral squamous cell carcinoma. Multiple biopsies were taken within this contiguous optically altered field. Genome alterations detected for each specimen were compared to define whether each lesion arose independently or as a consequence of a shared progenitor cell. Our results indicate that the field effect of oral cancer is extremely dynamic, with different genetic alterations present in different biopsies within a field. This case study also demonstrated two genetically unrelated SCCs could be developed within 10 mm at the right lateral tongue of this patient. These findings provide evidence for the importance to implement optical technologies in defining surgical margins and support the use of whole genome technologies in the diagnosis of clonal versus independent lesions of the oral cavity, which may have implications on treatment strategies.
Keywords: oral cancer, direct fluorescence visualization, field cancerization, clonality
Introduction
“Field cancerization” was first proposed six decades ago by Slaughter et al. to describe the multifocal development of oral cancer (36). With advances in molecular technology, it has become apparent that gene alterations within an affected field may be spread broadly across the mucosa of oral cancer patients (5, 7, 39). The reality that these altered cells can contribute to local disease recurrence or the development of second primary tumors has driven extensive research into approaches for effectively defining the margins of a diseased field.
Fields in oral cancer patients (including clinically occult fields), areas of oral premalignant lesions (OPLs) and cancers, represent a heterogeneous group of lesions that can vary widely in their potential for malignant transformation and metastasis (1, 22, 32, 35). Moreover, many OPLs and early staged SCCs are undetectable by standard white light examination and thus may not be readily detected in the clinical setting. Even where OPLs and SCCs can be visibly detected, disease may extend beyond the margins presently defined in the clinic (8, 27). These lesion-adjacent “normal” fields, determined by clinical visibility, can harbour molecular alterations that may later be the basis for recurrent disease (3, 5, 8, 15, 20).
Recent advances in optical technology have provided a means for simple, cost-effective, and discriminating visualization of disease fields. Different adjunct tools, including direct fluorescence visualization (FV) and toluidine blue staining, have been reported to aid in the identification of OPLs and early oral cancers, thus guiding decisions for biopsies at the chairside and for surgical margins in the operating room (26-28, 42).
The molecular mechanisms governing field change remain unclear. It is possible that carcinogen exposure to epithelial cells at several sites gives rise to independent transformation events and the induction of multiple genetically unrelated tumors (36). Alternatively, a rare transforming event in a single progenitor cell that subsequently repopulates a contiguous area of tissue may give rise to multiple, clonally-related tumors (4). Lateral intraepithelial migration of a preneoplastic cell has also been proposed to give rise to multiple lesions (6).
Clinical presentation and histologic evaluation are unable to determine whether lesions from the same patient are clonally-related. This distinction is important since it may impact treatment decisions and outcome. Understanding the specific gene alterations underlying each lesion will be increasingly important as we move towards targeted therapies. Using improved screening techniques and molecular tools to define relationships between lesions would allow more accurate application of existing treatment modalities (13, 16).
Previous molecular efforts to assess clonality in oral cancer have been based on evaluation of one or a handful of previously identified critical gene changes (e.g., loss of heterozygosity [LOH] at frequently altered loci, detection of a known cytogenetic marker, or p53 mutational status) (4, 7, 14, 24, 33, 34, 37, 39, 40). This reliance on a priori knowledge for evaluable targets limits the effectiveness of this approach, since gene changes that were not assessed may be driving the progression of a given tumor. In addition, evaluation of the most frequently occurring molecular events in oral tumorigenesis may establish false relationships between tumors that have obtained mutations independently. High-resolution whole genome analysis for individual lesions, including fine-mapping of DNA alteration boundaries, represents an effective means of delineating clonal relationships between tumors (9). The detection of alterations with identical boundaries in multiple lesions from the same patient would strongly indicate the presence of a shared progenitor, while the absence of such shared features would be indicative of independent origins. The ability to accurately define clonality in these cases will have a significant impact on guiding treatment decisions (9).
In this case report, we used a novel optical technique to characterize the field of diseased oral tissue in a 52-year-old male smoker who presented with a single oral SCC lesion. Using this approach in concert with histological and genomic analyses we have comprehensively characterized the altered field. Through this approach, our results demonstrate how vast and heterogeneous the altered field can be clinically, histological and molecularly and therefore highlight the importance of an enhanced treatment decision based on these technologies.
Materials and Methods
Case Presentation
A 52-year-old male smoker developed a 1.5 cm nodular tumor at the right lateral tongue, which is clinically visible under white light (Fig. 1A, #1). A hand-held FV device, VELscope ® (LED Med. Inc., BC, Canada) has been applied to guide surgical treatment of oral cancer in the operating room (25, 27, 31). This simple hand-held device uses a blue/violet light (400-460 nm) to excite the oral tissues where normal tissue would re-emit this light as pale green while abnormal tissues would show loss of such autofluorescence (FV loss or FVL) and appear dark brown (21, 25, 26).
Figure 1.
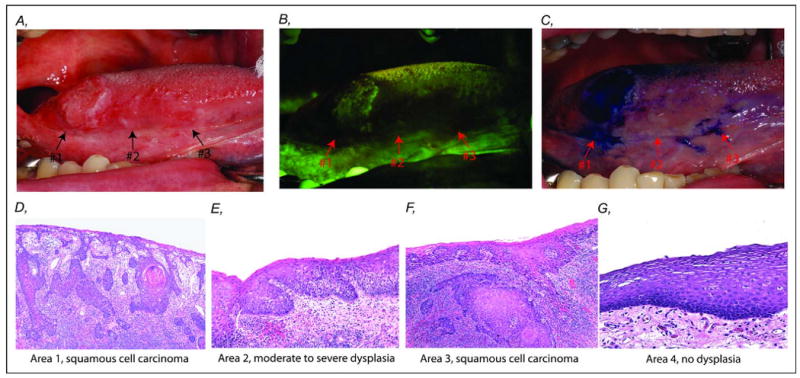
Clinical characterization and corresponding histology within an oral cancer field at right lateral tongue of a 52-year-old male former smoker. A. White light image of a clinically visible nodular lesion (#1) and an ill-defined change (#2 and #3) anterior to the nodular tumor area. B. The same field under fluorescence visualization (FV) device showed an area of dark brown change of FV loss at the nodular lesion (#1) and an additional area (#2 and #3), 25 mm anterior to the nodular area (#1). C. Uptake of toluidine blue in areas #1 and #3 but absent in area #2. D-G. Photomicrographs showed varying degrees of histology change of the field: D (#1) invasive squamous cell carcinoma, E (#2) moderate to severe dysplasia, F (#3) invasive squamous cell carcinoma, and G (#4) no dysplasia at the surgical boundary, 10 mm away from FV boundary (H & E staining, original magnification, 40×).
Using this FV device, a dark brown area of FVL at the tumor (initially identified under white light, #1) and an additional area, 25 mm anterior to the clinically visible nodular lesion (which appeared normal under white light) were revealed (Fig. 1B, #2 and 3). Staining of the oral tissues with toluidine blue was also used to guide surgical treatment. Toluidine blue is a dye that has been shown to stain high-risk OPLs (42). After the application of toluidine blue, two areas were positive: one area overlapped the tumor that was identified under white light (#1) and a second separate area within the FVL area (#3, Fig. 1C). Although area #2 showed loss of autofluorescence, it was negative for toluidine blue stain (Fig. 1C).
Tissue samples
5-mm punch biopsies (from areas #1, 2, 3, and 4) were obtained from the surgical specimen (Fig. 1) (27). Samples were fixed in 10% neutral formalin and embedded in paraffin wax. Tissue sections were stained with hematoxylin and eosin (H&E) and diagnoses were confirmed by the study pathologist (CFP) according to the World Health Organization (WHO) classification. The control sample (#4) was obtained at the surgical margin, 10 mm away from the FVL boundary. Epithelial cells in the represented areas were meticulously dissected from subtending connective tissue under an inverted microscope using a 23G needle. DNA was extracted using standard phenol-chloroform protocols followed by ethanol precipitation (38).
Whole genome tiling-path array
Tiling-path genomic arrays, SMRT v.2, obtained from the BC Cancer Research Centre Array Laboratory, were used to identify copy number alterations present in the various biopsies (17). The whole genome is represented as 26,819 overlapping bacterial artificial chromosome (BAC) clones spotted in duplicate, allowing breakpoint detection at a resolution of 50 kbp (12, 17). Each sample DNA and the same normal reference male genomic DNA (250 ng each) were random prime labeled with cyanine-3 and cyanine-5 dCTP, respectively. Hybridization, washing and scanning of the arrays, and analysis of the array images were performed as previously described (38).
A three-step normalization procedure, including LOWESS fitting, spatial, and median normalization, was used to remove systematic biases (19). SeeGH software was used to display log2 signal intensity ratios in relation to genomic locations in the hg17 assembly (NCBI Build 35) (11). Data points with standard deviation > 0.075 and signal to noise ratio < 3 in either channel were removed (38). Breakpoint detection algorithm aCGH-smooth was used to delineate boundaries of DNA gain and loss (18).
Loss of heterozygosity (LOH)
All samples were analyzed by 10 microsatellite markers. The protocol for LOH analysis and scoring have been previously described (41). Microsatellite markers used mapped to the following ten regions: 3p14.2 (D3S1234, D3S1228, and D3S1300), 9p21 (IFNA, D9S171, D9S1748, and D9S1751), and 17p11.2 (CHRNB1) and 17p13.1 (tp53 and D17S786). Markers were selected based on previous studies showing their predictive value for cancer risk of OPLs (29).
Results
Heterogeneity across an optically altered field
The 1.5 cm nodular tumor, apparent clinically, FVL, and uptake of toluidine blue (area #1) was identified as an invasive SCC (Fig. 1D). Area #2, anterior to #1, was clinically not apparent but showed FVL with no uptake of toluidine blue, was classified as a moderate to severe dysplasia (Fig. 1E). Interestingly, area #3, 10 mm anterior to the nodular tumor (#1), was also clinically not apparent but showed FVL and was positive for toluidine blue staining. This area was histologically assessed as an invasive SCC (Fig. 1F). No dysplasia was detected in the control sample (area #4), which had no FVL and was negative for toluidine blue staining (Fig. 1G). Thus, histologically different areas were found within the single contiguous field of FV loss, while uptake of toluidine blue was only found in the SCC areas (#1 and #3). The four samples were also examined with LOH markers known to predict risk of progression and recurrence (29, 30). LOH was detected at 9p (D9S1748 and D9S171) and 17p (D17SCHRNB and tp53) in samples #1, 2, and 3. No LOH was detected at the above loci in normal sample #4. This further supports the use of FV device to capture high-risk field. Accrual of multiple biopsies within this optically altered field provides us the opportunity to examine the intralesional heterogeneity of this patient.
Defining clonal origin among biopsies in an oral cancer field using whole genome breakpoint detection
Previous studies have used molecular techniques that are limited to low-resolution findings or are based on known genetic changes to determine a clonal origin among multiple lesions (4, 6, 20, 23, 37, 39, 40). However, the regions assayed occur frequently in oral cancers regardless of clonal origin. By tiling-path DNA microarray, unique boundaries of genetic alterations in the genome are delineated, thus improving the ability to deduce relatedness among the lesions. We obtained whole genome profiles of microdissected cells from areas #1, 2, 3, and 4. Genetic alterations common to all samples were all whole arm changes, including loss of 5q and 8p, and gain of 8q (Fig. 2). The most striking feature among the genetic alterations of these samples was a region of high-level amplification on chromosomal band 9p22.3-p24.2 that was absent in the normal sample #4 (Fig. 3). This region of high-level amplification was a distinct feature of these samples and was not commonly observed in other OSCCs from different patients (2). However, alteration boundaries were not shared across all three samples. Area #1 (SCC) had distinctive boundaries at 9p24.2 and 9p22.2, while area #2 (dysplasia) and area #3 (SCC) both shared the same genetic boundaries near the telomere of 9p and 9p22.3 (Fig. 3). Because areas #2 and #3 shared the same alteration boundary it is indicative of a shared origin, distinct from area #1.
Figure 2.
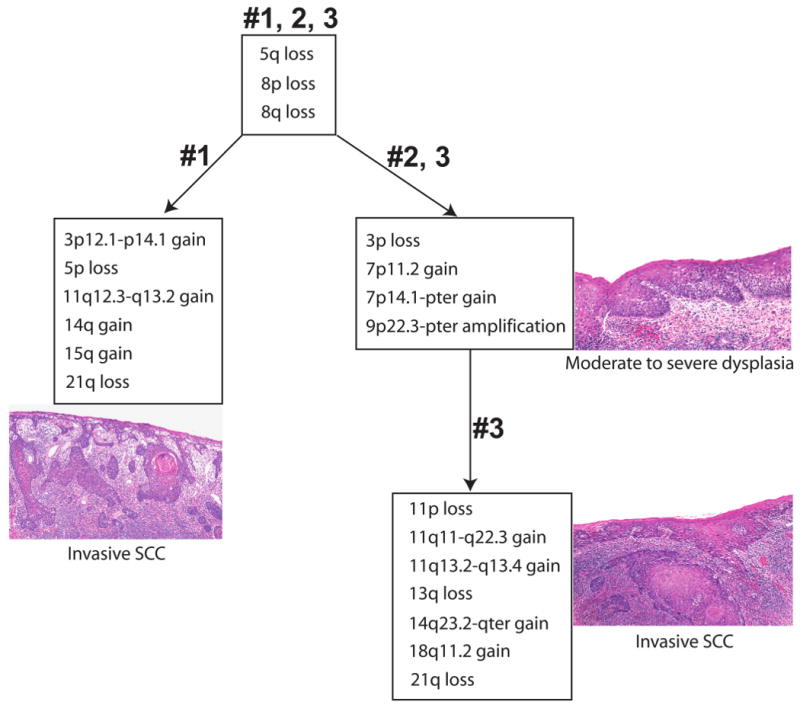
Summary of genetic alterations in different cell populations from various areas within an optically altered oral cancer field. All three samples from areas #1, 2, and 3 exhibited loss of 5q, 8p and gain of 8q. All the regions of segmental alteration common to areas #2 (dysplasia) and #3 (SCC) shared identical genetic boundaries.
Figure 3.
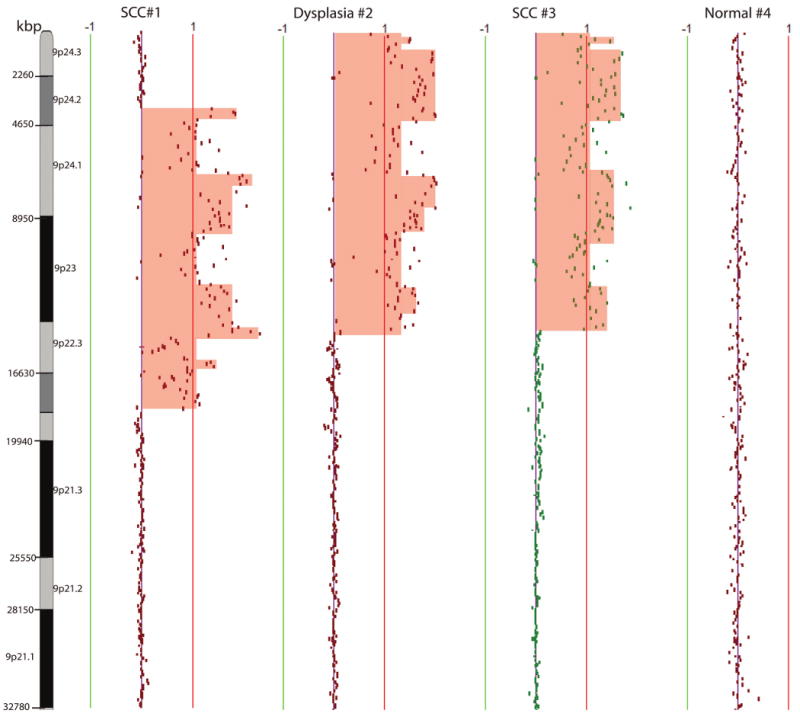
Chromosome 9p genetic profiles of samples from areas #1 (SCC), #2 (dysplasia), #3 (SCC), and #4 (10 mm beyond FV boundary, no dysplasia). The red and green lines are positive and negative ratio lines scaled by an increment of log2 signal ratios of 0.5. Amplified region was shaded in red. Different genetic boundaries of alteration were observed in samples from areas #1 and #3, while the same genetic boundaries were shared in areas #2 and #3.
Although the three samples shared common genetic whole arm alterations, which may be indicative of a common progenitor, whole arm changes, unlike specific regions of breakage, are common in unstable tumor genomes and therefore cannot be used to deduce a clonal origin. Six additional genetic events were exclusively detected in the clinically apparent SCC (area #1). The genetic alterations that governed this divergence included segmental gain of 3p12.1-p14.1, 11q12.3-q13.2, chromosome gain of 14q and 15q, and chromosome arm loss of 5p and 21q (Fig. 2). Interestingly, area #2 (dysplasia), located between two SCCs (areas #1 and #3), shared more common genetic alterations with six identical boundaries with area #3 than with area #1. Common genetic changes between area #2 (dysplasia) and area #3 (SCC) included 3p loss, 7p11.2 gain (EGFR), and 7p14.1-pter gain (Fig. 2).
Concurrent with the premise that genetic alterations accumulate and parallel the histological progression model from dysplasia to SCC, all genetic alterations present in area #2 (dysplasia) were also detected in area #3 (SCC), and additional genetic events occurred for the formation of area #3. These exclusive changes specific to area #3 (SCC) include segmental gain on 11q11-q22.3, 14q23.2-qter, and 18q11.2, and whole arm loss of 11p, 13q, and 21q (Fig. 2). Alterations detected in area #2 are believed to be early events while additional alterations detected in area #3 are believed to be later events. Normal sample #4 contained variations in genomic loci of copy number polymorphisms and contained none of the genetic alterations described in samples #1, 2, and 3. From the above analysis, we hypothesized that two subclone populations originated from a common progenitor, and SCC #3 was derived from dysplasia #2, whereas it appears SCC #1 diverged to a separate clonal lineage. However, we could not rule out the possibility that whole chromosome arm change of 5q, 8p, and 8q are random independent changes as these are whole arm changes that happen frequently in OPLs from different individuals.
LOH results suggest a common progenitor among biopsies #1, 2, and 3
Examination of microsatellite markers have been used by several previous studies to predict local tumor recurrence and examine clonality of synchronous or metachronous lesions in the oral cavity (4, 23, 24, 33, 37). Microsatellite analysis of biopsies #1, 2, and 3 revealed LOH at the same allele at 9p (D9S1748 and D9S171) and 17p (CHRNB and tp53), no LOH at 3p14 (D3S1228, D3S1234 and D3S1300), and was non-informative at IFNA and D9S1751. No LOH was detected at the above loci in normal sample #4. Thus, based on microsatellite markers alone a common progenitor would be suggested among all three biopsies, demonstrating that LOH alone is not sufficient to determine clonality among lesions.
Discussion
A field of alteration, which extended 25 mm anterior to the clinically apparent tumor, was detected by FV device in the oral cavity of a 52-year-old male oral cancer patient. Using the FV device, in conjunction with conventional approaches using white light and toluidine blue stain, several areas within the altered field were sampled for histological and molecular analysis. One dysplasia and two SCCs were identified for the three biopsies. Whole genome analysis of these three biopsies revealed two clonal populations of cells with different genetic signatures, providing important clinical implications for tailored treatment in the future. This is a keen example of using whole genome technologies to determine clonality between samples of a single patient.
This case highlights two major issues in oral cancer management. The first is the clonal origin of multiple tumors within the oral cavity and its clinical implication. In this case we observe a situation where two tumors (SCCs #1 and #3) are present in close approximation and although they share some common whole arm changes they appear to be genetically different (Fig. 2), indicating that they arose through subsequent independent mechanisms. Therefore each tumor may require different therapy regimes as we move towards molecular targeted therapies. The second is the presence of clinically not apparent fields. Clearly using white light alone is not sufficient to truly capture the entire field of alteration. Leaving behind a portion of the altered field during surgical procedures greatly increases the possibility of recurrence for these patients (8, 25). Therefore additional techniques, such as FV and toluidine blue stain, are necessary to more accurately define the surgical margins.
It is well known that genetic alterations accumulate with increasing histological stage; although most studies have been performed with lesions from different time points or different patients (10). Studying a single altered field where multiple histological grades are present provides us with the opportunity to study the natural history of the disease. In this case we detected two regions classified as SSC separated by a region of dysplasia. Two clonal lineages (SCC #1 and SCC #3) governed the formation of the field anterior to SCC #1. For example, DNA amplification of chromosome 9p was detected in all samples including SCC in area #1, dysplasia in area #2, and SCC in area #3. While area #2 (dysplasia) and area #3 (SCC) shared identical genetic boundaries of the 9p amplicon, the boundaries were different between two geographically separated SCCs (areas #1 and #3). This represents divergent cell subpopulations between areas #1 and #3. Because area #2 (dysplasia) and area #3 (SCC) shared breakpoints for chromosome 9p amplicon, we can conclude that this was an early event. On the other hand, amplification of cyclin D1 was exclusively present in SCC #3, suggesting a later but aggressive role for this gene to govern the formation of SCC in area #3. While whole arm loss of chromosome 5q and 8p, and gain of chromosome 8q were common events among areas #1, 2, and 3, suggesting a common progenitor governing the formation of these samples, we cannot conclusively state whether these events were present in a progenitor common to all three areas since whole arm change occurs frequently in different individuals regardless of their clonal origin. The whole arm changes (5q, 8p, 8q) observed in all three biopsied areas occur independently in almost half of the unrelated OSCC cases we have profiled (2). However, it is still possible that these whole arm alterations were priming the entire field with genetically damaged cells, and independent secondary genetic damages occur in two areas within this field, thus contributing to the divergence of two lineages.
Molecular analyses using LOH markers were also performed on these biopsied areas. Based on results from LOH alone, we would have concluded all collected biopsies within this field shared a common progenitor, as all other genetic alterations not assayed by the markers escaped detection. Thus it is crucial to use high-resolution whole genome technologies to examine global genetic alterations when trying to determine a clonal origin. In addition, clonality among lesions should be established based on the occurrence of specific genetic breakpoints of segmental alterations in order to prevent identifying whole arm changes that are frequently detected in oral cancers from different patients.
The understanding of the molecular mechanism paralleling the spread of “field at risk” will place important implications on the prevention and treatment of oral SCC patients. By mapping different biopsies within an optically altered oral mucosa field using whole genome tiling-path microarrays, we hypothesized a common progenitor cell with critical genetic alteration (loss of 5q, 8p and gain of 8q) overpopulated a contiguous field of genetically damaged cells, and subsequent independent genetic events happened governing the formation of two SCCs within a single anatomical field. This case report is a keen example that confirms the use of optical tools is necessary to detect field change of oral cancer patients, which could improve surgical margin decision. It also has important implication as we move towards tailored therapy because a single field could be extremely dynamic and there might be a need for different targeted therapy to effectively treat different subclones of a single field.
Acknowledgments
The author would like to acknowledge Dr. Wan L. Lam for helpful discussion. IFLT is supported by scholarships from the Canadian Institutes of Health Research (CIHR) and the Michael Smith Foundation for Health Research (MSFHR). CFP is supported by a Clinician Scientist Award from the CIHR and a Scholar Award from the MSFHR.
Grant support: This work was supported by grants from the National Institute of Dental and Craniofacial Research/National Institutes of Health (R01 DE17013), Canadian Institutes of Health Research (MOP-77663), and the Canadian Cancer Society (CCS-20336), and funds from the Pacific Otolaryngology Foundation.
References
- 1.Axell T, Pindborg JJ, Smith CJ, et al. Oral white lesions with special reference to precancerous and tobacco- related lesions: conclusions of an international symposium held in Uppsala, Sweden, May 18-21 1994. International Collaborative Group on Oral White Lesions. J Oral Pathol Med. 1996;25:49–54. doi: 10.1111/j.1600-0714.1996.tb00191.x. [DOI] [PubMed] [Google Scholar]
- 2.Baldwin C, Garnis C, Zhang L, et al. Multiple microalterations detected at high frequency in oral cancer. Cancer Res. 2005;65:7561–7567. doi: 10.1158/0008-5472.CAN-05-1513. [DOI] [PubMed] [Google Scholar]
- 3.Batsakis JG, Suarez P, el-Naggar AK. Proliferative verrucous leukoplakia and its related lesions. Oral Oncol. 1999;35:354–359. doi: 10.1016/s1368-8375(99)00007-x. [DOI] [PubMed] [Google Scholar]
- 4.Bedi GC, Westra WH, Gabrielson E, et al. Multiple head and neck tumors: evidence for a common clonal origin. Cancer Res. 1996;56:2484–2487. [PubMed] [Google Scholar]
- 5.Braakhuis BJ, Brakenhoff RH, Leemans CR. Second field tumors: a new opportunity for cancer prevention? Oncologist. 2005;10:493–500. doi: 10.1634/theoncologist.10-7-493. [DOI] [PubMed] [Google Scholar]
- 6.Braakhuis BJ, Leemans CR, Brakenhoff RH. Expanding fields of genetically altered cells in head and neck squamous carcinogenesis. Semin Cancer Biol. 2005;15:113–120. doi: 10.1016/j.semcancer.2004.08.004. [DOI] [PubMed] [Google Scholar]
- 7.Braakhuis BJ, Tabor MP, Kummer JA, et al. A genetic explanation of Slaughter's concept of field cancerization: evidence and clinical implications. Cancer Res. 2003;63:1727–1730. [PubMed] [Google Scholar]
- 8.Brennan JA, Mao L, Hruban RH, et al. Molecular assessment of histopathological staging in squamous-cell carcinoma of the head and neck. N Engl J Med. 1995;332:429–435. doi: 10.1056/NEJM199502163320704. [DOI] [PubMed] [Google Scholar]
- 9.Buys TP, Aviel-Ronen S, Waddell TK, et al. Defining genomic alteration boundaries for a combined small cell and non-small cell lung carcinoma. J Thorac Oncol. 2009;4:227–239. doi: 10.1097/JTO.0b013e3181952678. [DOI] [PubMed] [Google Scholar]
- 10.Califano J, van der Riet P, Westra W, et al. Genetic progression model for head and neck cancer: implications for field cancerization. Cancer Res. 1996;56:2488–2492. [PubMed] [Google Scholar]
- 11.Chi B, deLeeuw RJ, Coe BP, et al. MD-SeeGH: a platform for integrative analysis of multi-dimensional genomic data. BMC Bioinformatics. 2008;9:243. doi: 10.1186/1471-2105-9-243. [DOI] [PMC free article] [PubMed] [Google Scholar]
- 12.Coe BP, Ylstra B, Carvalho B, et al. Resolving the resolution of array CGH. Genomics. 2007;89:647–653. doi: 10.1016/j.ygeno.2006.12.012. [DOI] [PubMed] [Google Scholar]
- 13.Elser C, Siu LL, Winquist E, et al. Phase II trial of sorafenib in patients with recurrent or metastatic squamous cell carcinoma of the head and neck or nasopharyngeal carcinoma. J Clin Oncol. 2007;25:3766–3773. doi: 10.1200/JCO.2006.10.2871. [DOI] [PubMed] [Google Scholar]
- 14.Escher A, Piotet E, Waridel F, et al. p53 Mutation in histologically normal mucosa of the aero-digestive tract is not a marker of increased risk for second primary carcinoma in head and neck cancer patients. Eur Arch Otorhinolaryngol. 2009;266:547–551. doi: 10.1007/s00405-008-0780-z. [DOI] [PubMed] [Google Scholar]
- 15.Fabricius EM, Gurr U, Wildner GP. Telomerase activity levels in the surgical margin and tumour distant tissue of the squamous cell carcinoma of the head-and-neck. Anal Cell Pathol. 2002;24:25–39. doi: 10.1155/2002/452527. [DOI] [PMC free article] [PubMed] [Google Scholar]
- 16.Ford AC, Grandis JR. Targeting epidermal growth factor receptor in head and neck cancer. Head Neck. 2003;25:67–73. doi: 10.1002/hed.10224. [DOI] [PubMed] [Google Scholar]
- 17.Ishkanian AS, Malloff CA, Watson SK, et al. A tiling resolution DNA microarray with complete coverage of the human genome. Nat Genet. 2004;36:299–303. doi: 10.1038/ng1307. [DOI] [PubMed] [Google Scholar]
- 18.Jong K, Marchiori E, Meijer G, et al. Breakpoint identification and smoothing of array comparative genomic hybridization data. Bioinformatics. 2004;20:3636–3637. doi: 10.1093/bioinformatics/bth355. [DOI] [PubMed] [Google Scholar]
- 19.Khojasteh M, Lam WL, Ward RK, et al. A stepwise framework for the normalization of array CGH data. BMC Bioinformatics. 2005;6:274. doi: 10.1186/1471-2105-6-274. [DOI] [PMC free article] [PubMed] [Google Scholar]
- 20.Koch WM, Boyle JO, Mao L, et al. p53 gene mutations as markers of tumor spread in synchronous oral cancers. Arch Otolaryngol Head Neck Surg. 1994;120:943–947. doi: 10.1001/archotol.1994.01880330029006. [DOI] [PubMed] [Google Scholar]
- 21.Lane PM, Gilhuly T, Whitehead P, et al. Simple device for the direct visualization of oral-cavity tissue fluorescence. J Biomed Opt. 2006;11:024006. doi: 10.1117/1.2193157. [DOI] [PubMed] [Google Scholar]
- 22.Lumerman H, Freedman P, Kerpel S. Oral epithelial dysplasia and the development of invasive squamous cell carcinoma. Oral Surg Oral Med Oral Pathol Oral Radiol Endod. 1995;79:321–329. doi: 10.1016/s1079-2104(05)80226-4. [DOI] [PubMed] [Google Scholar]
- 23.Partridge M, Pateromichelakis S, Phillips E, et al. Profiling clonality and progression in multiple premalignant and malignant oral lesions identifies a subgroup of cases with a distinct presentation of squamous cell carcinoma. Clin Cancer Res. 2001;7:1860–1866. [PubMed] [Google Scholar]
- 24.Pateromichelakis S, Farahani M, Phillips E, et al. Molecular analysis of paired tumours: time to start treating the field. Oral Oncol. 2005;41:916–926. doi: 10.1016/j.oraloncology.2005.05.002. [DOI] [PubMed] [Google Scholar]
- 25.Poh CF, MacAulay CE, Zhang L, et al. Tracing the “at-risk” oral mucosa field with autofluorescence: steps toward clinical impact. Cancer Prev Res (Phila Pa) 2009;2:401–404. doi: 10.1158/1940-6207.CAPR-09-0060. [DOI] [PMC free article] [PubMed] [Google Scholar]
- 26.Poh CF, Ng SP, Williams PM, et al. Direct fluorescence visualization of clinically occult high-risk oral premalignant disease using a simple hand-held device. Head Neck. 2007;29:71–76. doi: 10.1002/hed.20468. [DOI] [PubMed] [Google Scholar]
- 27.Poh CF, Zhang L, Anderson DW, et al. Fluorescence visualization detection of field alterations in tumor margins of oral cancer patients. Clin Cancer Res. 2006;12:6716–6722. doi: 10.1158/1078-0432.CCR-06-1317. [DOI] [PubMed] [Google Scholar]
- 28.Roblyer D, Kurachi C, Stepanek V, et al. Objective detection and delineation of oral neoplasia using autofluorescence imaging. Cancer Prev Res (Phila Pa) 2009;2:423–431. doi: 10.1158/1940-6207.CAPR-08-0229. [DOI] [PMC free article] [PubMed] [Google Scholar]
- 29.Rosin MP, Cheng X, Poh C, et al. Use of allelic loss to predict malignant risk for low-grade oral epithelial dysplasia. Clin Cancer Res. 2000;6:357–362. [PubMed] [Google Scholar]
- 30.Rosin MP, Lam WL, Poh C, et al. 3p14 and 9p21 loss is a simple tool for predicting second oral malignancy at previously treated oral cancer sites. Cancer Res. 2002;62:6447–6450. [PubMed] [Google Scholar]
- 31.Rosin MP, Poh CF, Guillard M, et al. Visualization and other emerging technologies as change makers for oral cancer prevention. Ann N Y Acad Sci. 2007;1098:167–183. doi: 10.1196/annals.1384.039. [DOI] [PubMed] [Google Scholar]
- 32.Schepman KP, van der Waal I. A proposal for a classification and staging system for oral leukoplakia: a preliminary study. Eur J Cancer B Oral Oncol. 1995;31B:396–398. doi: 10.1016/0964-1955(95)00032-1. [DOI] [PubMed] [Google Scholar]
- 33.Scholes AG, Woolgar JA, Boyle MA, et al. Synchronous oral carcinomas: independent or common clonal origin? Cancer Res. 1998;58:2003–2006. [PubMed] [Google Scholar]
- 34.Shin DM, Lee JS, Lippman SM, et al. p53 expressions: predicting recurrence and second primary tumors in head and neck squamous cell carcinoma. J Natl Cancer Inst. 1996;88:519–529. doi: 10.1093/jnci/88.8.519. [DOI] [PubMed] [Google Scholar]
- 35.Silverman S, Gorsky M, Lozada F. Oral leukoplakia and malignant transformation. A follow-up study of 257 patients. Cancer. 1984;53:563–568. doi: 10.1002/1097-0142(19840201)53:3<563::aid-cncr2820530332>3.0.co;2-f. [DOI] [PubMed] [Google Scholar]
- 36.Slaughter DP, Southwick HW, Smejkal W. Field cancerization in oral stratified squamous epithelium; clinical implications of multicentric origin. Cancer. 1953;6:963–968. doi: 10.1002/1097-0142(195309)6:5<963::aid-cncr2820060515>3.0.co;2-q. [DOI] [PubMed] [Google Scholar]
- 37.Tabor MP, Brakenhoff RH, Ruijter-Schippers HJ, et al. Genetically altered fields as origin of locally recurrent head and neck cancer: a retrospective study. Clin Cancer Res. 2004;10:3607–3613. doi: 10.1158/1078-0432.CCR-03-0632. [DOI] [PubMed] [Google Scholar]
- 38.Tsui IF, Rosin MP, Zhang L, et al. Multiple aberrations of chromosome 3p detected in oral premalignant lesions. Cancer Prev Res (Phila Pa) 2008;1:424–429. doi: 10.1158/1940-6207.CAPR-08-0123. [DOI] [PMC free article] [PubMed] [Google Scholar]
- 39.van Houten VM, Leemans CR, Kummer JA, et al. Molecular diagnosis of surgical margins and local recurrence in head and neck cancer patients: a prospective study. Clin Cancer Res. 2004;10:3614–3620. doi: 10.1158/1078-0432.CCR-03-0631. [DOI] [PubMed] [Google Scholar]
- 40.Worsham MJ, Wolman SR, Carey TE, et al. Common clonal origin of synchronous primary head and neck squamous cell carcinomas: analysis by tumor karyotypes and fluorescence in situ hybridization. Hum Pathol. 1995;26:251–261. doi: 10.1016/0046-8177(95)90054-3. [DOI] [PubMed] [Google Scholar]
- 41.Zhang L, Michelsen C, Cheng X, et al. Molecular analysis of oral lichen planus. A premalignant lesion? Am J Pathol. 1997;151:323–327. [PMC free article] [PubMed] [Google Scholar]
- 42.Zhang L, Williams M, Poh CF, et al. Toluidine blue staining identifies high-risk primary oral premalignant lesions with poor outcome. Cancer Res. 2005;65:8017–8021. doi: 10.1158/0008-5472.CAN-04-3153. [DOI] [PubMed] [Google Scholar]