Abstract
The mammalian target of rapamycin (mTOR) and S6 kinase (S6K) pathway is essential for cell differentiation, growth, and survival. Phospholipase D2 (PLD2) plays a key role in mTOR/S6K mitogenic signaling. However, the impact of PLD on mTOR/S6K gene expression is not known. Here we show that interleukin-8 (IL-8) increases mRNA expression levels for PLD2, mTOR, and S6K, with PLD2 preceding mTOR/S6K in time. Silencing of PLD2 gene expression abrogated IL-8-induced mTOR/S6K mRNA expression, whereas silencing of mTOR or S6K gene expression resulted in large (>3-fold and >5-fold, respectively) increased levels of PLD2 RNA, which was paralleled by increases in protein expression and lipase activity. Treatment of cells with 0.5 nm rapamycin induced a similar trend. These results suggest that, under basal conditions, PLD2 expression and concomitant activity is negatively regulated by the mTOR/S6K signaling pathway. Down-regulation of PLD2 was confirmed in differentiated HL-60 leukocytes overexpressing an mTOR-wild type, but not an mTOR kinase-dead construct. At the cellular level, overexpression of mTOR-wild type resulted in lower basal cell migration, which was reversed by treatment with IL-8. We propose that IL-8 reverses an mTOR/S6K-led down-regulation of PLD2 expression and enables PLD2 to fully function as a facilitator for cell migration.
Keywords: Chemokines, Enzyme Mechanisms, Leukocyte, Lipase, Neutrophil
Introduction
Phospholipase D (PLD)3 catalyzes the hydrolysis of the terminal diester bond of glycerophospholipids resulting in the formation of phosphatidic acid (PA) plus a related base in cell membranes. Two different genes encoding for mammalian phospholipase D exist: PLD1 and PLD2 (1–2). PLD-generated PA is a second messenger involved in mitogenesis, cell growth, and migration (3–6). Most significant effects of elevated PLD activity are mediated by targets of PA (6). Although several of these have been identified (7), we will concentrate on two of them, the mammalian target of rapamycin (mTOR) (8) and S6 kinase (S6K) (9). PA binds mTOR and activates it (8, 10). PA also binds and activates S6K independently of mTOR (9). Regardless, mTOR and/or S6K phosphorylates downstream targets resulting in the modulation of diverse cellular functions such as survival, cell migration and growth, and proliferation (6, 8, 10–12).
IL-8 is a potent chemoattractant that elicits cell migration in neutrophilic HL-60 cells (13), T lymphocytes, monocytes, and natural killer cells (14–18). The PLD2 isozyme appears to be a functional target of IL-8-mediated activation of both CXCR1 and CXCR2, the two known receptors for IL-8 (14, 19). PLD-derived PA mediates cell migration as well as mTOR/S6K activation (8–10, 14). Indeed, the relevance of mTOR in cell migration and inflammation has been recently reported for T lymphocytes (20), macrophages (21), and neutrophils (22). Furthermore, leukocyte chemotaxis is inhibited by the macrolide immunosuppressant rapamycin, a specific inhibitor of the mTOR/S6K pathway (23).
The impact of the mTOR/S6K signaling cascade and the role of this pathway on PLD function have not been investigated yet. This is important, because many tissues suffering from diverse pathological conditions are characterized by elevated IL-8.
Although it is known that the product of PLD action, PA, activates the kinases at hand in the present study (mTOR and S6K), we provide evidence for the first time of regulatory signals taking place in the upstream (or reverse) direction of the cascade PLD2 → mTOR/S6K. mTOR and S6K keep PLD function down-regulated in basal conditions, and they do so by affecting its level of gene expression. Further, IL-8 reverses this process and enables PLD to fully function as a facilitator for cell migration.
EXPERIMENTAL PROCEDURES
Materials
HL-60 cells were purchased from American Type Culture Collection (ATCC, Rockville, MD). For selected experiments, COS-7 cells were used, and they were also purchased from ATCC. mTOR, PLD2, and S6K TaqMan gene expression assays were purchased from Applied Biosystems (Foster City, CA). Protease Inhibitor mixture set III, microcystin-LR, and K-LISA mTOR activity kit were purchased from EMD (Gibbstown, NJ). Dulbecco's modified Eagle's medium was purchased from Cellgro (Herndon, VA). HA tag (6E2) mouse monoclonal antibody was purchased from Cell Signaling Technology (Danvers, MA). Trichromranger prestained molecular weight marker mix, 4–20% Precise Protein gels, and Scintiverse II scintillation mixture were obtained from Fischer Scientific (Chicago, IL). Enhanced chemiluminescence (ECL) Western blotting detection reagents were purchased from Amersham Biosciences. phCMV2-HA vector (4.26 kb) was purchased from Gene Therapy Systems (San Diego, CA). Various PCR primers were purchased from Integrated DNA Technologies Inc. (Coralville, IA). Lipofectamine, Plus Reagent, Opti-MEM reduced serum medium, Quant-iT Ribogreen RNA assay kit, dNTPs, SuperScript II reverse transcriptase, random primers, single strand reverse transcriptase buffer, RNase out, Deoxyribonuclease I, and dithiothreitol were purchased from Invitrogen. UltraClean Plasmid Prep Kit was purchased from Mo-Bio Laboratories, Inc. (Carlsbad, CA). Quick Ligation Kit, Taq DNA polymerase and ThermoPol Buffer, restriction enzymes and their buffers, Lambda DNA-HindIII Digest, and Antarctic phosphatase were purchased from New England Biolabs Inc. (Ipswich, MA). Homo sapiens FK506-binding protein 12-rapamycin-associated protein 1 cDNA clone (also known as mTOR) was purchased from OriGene Technologies, Inc. (Rockville, MD). [γ-32P]ATP (500 μCi) was purchased from PerkinElmer Life Sciences. RNeasy minikit, QIAquick gel purification kit, and QIAprep Spin Miniprep kit were purchased from Qiagen (Valencia, CA). 4E-BP1 (FL), α-Myc-TRITC IgG antibody and α-HA-FITC IgG antibody purchased from Santa Cruz Biotechnology, Inc. (Santa Cruz, CA). Monoclonal anti-HA, influenza hemagglutinin protein (HA tag), and influenza hemagglutinin (HA) peptide were purchased from Sigma. QuikChange XL site-directed mutagenesis kit, 96-well PCR plates, DH5α-competent cells, and Brilliant II QPCR master mix were purchased from Stratagene (La Jolla, CA.). ExoSAP-IT, DNA Ladder (1 kb), and agarose were from USB Corp. (Cleveland, OH). Vectashield mounting medium was purchased from Vector Laboratories (Burlingame, CA). Ion-exchange chromatography cellulose phosphate paper was purchased from Whatman (Hillsboro, OR).
Genesis of HA-tagged pCMV6-mTOR from pCMV6-XL4-mTOR-WT
The starting material was the expression plasmid construct containing the H. sapiens FK506-binding protein 12-rapamycin associated protein 1 cDNA (from OriGene Technologies, Inc., Rockville, MD). This 13,394-bp plasmid (pCMV6-XL4-mTOR) did not contain any sequences for a tag, and thus the mTOR insert was removed, mutated, and spliced into a phCMV2-HA vector. Mutagenic primers were designed to introduce new restriction sites into the phCMV6-XL4-mTOR plasmid. The newly mutated plasmid was named pCMV6-mTOR. The primers for the construction of phCMV2-HA from pCMV6-XL4-mTOR were as follows: “mTOR-Mfe-HindIII”: sense (5′-GAGGCCTTGGCCGAAGCCGCGCCAATTGCAGGGCAAGCTTCTTGGAACCGGACCTGCCGCCGC-3′) and antisense (5′-GGCGGCGGCAGGTCCGGTTCCAAGAAGCTTGCCCTGCAATTGGCGCGGCTTCGGCCAAGGCCTC-3′). Two new restriction sites (HindIII and MfeI) were introduced that allowed for removal of the mTOR insert and ligation into the phCMV2-HA vector. The sequence underlined and in bold above is the HindIII point mutation. The sequence underlined and in italics represents the MfeI mutation. After mutation, digestion with HindIII and the NotI, a site that was already present in the mTOR sequence, released the mTOR insert from the pCMV6 backbone and allowed for purification of the sequence.
The newly mutated plasmid was named pCMV6-mTOR. The PCR primers against phCMV2-HAmTOR-WT to enable sequencing of the ligation site near the HA tag were as follows: “HAmTOR-535”: sense (5′-AATGGGCGTGGATAGCGGTTTGAC-3′) and antisense (5′-CTAGATGTGGTGGCAGCGGTGGTG-3′); “HAmTOR-716”: sense (5′-GCAAATGGGCGGTAGGCGTGTA-3′) and antisense (5′-ACTGGGTCATTGGAGGGGAGGAGGTTC-3′). The mTOR insert was next removed from pCMV6-mTOR and purified to be used in ligation. This was accomplished through a HindIII/NotI double enzyme digestion of pCMV6-mTOR. The resulting 8633-bp HindIII-mTOR-NotI fragment was to phCMV2-HA, and the newly formed plasmid (phCMV2-HAmTOR-WT, kanamycin-resistant) was sequence-verified.
Generation of a Mutated mTOR Plasmid (mTOR-D2357E “Kinase Dead”)
The newly generated phCMV2-HAmTOR-WT was further mutated to provide a “kinase-dead” plasmid. By site-directed mutagenesis, a point mutation was added, with additional restriction sites to the phCMV2-HAmTOR-WT construct (Table 1). Previously Vilella-Bach et al. (24) described a kinase-dead mutant produced by mutating the aspartic acid at position 2357 to a glutamic acid. The mutagenesis primers were as follows: “mTOR-D2357E”: sense (5′-GATCCTGCACATTGAATTCGGGGACTGCTTTG-3′) and antisense (5′-CAAAGCAGTCCCCGAATTCAATGTGCAGGATC-3′).
TABLE 1.
Key features of HA-mTOR constructs
The table includes sites added, the amino acid that was present prior to and after mutation, the mutation position, and the stock concentration and purity of the constructs (WT and kinase-dead mutant). The phCMV2-HAmTOR-WT is the parental plasmid.
| Plasmid | phCMV2-HAmTOR- |
|
|---|---|---|
| WT | D2357E | |
| Mutation present | None | Kinase-dead |
| Restriction site added | N/A | EcoRI |
| Amino acid prior to mutation | N/A | Aspartic acid |
| Amino acid after mutation | N/A | Glutamic acid |
| Mutation position | N/A | 2357 |
| Stock concentration | 400 ng/ml | 250 ng/ml |
| Purity (260/280) | 1.8 | 1.83 |
PLD Enzyme Activity
PLD enzymatic activity was quantified by an immunocomplex assay as reported previously (25) with some modifications. Cells were resuspended in 0.2 ml of a diluted Triton X-100-based lysis buffer to preserve enzyme activity (5 mm HEPES, pH 7.8, 100 μm sodium orthovanadate, 1 μm leupeptin, 768 nm aprotinin, and 0.5% Triton X-100) and sonicated briefly. Samples were immunoprecipitated overnight with anti-PLD2 antibodies, and the resulting immunocomplex beads were added to 1.5-ml Eppendorf tubes containing (final concentrations): 3.5 mm PC8 phospholipid, 45 mm HEPES, pH 7.8, and 1 μCi of [3H]butanol in a liposome form. Samples were incubated for 20 min at 30 °C with continuous shaking. Lipids were isolated and [3H]phosphatidyl-butanol was resolved by TLC. Silica gel sections that migrated with PBut authentic standards were counted by scintillation spectrometry. Controls were run in parallel with all reagents except PC8, and counts were subtracted from test samples.
mTOR Enzyme Activity
Enzyme activity of mTOR was based on its ability to phosphorylate 4E-BP1 protein using radiolabeled [γ-32P]ATP (adapted from Kim et al. (26)). COS-7 cell lysates overexpressing mTOR were immunoprecipitated with HA-agarose beads. Resulting immunocomplexes were resuspended in kinase buffer (50 mm HEPES-KOH (pH 7.4), 100 mm KCl, 40% glycerol, 20 mm MgCl2, 8 mm MnCl2, 2 mm dithiothreitol), and the immunoprecipitation reactions were incubated with 4E-BP1 protein in the presence of 2 μCi of [γ-32P]ATP/ml and 100 μm unlabeled ATP per reaction. Positive controls used p70 S6K (T412E, Upstate Biotechnology, Lake Placid, NY), an active kinase, and revealed a large amount of autophosphorylation, whereas 4E-BP1 did not have autophosphorylation abilities. Negative controls had no peptide substrate in the reaction mixture. Incorporation of [γ-32P]ATP into 4E-BP1 was quantified by liquid scintillation.
Real-time (Quantitative) Reverse Transcription-PCR
Total RNA was isolated from dHL-60 cells with the RNeasy minikit. RNA concentrations were determined by fluorometric assay with Packard's Fusion and Ribogreen RNA Quantitation Kit, and samples were normalized to 20 ng/μl RNA. Reverse transcription was performed with 210 ng of RNA, 210 ng of random hexamers, 500 μm dNTPs, 84 units of RNase OUT, and 210 units of Moloney murine leukemia virus reverse transcriptase and incubated at 42 °C for 55 min. Quantitative PCR reactions were run with 30 ng of total input RNA (5 μl), 2 μl of the PLD2 gene expression assay (6-carboxyfluorescein (FAM)-labeled) multiplexed with the housekeeping gene (β-tubulin, Texas Red-labeled) with the final concentrations being 200 and 400 pmol for the primers and probe, respectively. Sequences are in Table 2. Primers and fluorescent probes were synthesized by Integrated DNA Technologies. Quantitative PCR conditions for the Stratagene Cycler were: 95 °C for 3 min and then 50 cycles of the next 3 steps: 30 s 95 °C, 1 min 60 °C, and then 1 min 72 °C. The “cycle threshold” Ct values were chosen from the linear part of the PCR amplification curve where an increase in fluorescence can be detected at >10 S.E. above the background signal. ΔCt was calculated as: ΔCt = Avg. PLD Ct − Avg. Housekeeping Ct, and gene -fold expression was calculated as 2−(ΔΔCt) = 2−(experimental condition ΔCt − control ΔCt).
TABLE 2.
The sequence of probes used in quantitative reverse transcription-PCR
| qRT-PCR probes | Probe sequence |
|---|---|
| PLD1 | FAM-5-CGA AAA GCA CAA CAA GGA GTG AGG A |
| PLD2 | FAM-5-CCT TGG CCC GGT GGT TTG TGA ATG G |
| mTOR(FRAP1) | FAM-5-TCA CCC TCA TGA GAG AAT TCT GGG T |
| p70S6K | FAM-5-AAG ACA CTG CCT GCT TTT ACT TGG C |
Peripheral Blood Neutrophils, HL-60 Cell Differentiation, and Plasmid Transfection
Neutrophils were isolated from peripheral blood of volunteer donors, who signed an institutional review board-approved consent form. Promyelocytic leukemic HL-60 cells were grown at 37 °C in a 5% CO2 incubator in Iscove's modified Eagle's medium plus 20% (v/v) heat-inactivated fetal bovine serum, 2 mm l-glutamine. Cell density was maintained between 0.1 and 1.0 × 10⁶/ml. HL-60 cells were induced to differentiate (to “dHL-60”) with 1.75% (v/v) DMSO for 3–4 days to achieve expression of the neutrophilic phenotype. Viability assays were routinely conducted with 0.4% trypan blue stain in cell preparations prior to all analyses and were >95%. The assessment of cell differentiation was performed by flow cytometric analysis of surface expression of differentiation-related antigens as indicated in (27). One day after induction of differentiation, cells were transiently transfected with plasmid constructs by nucleofection (see below).
Gene Expression Silencing and Nucleofection
Two different sets of silencing siRNAs (one each for a particular exon) from Ambion (Austin, TX) (“Silencer Pre-designed”) for mTOR and S6K1 were used, and two different sets of silencing siRNAs (one each for a particular exon) from Dharmacon (La Fayette, CO) (“SMARTselection”) for PLD2 were used. All siRNA sequences used are given in Table 3. A negative control for siRNA was also from Ambion. Neg-siRNA#2 is a 19-bp scrambled sequence with 3′-dT overhangs (sequence not disclosed by Ambion). This scrambled, negative control is certified not to have significant homology to any known gene sequences either from mouse, rat, or human and does not cause significant changes in gene expression of transfected cells after 48 h when used at the same concentration as the siRNA in test. The protocol for gene silencing involved first induction of differentiation of HL-60 cells with 1.75% DMSO on day 0. Then, on day 1, cells were transfected with siRNA. To initiate the transfection, siRNA was mixed with Opti-MEM and incubated at room temperature for 5 min. siRNAs were added to an Amaxa (Gaithersburg, MD) electroporation cuvette with 2 × 10⁶ HL-60 cells/100 μl in nucleofector solution V. Cells were “electroporated” in program T-019 (as per the manufacturer's instructions) after which they were resuspended in 1 ml of Iscove's modified Eagle's medium plus 20% fetal bovine serum plus 1.75% DMSO (to allow cells to continue differentiation). Cells were immediately plated into 6-well plates and incubated at 37 °C for 48 h to allow for maximum gene expression silencing. Lastly, on day 3 the cells were harvested and used for the experiments described herein.
TABLE 3.
The sequence of siRNAs used for silencing PLD2, mTOR, and S6K
| siRNA sequences | |
|---|---|
| siPLD2 | Exon #1: 5′-GGACAACCAAGAAGAAAUAUUtt-3′; Exon #4: 5′-GACCUGCACUACCGACUGAUUtt-3′ |
| simTOR | Exon #12: 5′-GCUCGUAAGUUGGGAUAACAtt-3′; Exon #15: 5′-CAUUCGCAUUCAGUCCAUAtt-3′ |
| siS6K | Exon #2: 5′-GGACAUGGCAGGAGUGUUUtt-3′; Exon #3: 5′-GGUUUUUCAAGUACGAAAAtt-3′ |
Immunofluorescence Microscopy
Transfected COS-7 cells were fixed on glass coverslips by adding 1 ml of 4% paraformaldehyde to each coverslip. After a 10-min incubation period at room temperature, paraformaldehyde was aspirated and cells were permeabilized with 1 ml of 0.5% Triton X-100 in PBS. Permeabilized cells were incubated at room temperature for another 10 min. Cells were then blocked with 1 ml of 10% fetal bovine serum in 0.1% Triton X-100 in PBS. Cells were incubated at room temperature for 4 h and then with a FITC-conjugated anti-HA antibody in blocking buffer solution (1:1000). The 6-well plate was then covered and stored in the dark at 4 °C overnight. Any excess antibody was aspirated from the coverslips, and then the coverslips were washed with 1 ml of PBS. Probing with 1:200 TRITC-Phalloidin dye followed. After aspiration of anti-TRITC, 1 ml of 1:2000 4′,6-diamidino-2-phenylindole dye in PBS was used to stain nuclei. Coverslips were incubated at room temperature for 5 min in the dark. 4′,6-Diamidino-2-phenylindole was aspirated, and coverslips were washed 3× with PBS. Coverslips were rinsed with ddH20 and allowed to air dry. Coverslips were mounted, cell side down onto a glass microscope slide, with a drop of Vectashield mounting medium between the coverslip and slide. An Olympus Fluoview Laser scanning confocal microscope with a 60× objective was used to view the slides. Images were captured and analyzed using MetaView v.6.0 software from Universal Imaging Co.
Statistical Analysis
Data are presented as the mean ± S.E. The difference between means was assessed by the single factor analysis of variance (ANOVA) test. A probability of p < 0.05 was considered to indicate a significant difference.
RESULTS
IL-8 Increases PLD2, mTOR, and S6K Transcript Levels in HL-60 Cells
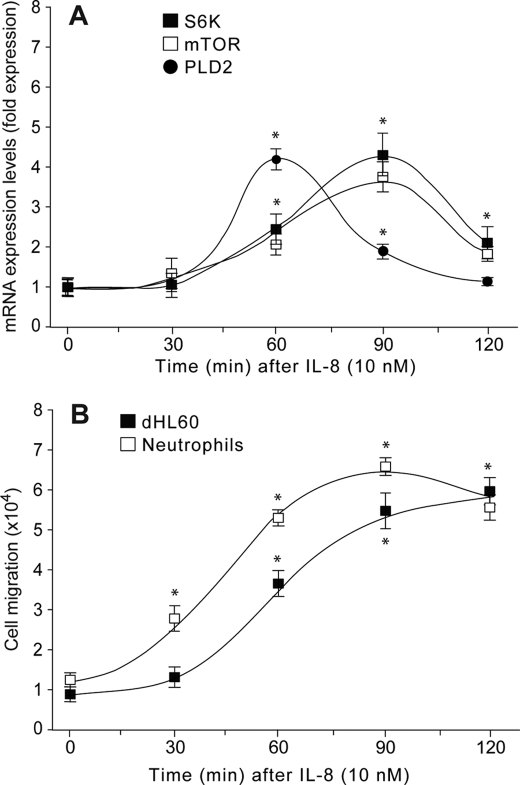
We have used reverse transcription coupled to real-time PCR to quantify the effects of IL-8 on endogenous PLD2, mTOR, and S6K gene expression as a function of time in differentiated HL-60 leukemic cells. A fast (<2 h) up-regulation of PLD2, mTOR, and S6K expression was observed upon stimulation of HL-60 cells with IL-8 (Fig. 1A). However, PLD2 and mTOR/S6K mRNA expression followed a different kinetic in response to IL-8, with PLD2 preceding mTOR/SK6 by ∼30 min, suggesting that mTOR/S6K up-regulation might be the result of increased PLD2 function. As demonstrated earlier (14), PLD mediates chemotaxis in leukocytes and as such, we chose to concentrate on cell migration for the study of a cellular function triggered by PLD. At the cellular level, dHL-60 cells migrated toward IL-8 (Fig. 1B) following a kinetic that looked like the sum total of mTOR/S6K and PLD2 previously observed in Fig. 1A. These results suggest that IL-8-mediated up-regulation of PLD2 modulates mTOR/S6K mRNA expression resulting in increased cell migration.
FIGURE 1.
RNA expression of PLD2, mTOR, and S6K are up-regulated by IL-8, with PLD2 preceding mTOR/S6K. A, endogenous expression of PLD2, mTOR, and S6K in the presence of IL-8 as a function of time. Total RNA was extracted from dHL-60 cells, reverse transcribed to cDNA, and probed with 6-carboxyfluorescein (FAM)-tagged PLD2, mTOR, or S6K primers. Gene -fold expression was calculated from ΔCt as indicated under “Experimental Procedures” (error bars are S.E. with n = 4 in duplicate). Asterisks denote statistically significant (p < 0.05) differences to controls (zero time) by ANOVA. B, analysis of cell migration of neutrophils and neutrophil-like, differentiated, dHL-60 cells in response to IL-8 performed in 6.5-mm Transwell plates. Cells that migrated to the bottom wells after 90 min were counted. Results are the mean ± S.E. from four independent experiments conducted in duplicate. *, differences statistically significant (p < 0.05, ANOVA) between control (time zero) and several times after IL-8 stimulation.
PLD2 Silencing Abrogates IL-8-induced mTOR/S6K mRNA Up-regulation in HL-60 Cells
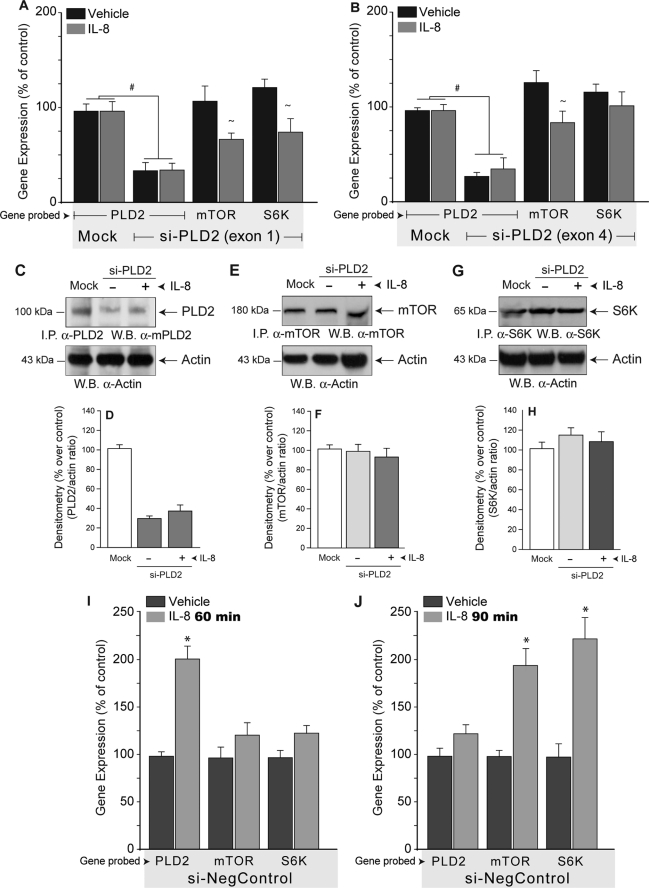
Increased PLD2 mRNA expression levels correlates with increased PLD activity and PA production in many cell types (6). Further, we have demonstrated that PLD2-derived PA increase migration of HL-60 cells overexpressing PLD2 (9, 14). However, the relationship between PLD2 and mTOR/S6K mRNA expression is not known. To determine if basal levels of endogenous expression of PLD2 is related to mTOR/S6K mRNA expression, PLD2 transcripts were silenced in dHL-60 cells by using two synthetic siRNAs directed to specific sequences of PLD2 (see Table 3). As shown in Fig. 2, ∼75% silencing of PLD2 transcripts is able to abolish the stimulatory effect of IL-8 on mTOR/S6K mRNA expression (compare Fig. 2, A and B, with Fig. 1A) regardless of the exon targeted by si-PLD2. It is important to note that basal endogenous levels of mTOR/S6K mRNA expression did not change in response to PLD2 silencing. This effect was also observed at the protein level in HL-60 cells where silencing of PLD2 did not change either basal or IL-8-stimulated mTOR/S6K protein levels (Fig. 2, C–H). Whereas there is a >70% inhibition of protein expression in PLD2 due to si-PLD2 silencing (Fig. 2, C and D), the levels of proteins for mTOR (Fig. 2, E and F) and S6K (Fig. 2, G and H) are not affected. There is also no significant difference between cells treated with IL-8 or vehicle, after siPLD2 silencing, in mTOR or S6K expression.
FIGURE 2.
Silencing of PLD2 results in small changes in S6K and mTOR expression. PLD2-siRNA against exon 1 (A) or against exon 4 (B) or just transfection reagents, no siRNA (“Mock”) was transfected into dHL-60 cells for 3 days, after which time, cells were incubated in the presence or absence of IL-8. RNA was isolated and used to analyze gene expression by quantitative reverse transcription-PCR. Results are the mean ± S.E. from three independent experiments conducted in duplicate. The symbols # and ∼ denote statistically significant (p < 0.05) differences between mock and si-PLD2, or between unstimulated and IL-8-stimulated samples, respectively. In C, E, and G PLD2-siRNA (exon 1)-transfected dHL-60 cells were lysed and electrophoresed, and blots were subsequently probed by either anti-PLD2 (C), anti-mTOR (E), or anti-S6K (G) antibodies (as well as with anti-actin to demonstrate equal loading of all gel lanes). D, F, and H are densitometries of C, E, and G gels and others with similar results. I and J, dHL-60 cells transfected with control, scrambled RNA (“si-NegControl”) and stimulated with IL-8 for either 60 min (I) or 90 min (J). Results are the mean ± S.E. from three independent experiments conducted in duplicate. *, differences statistically significant (p < 0.05, ANOVA) between control and IL-8-stimulated samples.
An important control was needed: to ascertain if a negative control siRNA (“scrambled”) would affect IL-8-led expression. This experiment was performed at two time points of IL-8 stimulation (1 and 1.5 h). The results are presented in Fig. 2 (I and J) and indicate that cells transfected with control-siRNA show no altered expression of PLD2, mTOR, or S6K, at time points where stimulation is maximum (as seen in Fig. 1A). In other words, at 1-h stimulation with IL-8 there is robust stimulation of gene expression of PLD2 even in the presence of control-siRNA (Fig. 2I). Then, at 1.5 h this stimulation subsides and mTOR and S6K transcripts are the ones that increase, even in the presence of control-siRNA (Fig. 2J). Together, these results suggest that mTOR/S6K mRNA up-regulation and cell migration in response to IL-8 requires basal expression and functional levels of PLD2.
mTOR/S6K Silencing Up-regulates PLD2 mRNA Expression and Activity
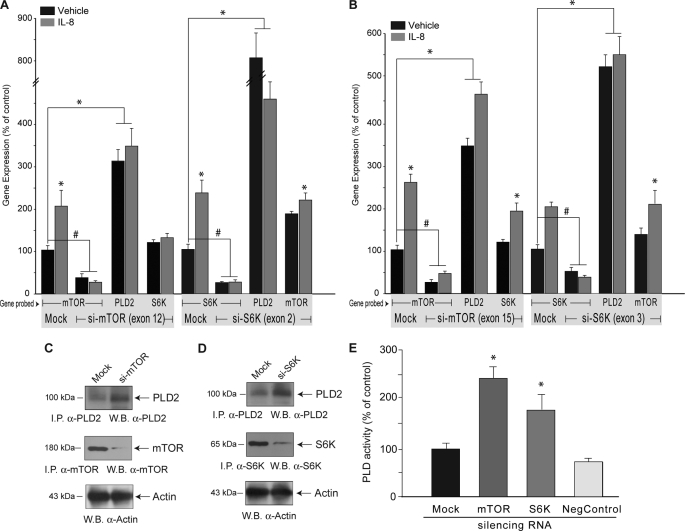
PA activates mTOR and S6K (8–9). However, the converse (i.e. the impact of S6K/mTOR activation on PLD activity) needed to be studied further. To determine if inhibition of mTOR/S6K activity regulates PLD2 mRNA levels, we first silenced mTOR/S6K gene expression via RNA-mediated interference. As shown in Figs. 3A and 3B 70–80% silencing of mTOR (left group of bars in panels A or B) resulted in large (>3-fold increased levels of PLD2 RNA. This was observed for two different siRNA sets targeting different exons and thus it ruled out off-target effects. Similarly, and as shown in Figs. 3A and 3B (right group of bars), 70–80% silencing of S6K resulted in also large (5–8-fold) increased levels of PLD2 RNA. This, also, was observed for two different siRNA sets targeting different exons. The increase in PLD2 transcript levels observed post mTOR/S6K silencing correlated with increased PLD2 protein levels (Fig. 3, C and D) and increased total PLD activity (Fig. 3E).
FIGURE 3.
Silencing of S6K or mTOR up-regulates PLD2 expression. PLD2-siRNA against exon 12 for mTOR and against exon 2 for S6K (A) or against exon 15 for mTOR and against exon 3 for S6K (B) or just transfection reagents, no siRNA (“Mock”) was transfected into dHL-60 cells for 3 days, after which time, cells were incubated in the presence or absence of IL-8 and used for analysis of gene expression. Results are the mean ± S.E. from three independent experiments conducted in duplicate. The symbols * and # denote statistically significant (p < 0.05) differences between control and IL-8-stimulated samples, and between control and silenced samples, respectively. A set of samples from A was also used for immunoprecipitation and immunoblotting with the indicated antibodies (C and D), and another one was used for the measurement of PLD activity in liposomes (E). 100% values represent 2,108 ± 154 dpm/mg for PLD activity. Results are the mean ± S.E. from three independent experiments conducted in duplicate. *, differences statistically significant (p < 0.05, ANOVA) with respect to mock control.
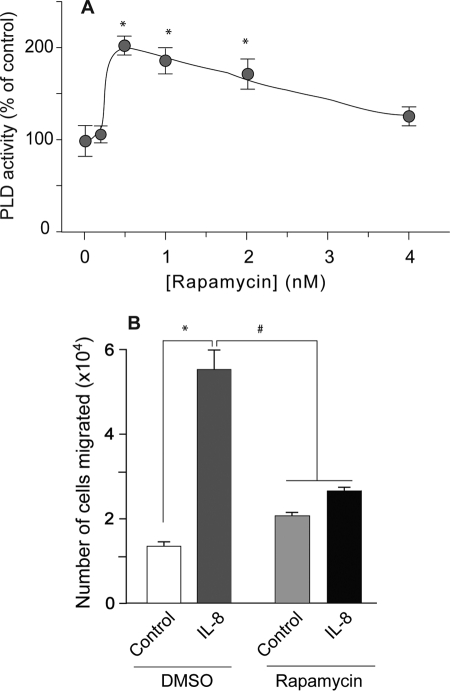
To ascertain if functional mTOR/S6K signaling is required for PLD2 mRNA expression and function, we pharmacologically blocked the mTOR/S6K signaling pathway with 1 nm rapamycin. As shown in Fig. 4A, rapamycin treatment resulted in increased basal PLD activity in dHL-60 cells. Increased PLD activity correlates with increased cell migration in response to IL-8 (14). However, rapamycin-mediated mTOR/S6K inhibition did not correlate with increased cell migration in response to IL-8 (Fig. 4B) suggesting that PLD2-mediated cell migration depends on functional mTOR/S6K signaling.
FIGURE 4.
Rapamycin inhibits PLD2-induced cell migration implicating mTOR/S6K signaling. A, dHL-60 neutrophil-like cells were incubated with the indicated concentrations of rapamycin for 20 min and then used for the measurement of PLD activity in liposomes. B, cells were preincubated with 1 nm rapamycin prior to taking cells to Transwells and measuring cell migration against IL-8 as chemoattractant. Results are the mean ± S.E. from three independent (A) and four experiments (B) conducted in duplicate. The symbols * and # denote values higher or lower than the controls, respectively, statistically significant (p < 0.05, ANOVA).
Overexpression of mTOR Negatively Regulates Basal PLD2 Gene Expression
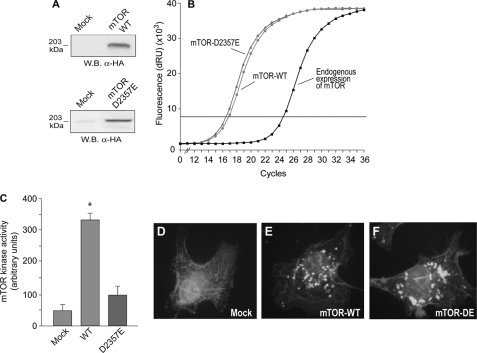
As we have just shown, either molecular silencing or pharmacological inhibition of mTOR resulted in increased PLD2 function. The possibility that overexpression of mTOR negatively regulates PLD2 gene expression was investigated next. First, we designed and fully characterized two mTOR expression constructs encoding for HA-tagged mTOR-WT and mTOR-D2357E (kinase dead, see “Experimental Procedures”). These vectors were transfected into COS-7 cells and after 48 h, mTOR protein levels, activity, localization, and mRNA abundance were determined. As shown in Fig. 5 (A and B), HA-tagged mTOR WT and D2357E protein and transcript, respectively, were efficiently detected in transfected cells. Moreover, cells transfected with mTOR WT, but not with mTOR D2357E, resulted in increased total mTOR kinase activity (Fig. 5C). Thus, overexpression of mTOR WT results in increased mTOR kinase activity, whereas no change in basal mTOR kinase activity was observed after overexpression of the kinase-dead version of mTOR (D2357E). Further, transfection of COS-7 cells with mTOR WT or D2357E constructs resulted in similar intracellular localizations (Fig. 5, E and F).
FIGURE 5.
Characterization of new mTOR constructs (wild type and “kinase dead” mutant). dHL-60 cells were nucleofected with mTOR-WT or mTOR-D2357E mutant for 2 days. Protein expression was ascertained in Western blots (A); gene expression was derived from quantitative PCR (B). mTOR kinase activity was measured in dHL-60 cells, in vitro by phosphorylation of 4E-BP1 (C). For microscopy, COS-7 cells were used, that were mounted in microscope slides, fixed, and immunolabeled with anti-mTOR antibodies (D–F). They were further treated with FITC-conjugated secondary antibodies, and finally observed by fluorescence microscopy. Shown are representative fields among 10 observed with similar patterns. *, statistically significant (p < 0.05) differences with respect to mock control.
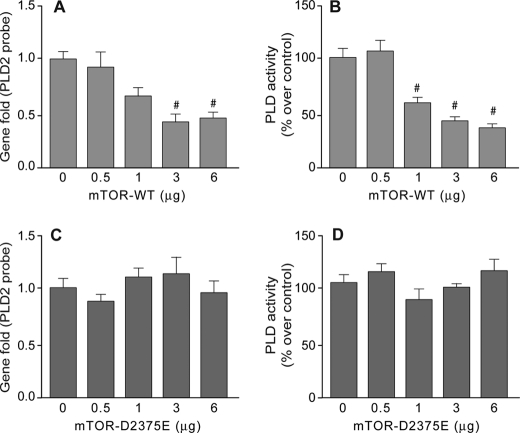
With the new biological tools in hand, the hypothesis that mTOR overexpression down-regulates PLD2 function was tested in dHL-60 cells transfected with HA-tagged mTOR WT or D2375E constructs. As shown in Fig. 6(A and B), increased amounts of transfected mTOR WT constructs resulted in decreased expression levels of PLD2 mRNAs and activity, respectively. To ascertain that this negative effect of mTOR over basal PLD2 mRNA expression levels and activity is due to mTOR kinase activity, we transfected cells with the kinase-dead version of HA-tagged mTOR D2375E. As shown in Fig. 6 (C and D), mTOR D2357E overexpression did not result in changes in PLD2 mRNA levels or activity. Taken together, these results suggest that intact mTOR kinase activity regulates basal levels of PLD2 expression.
FIGURE 6.
Correlation between gene expression and PLD activity in mTOR-overexpressing cells. mTOR, wild type (A and B) or mutant (C and D) were transfected into dHL-60 cells at the indicated concentrations of DNA per cell well. After expression was allowed to proceed for 2 days, cells were divided in two sets. One set (A and C) was used for the analysis of gene expression by quantitative PCR, and the other set (B and D) was used for the measurement of PLD activity in liposomes. Results are the mean ± S.E. from three independent experiments. #, differences statistically significant (p < 0.05, ANOVA) with respect to no DNA controls.
IL-8 Rescues mTOR-induced Down-regulation of PLD2
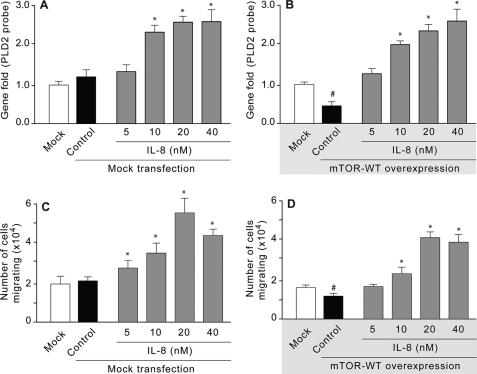
We next tested the role of IL-8 on PLD2 gene expression and migration in dHL-60 cells overexpressing mTOR WT. A preliminary set of control experiments were run. First, study of PLD2 expression in mock transfected cells (Fig. 7A) and second, mock transfected cell migration (Fig. 7C). These experiments indicated that neither PLD2 expression nor cell migration was affected in mock transfected cells, and, as expected, IL-8 is still able to increase PLD2 transcripts and cell migration in a dose-dependent manner. The test experiments were then run. As shown in Fig. 7 (B and D), IL-8 rescued PLD2 mRNA down-regulation and cell migration mediated by mTOR overexpression suggesting that IL-8 can overcome the inhibitory actions of mTOR overexpression on PLD2 expression and function and PLD2-mediated cell migration.
FIGURE 7.
IL-8 rescues mTOR-mediated PLD2-down-regulation. A and C are controls of mock transfected dHL-60 cells (no RNA, just transfection reagents) that were used for gene expression analysis (A) or for chemotaxis (B). B and D, dHL-60 cells overexpressing mTOR-WT were used for either gene expression analysis (B) or for cell chemotaxis in Transwell (D). In addition to showing the rescue effects of IL-8, the figure indicates that IL-8-mediated PLD2 expression requires mTOR and that chemotaxis correlates with the presence of absence of PLD2. Results are the mean ± S.E. from three independent (B and D) and two experiments (A and C) conducted in duplicate. The symbols * and # denote values higher or lower than the controls, respectively, statistically significant (p < 0.05, ANOVA).
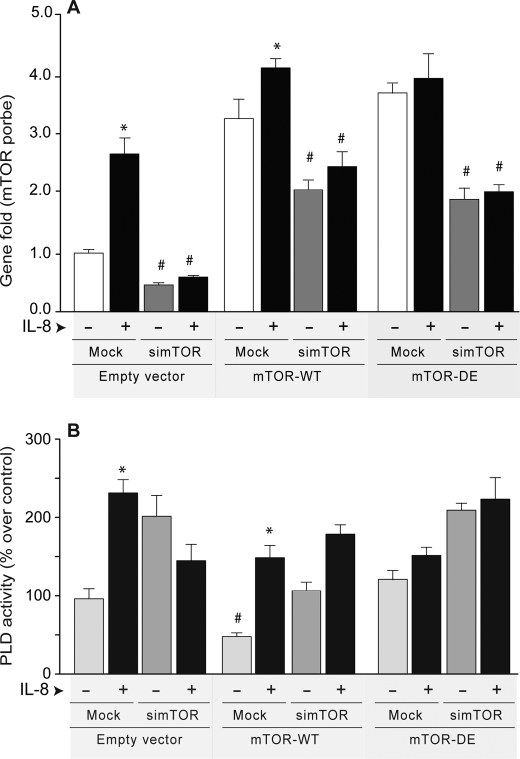
A rescue experiment was conducted next. Cells silenced with si-mTOR or mock silenced were transfected with either an empty vector (pCMV6 backbone used in mTOR cloning), mTOR-WT, or mTOR-DE (kinase dead), and gene expression and lipase activity were analyzed. As indicated in Fig. 8, IL-8 induced a ∼2-fold increase of gene expression in mock transfected cells and a ∼2.3-fold increase in PLD activity in cells transfected with an empty vector. As for cells transfected with mTOR the increases are not quite as robust, due to the fact that the levels of mTOR expression were already extremely high. The levels of expression of mTOR whether WT or dead mutant DE are approximately the same (compare bars in the center and bars on the right hand side of Fig. 8A), because quantitative PCR measures only transcripts. When PLD activity is considered (Fig. 8B), the two groups of bars are not the same, as they should not necessarily be, because mTOR-DE does not activate PLD.
FIGURE 8.
Silencing of mTOR results in reduction of mTOR expression that cannot be overcome by IL-8. dHL-60 cells silenced with si-mTOR or mock silenced were transfected with either an empty vector (pCMV6 backbone used in mTOR cloning), mTOR-WT, or mTOR-DE (kinase dead). After two additional days, cells were used for either gene expression analysis (A) or for PLD activity in liposomes (B). The figure shows that transfection of silenced cells with large amounts of DNA (6 μg) partially negates the silencing effect of siRNA mTOR enough to observe effects on PLD activity. Results are the mean ± S.E. from three independent experiments conducted in duplicate. The symbols * and # denote values higher (IL-8) or lower (silencing) than the controls, respectively, statistically significant (p < 0.05, ANOVA).
Importantly, Fig. 8 also shows that IL-8 could not overcome mTOR silencing (Fig. 8A). On the other hand, transfection of silenced HL-60 cells with large amounts of plasmid DNA (6 μg/well) partially negated the silencing effect of siRNA mTOR, enough to observe effects on PLD activity (Fig. 8B). mTOR silencing increased PLD activity, an effect that was abrogated by overexpressing mTOR. This effect was dependent on the activity of the kinase, whereas the effect of mTOR was negated by IL-8.
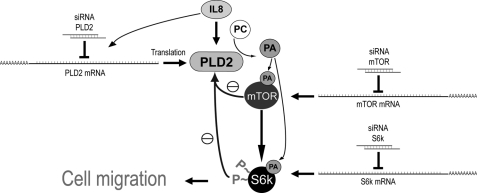
In summary, the seminal observation for this report is that overexpression of mTOR decreases PLD2 function via down-regulation of its transcripts. Transfection of the newly generated biological mTOR construct reduces PLD2 expression and its activity both of which are dependent on the kinase activity of mTOR. IL-8 rescues PLD2 down-regulated expression due to mTOR. IL-8-mediated PLD2 expression requires mTOR and chemotaxis correlates with the presence or absence of PLD2. Silencing of mTOR results in >70% reduction of mTOR expression that cannot be overcome by IL-8. mTOR silencing leads to an increase in PLD activity that is abrogated by overexpression of mTOR and is dependent on the activity of the kinase. Fig. 9 presents a model that explains the complex inter-regulation of PLD and the two kinases mTOR and S6K.
FIGURE 9.
A model highlighting the biological significance of the findings in this report. Overexpression of S6K or mTOR decreases PLD2 gene expression. IL-8 rescues down-regulated PLD2. IL-8-mediated PLD2 expression requires mTOR and chemotaxis correlates with the presence or absence of PLD2. Silencing of mTOR cannot be overcome with IL-8. Silencing of mTOR leads to an increase in PLD activity that is abrogated by overexpression of mTOR and is dependent on the activity of the kinase.
DISCUSSION
During inflammatory processes, activation of neutrophils or T lymphocytes with IL-8 or phorbol 12-myristate 13-acetate, respectively, results in modulated up-regulation of many transcripts (28, 29). Although a set of IL-8- or phorbol 12-myristate 13-acetate-induced genes is related to cell motility, no significant changes in PLD2 mRNA expression were observed in either cell type. However, mTOR and S6K was consistently observed as up-regulated genes (29). This is probably due to the fact IL-8 actions on PLD2 transcripts are faster than the ones for mTOR/S6K. In support of this hypothesis, we demonstrate that PLD2 mRNA up-regulation in response to IL-8 in differentiated HL-60 is a fast and transient process that precedes mTOR/S6K up-regulation (Fig. 1).
The steady-state level of any given mRNA is the result of both transcriptional and mRNA turnover (post-transcriptional) events. In leukocytes, mRNA turnover via regulation of mRNA stability accounts for almost half of all changes in mRNA levels (29). Although the molecular aspects of PLD2 transcript up-regulation were not studied, IL-8-mediated PLD2 up-regulation observed in HL-60 cells may be under post-transcriptional control. In line with this assumption is the fact that transcription of the PLD2 gene is a relatively slow process (30). Further, IL-8 is known to induce genes involved in cell growth and migration via post-transcriptional mechanisms (31). Interestingly, mTOR and S6K appear to be two of the many genes under post-transcriptional control in activated T lymphocytes (29).
Fast post-transcriptional changes of signaling protein concentrations (e.g. translation on demand) is a vital cellular process that ensures proper translation of stabilized transcripts at a given time (32). Transient increases in PLD mRNA levels in response to the chemoattractant IL-8 may correlate with increased protein levels and/or PLD activity. It has been demonstrated that IL-8 increases migration in neutrophils and differentiated HL-60 cells in a PLD-dependent manner (14). In line, dHL-60 cells were able to migrate toward a gradient of IL-8 following a similar kinetic as that of the PLD2/mTOR/S6K mRNA expression profiles (Fig. 1B). Moreover, IL-8 increases total PLD activity, and this increase correlates with increased IL-8-mediated cell migration (14). Together, these results suggest that IL-8-mediated up-regulation of PLD2 results in increased PLD activity resulting in increased cell migration.
Neither the role of IL-8 nor the impact of PLD-derived PA on mTOR/S6K mRNA expression has been studied yet. Under our experimental conditions, IL-8 increases mTOR and S6K transcript levels (Fig. 1). This IL-8-mediated phenomenon appears to be PLD2-dependent, because silencing of PLD2 transcripts correlates with decreased PLD activity and cell migration in HL-60 cells (14), and completely abolishes IL-8-mediated up-regulation of mTOR/S6K mRNAs (Fig. 2A).
The role of PA on HL-60 cell migration has been previously reported by us (14). We now add an extra layer of complexity to the potential mechanisms involved in IL-8-mediated cell migration. Moreover, ∼25% expression levels of PLD2 via siRNA silencing did not affect basal levels of mTOR or S6K proteins (Fig. 2B) suggesting that enzymatic activities of mTOR/S6K, both functional targets of PLD-derived PA (8–9), are involved in IL-8-mediated HL-60 cell migration.
PLD2 appears to be a functional target of many kinases whose identities remain elusive. The possibility that functional mTOR/S6K are related to endogenous molecular/functional levels of PLD2 was tested. Silencing of either mTOR or S6K transcripts via siRNA resulted in the up-regulation of PLD2 transcripts, protein, and activity (Fig. 3, A, B, and C–E, respectively). Interestingly, silencing of S6K also resulted in inhibition of IL-8-mediated up-regulation of mTOR and vice versa; silencing of mTOR resulted in inhibition of IL-8-mediated S6K mRNA up-regulation. These results suggest that basal mTOR and S6K are necessary and interdependent for IL-8-mediated regulation of their transcripts. However, silencing of either mTOR or S6K did not result in inhibition of IL-8-mediated PLD2 transcript up-regulation, suggesting that a different mechanism for IL-8-stimulated PLD2 mRNA expression is taking place.
The role of mTOR on basal and IL-8-stimulated PLD2 mRNA levels is dependent on the functional activity of mTOR. Indeed, inhibition of mTOR with rapamycin resulted in increased total PLD activity (Fig. 4A) but inhibited IL-8-mediated cell migration (Fig. 4B). Although it is known that rapamycin is a negative modulator of cell migration in response to granulocyte macrophage-colony stimulating factor (23) a common path is now evidenced in the general mechanism of cell migration: while IL-8-mediated cell migration requires PLD2, mTOR, and S6K activities, mTOR/S6K functionality does participate in modulation of PLD2 function and expression.
This functional feedback mechanism was further tested by using functional and non-functional mTOR constructs (Fig. 5). Overexpression of fully active mTOR correlated with decreased expression and decreased functional levels of PLD2 (Fig. 6, A and B). However, this effect was not observed when cells were transfected with the kinase-dead mutant D2375E of mTOR (Fig. 6, C and D). These results suggest that the kinase activity of mTOR is involved in basal functional and molecular up-regulation of PLD2. The lack of effect of mTOR D2375E on PLD2 up-regulation appears not to be due to the cellular localization of mTOR. Endogenous mTOR localizes in the endoplasmic reticulum and in the Golgi apparatus (33). Consistent with this finding, mTOR constructs either WT or D2375E are expressed in vesicle-like structures (Fig. 5, D–F) resembling the natural distribution of the enzyme.
In summary, we investigated the role of IL-8 on gene expression of PLD2, mTOR, and S6K and the impact of mTOR/S6K silencing or inhibition on cell migration in response to IL-8. Our results uncover a new regulatory role of the mTOR/S6K signaling cascade in the modulation of IL-8- or PLD2-mediated cell migration. The functional consequences could extend from leukocyte locomotion to degranulation, mitogenic, and apoptotic effects.
This work was supported, in whole or in part, by National Institutes of Health Grant HL056653 (to J. G.-C.).
- PLD
- phospholipase D
- PA
- phosphatidic acid
- mTOR
- mammalian target of rapamycin
- WT
- wild type
- S6K
- S6 kinase
- IL-8
- interleukin-8
- HA
- hemagglutinin
- TRITC
- tetramethylrhodamine isothiocyanate
- FITC
- fluorescein isothiocyanate
- CMV
- cytomegalovirus
- siRNA
- small interference RNA
- PBS
- phosphate-buffered saline
- ANOVA
- analysis of variance
- DE
- kinase-dead.
REFERENCES
- 1.Exton J. H. (2002) Rev. Physiol. Biochem. Pharmacol. 144, 1–94 [DOI] [PubMed] [Google Scholar]
- 2.Jenkins G. M., Frohman M. A. (2005) Cell Mol. Life Sci. 62, 2305–2316 [DOI] [PMC free article] [PubMed] [Google Scholar]
- 3.English D., Cui Y., Siddiqui R. A. (1996) Chem. Phys Lipids 80, 117–132 [DOI] [PubMed] [Google Scholar]
- 4.Lee C. S., Kim K. L., Jang J. H., Choi Y. S., Suh P. G., Ryu S. H. (2009) Biochim. Biophys. Acta 1791, 862–868 [DOI] [PubMed] [Google Scholar]
- 5.Zhang Y., Du G. (2009) Biochim. Biophys. Acta 1791, 850–855 [DOI] [PMC free article] [PubMed] [Google Scholar]
- 6.Foster D. A. (2009) Biochim. Biophys. Acta 1791, 949–955 [DOI] [PMC free article] [PubMed] [Google Scholar]
- 7.Stace C. L., Ktistakis N. T. (2006) Biochim. Biophys. Acta 1761, 913–926 [DOI] [PubMed] [Google Scholar]
- 8.Fang Y., Vilella-Bach M., Bachmann R., Flanigan A., Chen J. (2001) Science 294, 1942–1945 [DOI] [PubMed] [Google Scholar]
- 9.Lehman N., Ledford B., Di Fulvio M., Frondorf K., McPhail L. C., Gomez-Cambronero J. (2007) FASEB J. 21, 1075–1087 [DOI] [PubMed] [Google Scholar]
- 10.Fang Y., Park I. H., Wu A. L., Du G., Huang P., Frohman M. A., Walker S. J., Brown H. A., Chen J. (2003) Curr. Biol. 13, 2037–2044 [DOI] [PubMed] [Google Scholar]
- 11.Sun Y., Chen J. (2008) Cell Cycle 7, 3118–3123 [DOI] [PubMed] [Google Scholar]
- 12.Berven L. A., Willard F. S., Crouch M. F. (2004) Exp. Cell Res. 296, 183–195 [DOI] [PubMed] [Google Scholar]
- 13.Baggiolini M., Walz A., Kunkel S. L. (1989) J. Clin. Invest. 84, 1045–1049 [DOI] [PMC free article] [PubMed] [Google Scholar]
- 14.Lehman N., Di Fulvio M., McCray N., Campos I., Tabatabaian F., Gomez-Cambronero J. (2006) Blood 108, 3564–3572 [DOI] [PMC free article] [PubMed] [Google Scholar]
- 15.Zheng J. C., Huang Y., Tang K., Cui M., Niemann D., Lopez A., Morgello S., Chen S. (2008) J. Neuroimmunol. 200, 100–110 [DOI] [PMC free article] [PubMed] [Google Scholar]
- 16.Gerszten R. E., Garcia-Zepeda E. A., Lim Y. C., Yoshida M., Ding H. A., Gimbrone M. A., Jr., Luster A. D., Luscinskas F. W., Rosenzweig A. (1999) Nature 398, 718–723 [DOI] [PubMed] [Google Scholar]
- 17.Larsen C. G., Anderson A. O., Appella E., Oppenheim J. J., Matsushima K. (1989) Science 243, 1464–1466 [DOI] [PubMed] [Google Scholar]
- 18.Sebok K., Woodside D., al-Aoukaty A., Ho A. D., Gluck S., Maghazachi A. A. (1993) J. Immunol. 150, 1524–1534 [PubMed] [Google Scholar]
- 19.Lee J., Horuk R., Rice G. C., Bennett G. L., Camerato T., Wood W. I. (1992) J. Biol. Chem. 267, 16283–16287 [PubMed] [Google Scholar]
- 20.Murooka T. T., Rahbar R., Platanias L. C., Fish E. N. (2008) Blood 111, 4892–4901 [DOI] [PMC free article] [PubMed] [Google Scholar]
- 21.Fox R., Nhan T. Q., Law G. L., Morris D. R., Liles W. C., Schwartz S. M. (2007) EMBO J. 26, 505–515 [DOI] [PMC free article] [PubMed] [Google Scholar]
- 22.Makam M., Diaz D., Laval J., Gernez Y., Conrad C. K., Dunn C. E., Davies Z. A., Moss R. B., Herzenberg L. A., Tirouvanziam R. (2009) Proc. Natl. Acad. Sci. U.S.A. 106, 5779–5783 [DOI] [PMC free article] [PubMed] [Google Scholar]
- 23.Gomez-Cambronero J. (2003) FEBS Lett. 550, 94–100 [DOI] [PMC free article] [PubMed] [Google Scholar]
- 24.Vilella-Bach M., Nuzzi P., Fang Y., Chen J. (1999) J. Biol. Chem. 274, 4266–4272 [DOI] [PubMed] [Google Scholar]
- 25.Di Fulvio M., Lehman N., Lin X., Lopez I., Gomez-Cambronero J. (2006) Oncogene 25, 3032–3040 [DOI] [PMC free article] [PubMed] [Google Scholar]
- 26.Kim D. H., Sarbassov D. D., Ali S. M., King J. E., Latek R. R., Erdjument-Bromage H., Tempst P., Sabatini D. M. (2002) Cell 110, 163–175 [DOI] [PubMed] [Google Scholar]
- 27.Lehman J. A., Paul C. C., Baumann M. A., Gümez-Cambronero J. (2001) Am. J. Physiol. Cell Physiol 280, C183–C191 [DOI] [PubMed] [Google Scholar]
- 28.Martinez F. O., Sironi M., Vecchi A., Colotta F., Mantovani A., Locati M. (2004) Eur. J. Immunol. 34, 2286–2292 [DOI] [PubMed] [Google Scholar]
- 29.Cheadle C., Fan J., Cho-Chung Y. S., Werner T., Ray J., Do L., Gorospe M., Becker K. G. (2005) BMC Genomics 6, 75. [DOI] [PMC free article] [PubMed] [Google Scholar]
- 30.Kikuchi R., Murakami M., Sobue S., Iwasaki T., Hagiwara K., Takagi A., Kojima T., Asano H., Suzuki M., Banno Y., Nozawa Y., Murate T. (2007) Oncogene 26, 1802–1810 [DOI] [PubMed] [Google Scholar]
- 31.Bautista M. V., Chen Y., Ivanova V. S., Rahimi M. K., Watson A. M., Rose M. C. (2009) J. Immunol. 183, 2159–2166 [DOI] [PubMed] [Google Scholar]
- 32.Beyer A., Hollunder J., Nasheuer H. P., Wilhelm T. (2004) Mol. Cell Proteomics 3, 1083–1092 [DOI] [PubMed] [Google Scholar]
- 33.Drenan R. M., Liu X., Bertram P. G., Zheng X. F. (2004) J. Biol. Chem. 279, 772–778 [DOI] [PubMed] [Google Scholar]


