Abstract
Using mouse gene knock-out models, we identify aldehyde reductase (EC 1.1.1.2, Akr1a4 (GR)) and aldose reductase (EC 1.1.1.21, Akr1b3 (AR)) as the enzymes responsible for conversion of d-glucuronate to l-gulonate, a key step in the ascorbate (ASC) synthesis pathway in mice. The gene knock-out (KO) mice show that the two enzymes, GR and AR, provide ∼85 and ∼15% of l-gulonate, respectively. GRKO/ARKO double knock-out mice are unable to synthesize ASC (>95% ASC deficit) and develop scurvy. The GRKO mice (∼85% ASC deficit) develop and grow normally when fed regular mouse chow (ASC content = 0) but suffer severe osteopenia and spontaneous fractures with stresses that increase ASC requirements, such as pregnancy or castration. Castration greatly increases osteoclast numbers and activity in GRKO mice and promotes increased bone loss as compared with wild-type controls and additionally induces proliferation of immature dysplastic osteoblasts likely because of an ASC-sensitive block(s) in early differentiation. ASC and the antioxidants pycnogenol and resveratrol block osteoclast proliferation and bone loss, but only ASC feeding restores osteoblast differentiation and prevents their dysplastic proliferation. This is the first in vivo demonstration of two independent roles for ASC as an antioxidant suppressing osteoclast activity and number as well as a cofactor promoting osteoblast differentiation. Although humans have lost the ability to synthesize ASC, our mouse models suggest the mechanisms by which suboptimal ASC availability facilitates the development of osteoporosis, which has important implications for human osteoporosis.
Keywords: Antioxidant, Ascorbic acid, Bone, Oxidative Stress, Resveratrol, Aldehyde Reductase, Aldose Reductase, Osteoblast, Osteoclast, Osteoporosis
Introduction
Humans and other primates have lost the ability to synthesize ascorbic acid (ASC3; vitamin C), and severe ASC deficiency results in scurvy, a systemic condition that affects the skeletal, neurologic, and hematopoietic systems with potentially lethal consequences. ASC is a cofactor in the enzymatic hydroxylation of proline and lysine residues by molecular oxygen as well as a general water-soluble antioxidant. The possible role of mild ASC deficiency in the etiology of various human diseases remains speculative, but accumulating epidemiological evidence for osteoporosis indicates individuals with low ASC intakes have reduced bone mass, a greater rate of bone loss, and increased fractures (1–3). A recently reported 17-year follow-up study of subjects enrolled in the Framingham Osteoporosis Study showed that elderly men and women with a dietary history of high ASC intake have reduced risk of hip fractures of ∼50% (4). Interestingly, the Women's Health Initiative Observational Study (5) of ∼11,000 women between the ages of 50 and 79 years found no relation between total dietary antioxidant intakes (vitamins and mineral antioxidants) and bone mass density. However, a significant interaction effect was observed between total intake of vitamin C and total body, spine, and total hip bone mass densities in subjects on hormone therapy. These and other studies (6) suggest that ASC enhances bone health and that relative deficiency may play a role in the development of osteoporosis in humans. Thus, optimal ASC intakes for minimizing osteoporosis may be higher than those needed for preventing scurvy.
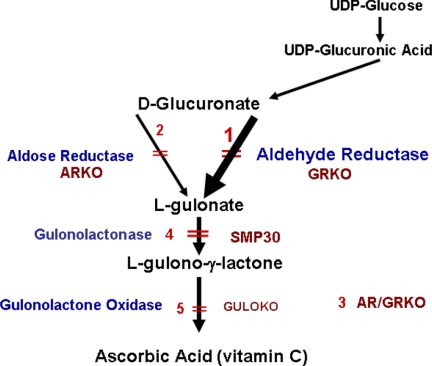
Unlike primates, mice and rats are able to synthesize ASC. ASC synthesis involves the conversion of d-glucuronate to ASC in three enzymatic steps, with l-gulonate and l-gulono-γ-lactone as intermediate metabolites (Fig. 1). The final enzymatic step is catalyzed by l-gulono-γ-lactone oxidase (GULO), an enzyme that is mutated and not functional in primates including humans, guinea pigs, and some spontaneous mutant mouse and rat models (7–10). The conversion of l-gulonate to l-gulono-γ-lactone, which is the final substrate for the GULO enzyme, occurs via Senescence-Marker Protein-30 (SMP30) recently identified as a gulonolactonase enzyme whose knock-out mice develop scurvy (11).
FIGURE 1.
Ascorbic acid synthesis pathway. Conversion of glucuronate to l-gulonate occurs mainly through GR. AR is a minor contributor. GULO converts l-gulonate to ASC. Gene knockouts in our mouse lines are numbered 1–3. Primates, guinea pigs, and the sfx congenic mouse have deletions of the GULO gene (5) and are unable to synthesize ASC. An AR/GR double knock-out (3) and a gulonolactonase (SMP30) knock-out (4) produce a scorbutic phenotype identical to GULOKO (5).
The enzyme(s) involved in the conversion of d-glucuronate to l-gulonate have not been hitherto definitively identified, although aldehyde reductase was proposed to be the only enzyme involved, with aldose reductase considered to be an unlikely contributor (12). Aldehyde reductase (GR; Akr1a4, glucuronate reductase) and the closely related enzyme aldose reductase (AR; Akr1b3, aldose reductase) are members of the aldo-keto reductase (AKR) superfamily which consists of a number of enzymes and proteins, many of whose functions remain speculative. They are NADPH-dependent enzymes with broad overlapping substrate specificities that reduce a wide variety of aldehydes to their respective alcohols. AR and GR (13, 14) are implicated in both the pathogenesis of diabetic complications (15–17) and the regulation of oxidative stress in cells, with some members of the family playing a role in the detoxification of exogenous aldehydes and toxins. AR has an incompletely understood role in the urinary concentration mechanism as its knock-out in mice results in nephrogenic diabetes insipidus (18). A closely related protein with a demonstrated enzymatic activity, the Kvβ subunit of the Shaker family voltage-dependent potassium channel, appears to act as a redox sensor modulating the channel voltage through oxidation of NADPH; however, the physiological substrate(s) for the subunit is not known (19, 20).
To determine the biological role(s) of these two enzymes, we created mice deficient for each enzyme (ARKO and GRKO) by gene knock-out technology as well as a double-knock-out strain, (ARKO/GRKO = AR/GRKO) by breeding. We show in vivo that both GR and AR catalyze the conversion of glucuronate to gulonate with GR contributing toward ∼85% and AR ∼15% of ASC synthesis in the liver. The GRKO mouse (∼85% ASC deficit) develops and grows normally but has a susceptibility to develop severe osteoporosis under conditions that increase ASC requirements or increase oxidative stress. The ARKO mouse (∼15% ASC deficit) has no skeletal phenotype, whereas the AR/GRKO double knock-out (>95% ASC deficit) develops scurvy. In vivo studies suggest that ASC deficit induces increased bone absorption due to increased osteoclast activity and numbers along with a proliferation of dysplastic immature osteoblasts. Our data suggest that ASC plays a dual role in bone homeostasis; that is, as an anti-oxidant modulating osteoclast proliferation and as a cofactor in the activation of transcription factors that promote osteoblast differentiation. These mouse knock-out models demonstrate the enzymatic steps of the ascorbate synthesis pathway as well as the role of ASC in the modulation of bone homeostasis and increased susceptibility to osteopenia/osteoporosis with less than optimal availability of ASC.
EXPERIMENTAL PROCEDURES
Mouse Chow Diets
Regular mouse chow (Harlan) does not contain vitamin C. We determined that, on average, a mouse eats ∼2.5 grams of mouse chow per day. A compressed 1% vitamin C chow pellet diet prepared for us by Harlan (Teklad TD.07727) assayed at ∼0.65% vitamin C, due to loss of vitamin C in the preparation process. On average these diets deliver a dose of ∼25 mg of vitamin C/mouse/day (1g/kg body wt/day). Vitamin C was undetectable in regular mouse chow pellets provided by Harlan. We prepared pellets containing 0.05% of the anti-oxidants pycnogenol (21, 22), resulting in a dose of ∼50 mg/kg/body wt/day, and resveratrol (23) chow pellets (0.02%) that resulted in a dose of ∼20 mg/kg of body wt/day. The details of preparation and assay are described in the supplemental information.
Ascorbate and Uronic Acid Assays
For tissue and body fluid analyses we used a method that allowed for efficient determination of a large number of samples for vitamin C levels. The collected tissues were immediately frozen on dry ice, stored at −80 °C, and then assayed within a few days. For ascorbic acid assay, tissues were weighed and homogenized in 5% trichloroacetic acid. Subsequently the reduction of ferric iron to ferrous iron by ascorbic acid is followed by measuring the absorbance at 525 nm of the orange Fe2+-α-α′dipyridyl complex (24). Uronic acid excretion in urine was determined by the phenylphenol method (25). Briefly, 200 μl of 20-fold diluted urine is added to 1 ml of a 120 mm borate in 96% sulfuric acid solution, and absorbance is measured at 540 nm before and after the addition of the phenylphenol reagent (1 h of incubation at 80 °C). Uronic acid values were normalized by creatinine measurements. Urinary creatinine concentration was measured by a direct colorimetric method (26).
Enzymatic Assays for Aldose and Aldehyde Reductases
Tissues were homogenized in 5 mm sodium phosphate buffer, pH 7.4, containing 1 mm EDTA and 5 mm β-mercaptoethanol and centrifuged. The supernatant was harvested, and the protein content was determined by the Bradford method (Bio-Rad). Enzymatic activities were assayed by measuring the rate of enzyme-dependent decrease of NADPH absorption at 340 nm in either a Gilford Response or a Hewlett-Packard HP-8453 spectrophotometer at 25 °C. The standard reaction mixture (1-ml volume) contained 0.2 mm NADPH and 10 mm d-glucuronate (for aldehyde reductase) in a 100 mm sodium phosphate buffer, pH 7. Control assays lacking either substrate or enzyme were routinely included, and the rates, if any, were subtracted from the reaction rates. Aldose reductase activity was measured with identical conditions except for the use of 100 mm d-xylose as substrate.
Generation of a Mouse Aldehyde Reductase Knock-out
A mouse embryonic stem (129/SvEvBrd strain) cell clone carrying a gene-trap mutation in the Akr1a4 aldehyde reductase gene (OmniBank sequence tag OST 222400) was chosen for the generation of Akr1a4-deficient mice based on sequence identity to the published mouse Akr1a4 cDNA (accession number NM_021473) (27). Inverse genomic PCR of DNA (28) isolated from OST 222400 cells confirmed that the retroviral gene-trap vector had inserted in intron 1 of the mouse Akr1a4 gene on chromosome 4. The resulting GR−/− knock-out mouse strain was repeatedly bred with C57BL/6J mice to generate an F10 backcross with a uniform C57BL/6J background. The generation schemata are shown in supplemental Fig. S1.
Generation of a Mouse Aldose Reductase Knock-out
An aldose reductase (Akr1b) knock-out mouse was separately generated in the course of developing a knock-in mouse with enhanced aldose reductase activity.4 The mutations (V280L and C298V) are in exon 9, which was flanked with LoxP sites. The LoxP sites allowed the entire exon 9 to be excised with disruption of the gene when the homozygote animals were bred with a homozygous Cre1 recombinase mouse (obtained from Dr. Heiner Westphal, National Institutes of Health). The resulting AR−/− knock-out mouse strain was repeatedly bred with C57BL/6J mice to generate an F10 backcross with a uniform C57BL/6J background. An ARKO/GRKO double knock-out model was generated by cross-breeding the two F10 backcross knock-out strains. The generation schemata are shown in supplemental Fig. S2.
Gulonolactone Oxidase Knock-out
The GULOKO mouse on a C57BL/6J background was purchased from The Jackson Laboratory, Bar Harbor, ME.
Genotyping
All mice were genotyped from tail DNA by PCR using the following primers. AR mutant knock-out mice show a 450-bp band, whereas the WT product gives a 710-bp band (forward primer, 5′-GGACACAGGCTGCTTCTTAG-3′; reverse primer 5′GAAGTCCCGTGTTCTCTCTG3′); GR mutant mice were identified by a 1044-bp band (forward primer, 5′-GGCGTTACTTAAGCTAGCTTGCCAAAC-3′; reverse primer, 5′-GCAGCATCATCTAGGCTCTAGAATTAC-3′), and the WT band is 1156 bp (forward primer, 5′-TGAGCTGAGATCCACCTGATTTGC-3′; reverse primer, 5′-GCAGCATCATCTAGGCTCTAGAATTAC-3′); for GULO, the mutant band is 230 bp (forward primer, 5′-CGCGCCTTAATTAAGGATCC-3′; reverse primer, 5′-GTCGTGACAGAATGTCTTGC-3′), and the WT band is 330 bp (forward primer, 5′-GCATCCCAGTGACTAAGGAT-3′; reverse primer, 5′-GTCGTGACAGAATGTCTTGC-3′).
Histopathology
Immediately after euthanasia, GRKO mice and age-matched normal control mice were flushed by cardiac perfusion with cold phosphate-buffered saline followed by 10% neutral buffered formalin. Tissues were immersed in 10% neutral buffered formalin for an additional 48 h at room temperature. Bone was decalcified by immersing tissues in a formic acid and formaldehyde solution (Cal-Rite, Richard-Allan Scientific, Kalamazoo, MI), which was placed on an orbital shaker for 48–72 h. All tissues were embedded in paraffin, sectioned at 4 μm, and mounted on positively charged glass slides (Superfrost Plus, Fisher) and stained with hematoxylin and eosin.
Microcomputed Tomography
For Fig. 3 (mouse carcass) and Fig. 7 (LV5), a μCT 40 system (Scanco Medical AG, Bassersdrof, Switzerland) was employed with a threshold value of 240. Carcasses and LV5 were scanned at isotopic voxel dimensions of 36 and 16 μm, respectively. Analyses of LV5 included the entire region of secondary spongiosa between proximal and distal slices in which the secondary spongiosa occupied at least 50% of the cancellous bone area, typically 120 slices (∼2 mm). For supplemental Fig. S3, mouse carcasses were examined with a MicroCAT (Imtek, Nashville, TN) with a 7-μm spot size microfocus x-ray source at 50 keV and 80 μA.
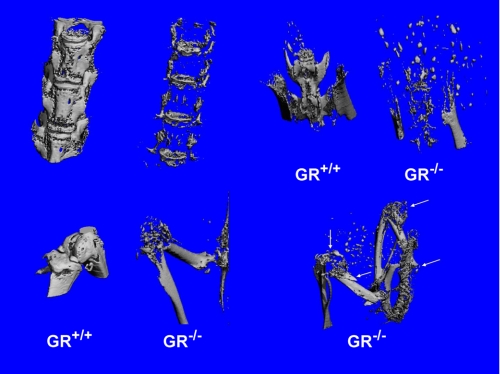
FIGURE 3.
Microcomputed tomography reconstructions of the spinal column, pelvis, knee, femur, and tibia of a WT and an affected GRKO (189-day-old female). Carcasses were scanned at 36 μm in a Scanco μCT 40 with a threshold value of 240. Note the mineral disappearance in the GRKO bones as compared with the WT and dissolution of the patella and numerous fractures (arrows) in the long bones.
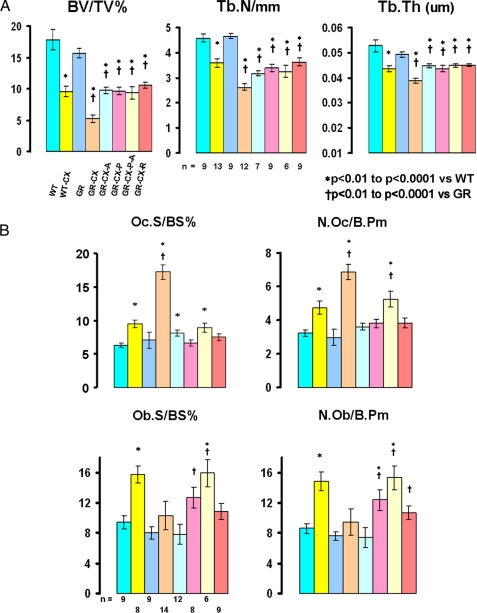
FIGURE 7.
A and B, μCT (lumbar vertebra 5 - LV5) and histomorphometric analyses of LV3/4 in male mice. The experimental groups are identified under the μCT panel displaying the BV/TV% results. The groups are on regular diet (ASC = 0) unless otherwise indicated. WT (intact wild type), WT-CX (castrated WT), GR (intact GRKO), GR-CX (castrated GRKO), GR-CX-A (castrated GRKO on ASC diet), GR-CX-P (castrated GRKO on pycnogenol), GR-CX-P-A (castrated GRKO on pycnogenol + ASC), GR-CX-R (castrated GRKO on resveratrol). The μCT results (A) are three-dimensional measures of the entire LV5. BV/TV% = bone volume as a percentage of total volume, Tb.N/mm = trabecular number per mm, Tb.Th (um) = trabecular thickness. The number of mice/group is shown in the Tb.N panel. All data are shown ± S.E., and significant differences are indicated on each panel. B shows the static histomorphometry results collected on LV3 and LV4. Oc.S/BS% = osteoclast surface per bone surface (percent), N.Oc/B.Pm = number of osteoclasts per bone perimeter. Identical parameters are shown for osteoblasts (Ob) in the lower half of the panel. The number of mice/group is shown in the Ob.S/BS% panel. All data are shown ± S.E., and significant differences are indicated on each panel.
Quantitative Bone Histomorphometry
Histomorphometric analysis of static bone parameters was carried out according to standard procedures (29) in WT and GRKO male mouse lumbar spines. Briefly, the lumbar spine was collected, fixed in 10% buffered formalin for 48 h, dehydrated, and embedded in methylmethacrylate. Medial sections through the vertebral bodies of L3 and L4 were generated, and bone volume (BV)/total volume (TV) and trabecular thickness values were calculated by averaging four measurements taken from L3 and L4 in two different von Kossa-stained 7-mm-thick sections 30–40 mm away from each other. The sections were analyzed using TAS software (Trabecular Analysis Software), which is part of the Osteometrics image analysis system (OsteoMetrics, Decatur, GA). Serial 5-mm-thick sections of L3-L4 were also stained with toluidine blue and tartrate-resistant acid phosphatase according to standard protocols for counting osteoblasts and osteoclasts, respectively. Osteoblasts and osteoclasts data were obtained counting at least 100 fields at ×40 magnification of the L4 vertebral body using the Osteometrics software.
AR, GR, Osterix, and RUNX2 Antibodies
Polyclonal antibodies against human recombinant aldose and aldehyde reductase were raised in rabbits by injection using initial doses of 200 μg of homogenous denatured enzyme in complete Freund's adjuvant followed every 4 weeks by 100-μg doses of protein for a total of three additional injections using incomplete Freund's adjuvant. This process was carried out by Cocalico Biochemicals Inc (Reamstown, PA). IgG from serum was purified using Econo-Pac Serum IgG Purification kits from Bio-Rad. The antibodies were purified to specificity by batch-wise incubation of purified IgG antibodies in heat-denatured liver extracts from AR/GR double knock-out mice. Rabbit polyclonal antibody to mouse osterix and a goat polyclonal antibody to mouse RUNX2 were purchased from Abcam, Inc. (Cambridge, MA).
Osteoblast Cell Culture
Primary osteoblasts were isolated from calvariae of 4–5-day-old WT and GRKO pups as previously described (30). The cells were cultured to confluence in 10-cm plates in α-minimum Eagle's medium containing 10% fetal calf serum and subsequently split into 6-well plates containing Dulbecco's modified Eagle's medium (DMEM, no ASC) and 1% charcoal-stripped fetal calf serum. After reaching confluence (∼5–6 days), the cells were cultured for 48 h in media containing either Dulbecco's DMEM, α-minimum Eagle's medium (containing 50 μg/ml ascorbate but assays as <0 μg/ml), DMEM containing long-acting ASC phosphate (30 μg/ml), or DMEM containing pycnogenol (100 ng/ml), all containing 1% charcoal-stripped fetal calf serum.
RNA Extraction and Quantitative Real-time-PCR Analysis
Total RNA was extracted using TRIzol reagent (Invitrogen). cDNAs were synthesized from extracted RNA by using Superscript III First Strand RT-PCR kit (Invitrogen). Real-time quantitative PCR amplifications were performed on LightCycler (Roche Applied Science), and glyceraldehyde-3-phosphate dehydrogenase was used as an internal control for the quantity and quality of the cDNAs in real-time PCR assays. Primer sequences are available upon request.
Statistical Analysis
Data were analyzed using SYSTAT software (Richmond, CA). Differences between groups were assessed using the non-parametric Kruskal-Wallis one-way analysis of variance with subsequent Mann-Whitney U test comparisons if the p value for the variance analysis for a group was significant. A p value of <0.05 was used to reject the null hypothesis. Data are shown as the mean ± S.E.
RESULTS
Tissue Ascorbate Levels and Urinary Glucuronate Excretion in Wild-type and Knock-out Mice
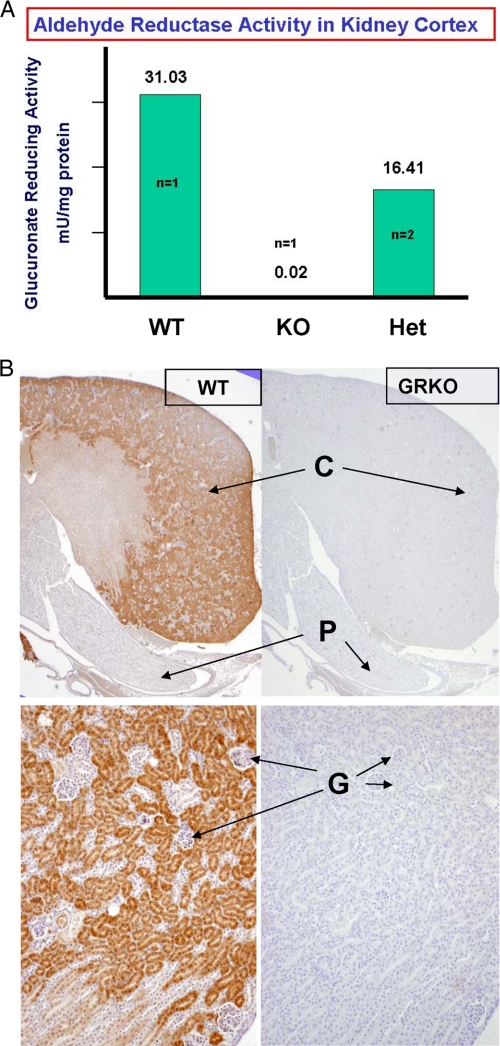
The GR and AR knock-out mice were generated as described in supplemental Figs. S1 and S2. Fig. 2A demonstrates the absence of GR enzyme activity in the GRKO renal cortex and a ∼50% reduction in the heterozygote GR+/− cortex, respectively. Immunostaining of WT kidney cortex with a specific antibody to GR, Fig. 2B, shows intense staining localized to the proximal convoluted tubules and the absence of staining in the corresponding GRKO tissue.
FIGURE 2.
Knock-out of aldehyde reductase was confirmed by measurement of enzyme activity and immunohistochemistry in specific tissues that uniquely express the enzyme as well as by Western blots (not shown) using highly specific antibodies to aldehyde reductase. A shows the GR enzyme activity is absent in the GRKO renal cortex (C) and is reduced to 50% in the GR+/− heterozygote. Aldehyde reductase is expressed in the proximal convoluted tubules (PCT) of the renal cortex (B) but not in the glomeruli (G) or papilla (P). AR is expressed in the renal papilla (not shown). Note the absence of immunohistochemical staining (horseradish peroxidase staining) in the GRKO renal cortex and proximal convoluted tubules.
Urinary glucuronate excretion, Table 1, is essentially normal in ARKO and GULOKO mice but significantly increased 3.5-fold in GRKO mice (p < 0.001), which is consistent with a block in glucuronate utilization. ASC synthesis in mice occurs exclusively in the liver, and liver ASC contents are reduced by 17 and 89% (p < 0.001) in ARKO and GRKO mice, respectively, which is consistent with the involvement of both enzymes in glucuronate reduction and ASC synthesis. Renal ASC contents are ∼60% of the respective liver contents and reflect the amount of ASC available for local re-cycling and excretion. Interestingly, there is a gender difference in liver ASC content, with male WT mice having an ∼30% higher ASC content than females, p < 0.001. This gender difference is observed in the GULOKO and ARKO mice as well. Urinary glucuronate excretion levels are also significantly lower (p < 0.001) in female mice, implicating differences in glucuronate production as a possible basis. Male castration reduces liver ASC content in WT mice to the levels observed in WT females.
TABLE 1.
Glucuronic and ascorbate levels in WT, GRKO, ARKO, and GULOKO mice (±S.E.)
| WT male | WT female | WT-CX male | GR−/− male | AR−/− male | GULO−/− male | GULO−/− female | |
|---|---|---|---|---|---|---|---|
| Urinary glucuronate (mg/mg creatinine) | 8.6 ± 0.3 n = 10 | 4.3 ± 0.4an = 16 | 30.4 ± 1.7bn = 12 | 5.2 ± 1.2 n = 18 | 11.5 ± 0.8 n = 5 | 5.3 ± 1.5an = 9 | |
| Liver ascorbate (ng/mg wet wt) | 270 ± 8 n = 10 | 184 ± 6an = 21 | 183 ± 14bn = 10 | 30 ± 2bn = 14 | 223 ± 17bn = 12 | 15.1 ± 1.1bn = 9 | 11.1 ± 0.6an = 6 |
| Kidney ascorbate (ng/mg wet wt) | 157 ± 4 n = 10 | 115 ± 4an = 21 | 108 ± 4bn = 10 | 19 ± 1bn = 7 | 127 ± 11bn = 12 | 9.3 ± 0.5bn = 9 | 5.9 ± 0.3an = 6 |
a p < 0.001 vs. corresponding male genotype.
b p < 0.001 vs. WT male.
These data demonstrate that both GR and AR reduce d-glucuronate to l-gulonate, which is then converted to ASC by further enzymatic steps involving SMP-30 and GULO (Fig. 1). The role of AR in ASC synthesis is confirmed in double knock-out AR/GRKO mice (Fig. 1, 3), which develop the clinical features of the GULO knock-out mouse including rapid onset of scurvy in newborn double homozygote mice of both genders and death at 8–10 weeks of age (supplemental Fig. S3). The two knock-out models, thus, identify GR as the main enzyme providing ∼85% of the l-gulonate for ASC synthesis in the mouse and, importantly, identify AR as a source of the remaining ∼15%. Fig. 1 summarizes the definitive pathway for ASC synthesis as demonstrated by the series of knock-out mice.
Skeletal Phenotype of Aldehyde Reductase Knock-out Mice
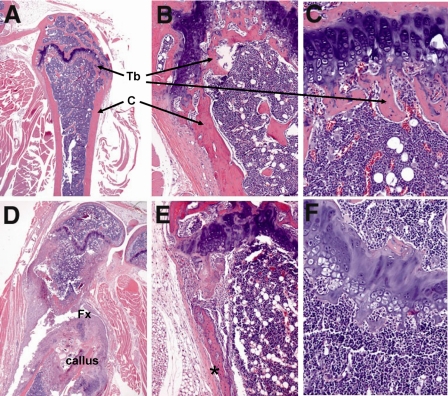
Both genders of the GR enzyme knock-out (GRKO) mouse develop and grow normally when fed regular mouse chow that is devoid of ASC (Purina irradiated chow 5053, ASC content = 0), indicating that the ∼15% ASC levels resulting from AR activity are sufficient for bone development and growth. Heterozygous GR+/− females and homozygous males breed successfully; however, pregnant homozygous females are unable to successfully carry a litter and rapidly develop severe osteoporosis and spontaneous fractures. At necropsy they have 6–12 resorbing 5-mm diameter fetuses in the uterine horns and multiple severe fractures in the long bones and vertebrae. Fig. 3 shows micro-CT reconstructions of the vertebral column, sacrum, ilium, and the long bones of a wild-type GR+/+ and an affected GRKO female and demonstrates the severe loss of bone and multiple fractures in the long bones. The histopathology of long bones (Fig. 4) includes reduced cortical bone thickness and severe loss of trabecular bone at the growth plates with fractures and callus formation. Feeding of 1% ASC pellets allows the GRKO females to successfully breed and wean litters of 8–10 pups and prevents fractures and other bone changes.
FIGURE 4.
Histology of a WT and an affected GRKO female mouse showing spontaneous bone fractures and loss of trabecular bone. Panels A–C show the proximal tibia in a female WT mouse. Note the thickness of the diaphyseal and metaphyseal cortical bone (C) and the thin layer of trabecular bone (Tb) at the growth plate (A). B, a higher magnification shows the normal thickness of cortical bone at the metaphysis, whereas C shows the extensive trabecular bone (pink) that normally makes up the spongiosa at the metaphysis. Panels D–F show corresponding areas of bone in an age-matched affected GRKO female mouse. D, there is a complete fracture (Fx) of the bone near the metaphysis with extensive callus formation. E shows severe reduction in cortical bone thickness and periosteal fibrosis (*). F shows the complete loss of trabecular bone at the epiphysis.
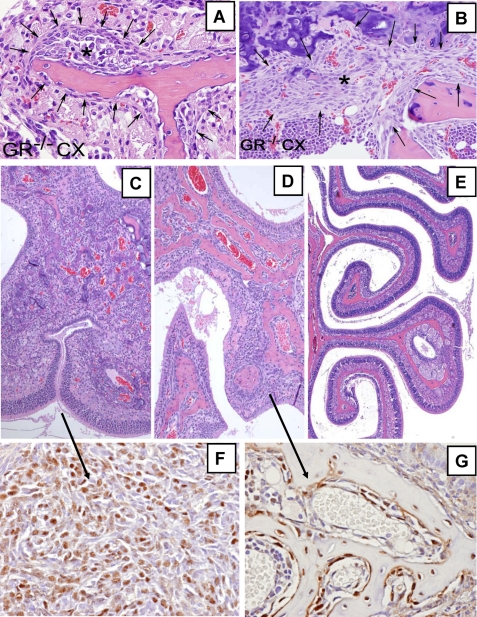
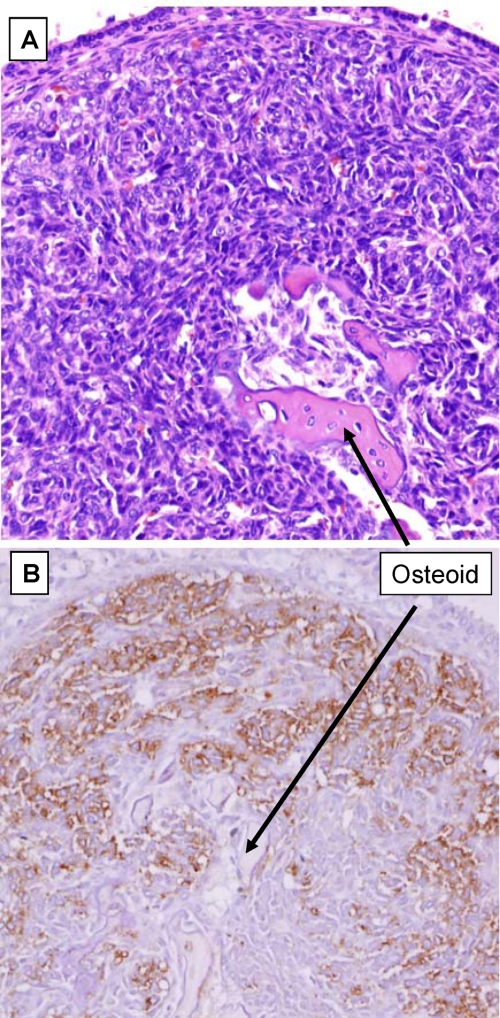
The homozygous GRKO mice develop a mild age-related osteoporosis phenotype that preferentially affects females. The earliest histological finding in affected aging unmated female GRKO mice is the proliferation of dysplastic mesenchymal cell masses that are present in trabecular areas of long bones and vertebrae (Fig. 5, A and B) and are more clearly observed in the nasal turbinates. The nasal turbinates are complex organs that have a scaffold of trabecular bone-supporting blood vessels, olfactory and neurosensory tissue. Fig. 5C shows the effect of castration on a male GRKO mouse. The trabecular bone is resorbed and replaced by dysplastic cell masses. These are the earliest lesions (∼6 months) seen in female GRKO mice fed a regular diet and are the only lesions observed in older (>1.5 years) male GRKO mice and are never seen in WT mice or in GRKO mice placed on ASC diet (Fig. 5E and supplemental Fig. S4). The proliferative cell masses are similar to those described by Beamer et al. (8) in a GULO-deficient scorbutic mouse model. Fig. 5C shows that the trabecular bone disappears from the nasal turbinates and is replaced by proliferating dysplastic cell masses in the absence of dietary ASC intake. These cell masses are consistent with being developmentally arrested immature osteoblasts, as suggested by immunostaining with antibodies against osterix, an ASC-sensitive transcription factor (31, 32) known to be critical for osteoblast differentiation (Fig. 5F) and RUNX2 (Fig. 6), a marker of osteoblast lineage commitment. Feeding of ASC (Fig. 5, D and G) for 1 month before sacrifice reduces the volume of dysplastic cell masses and leads to the formation of a haphazard network of newly formed bone that clearly does not restore the original trabecular architecture (Fig. 5D). Supplementation of the diet with ASC immediately after castration preserves the normal organization of bone trabeculae of the long bones/nasal turbinates and prevents the proliferative response (Fig. 5E). These results show that a relative ASC deficit in the GRKO mouse leads to severe trabecular bone loss associated with proliferation of developmentally arrested osteoblasts at an ASC-sensitive step, with osteoclast function likely to be affected as well.
FIGURE 5.
A and B, shown is accumulation of dystrophic subperiosteal (arrows) osteoblasts (*) along the trabecular bones (pink) in the nasal turbinates (A) and in the tibial growth plate (B) 3 weeks after castration in a male GRKO mouse fed regular chow (ASC content = 0). These cell masses are never seen in castrated WT mice on regular chow or in castrated GRKO mice fed an ASC diet. C–E, shown is the effects of castration (CX) on turbinate structure in male GRKO mice. C shows few remnant fragments of trabecular bone (pink) and proliferation of dystrophic osteoblasts in mice fed a regular diet for 4 months after CX. D shows the effects of feeding ASC for 1 preterminal month after 3 months on a regular diet. Note the haphazard formation of new bone replacing the proliferating periosteal osteoblasts observed in C. E shows that ASC feeding after CX prevents the changes seen in C and preserves the normal turbinate structures. F and G, shown are higher magnification views of adjacent sections to C and D, respectively, immunostained with osterix antibody. F, not all cells are osterix-positive, possibly indicating different stages of osteoblast differentiation. G, ASC intake stimulates the formation of trabecular bone containing osteocytes and active plump subperiosteal mature elongated osteoblasts.
FIGURE 6.
A and B, affected turbinates in castrated GRKO male mice placed on regular mouse pellets (ASC = 0) for 4 months are shown. Panel A is an hematoxylin and eosin-stained section showing fragments of trabecular bone and a prominent proliferation of dysplastic cell masses filling and distorting the turbinate structure. Panel B shows a section immunostained with RUNX2 antibody, which demonstrates ribbons of committed dysplastic osteoblasts.
These findings suggest that stresses that increase ASC demands result in early functional ASC deficiency because of the limited ability of GRKO mice to synthesize ASC; one outcome of this phenomenon is an early onset osteoporosis. Indeed, there is a marked acceleration of the skeletal bone loss phenotype in GRKO mice after gonadectomy due to the loss of sex hormones.
The changes in the nasal turbinate bones parallel the changes observed in the long bones/vertebrae and allow the in vivo demonstration of the effects of ASC deficiency on osteoblast differentiation and maturation. The ASC-sensitive block in maturation appears to occur at the osterix differentiation step with only about 50% of the cells forming the mesenchymal cell masses being positive for osterix expression, possibly due to the remnant 15% ASC synthesis occurring via AR.
Role of ASC Deficit in the Development of Osteopenia/ Osteoporosis
The availability of a mouse model that synthesizes sufficient ASC for normal bone growth and development, but with a finite ability to increase synthesis under a variety of stresses that increase body requirements for ASC, provides an opportunity to further evaluate the role of mild ASC deficit in the development of osteoporosis. Male mice were castrated at 60 days of age to induce bone loss. The mice were thereafter fed various diets for 3 weeks, and the bones were harvested for μCT and histomorphometry studies of the vertebrae. Because ASC also has antioxidant properties that may be involved in direct local control of reactive oxygen species (33), we also tested the effects of feeding mouse chow pellets containing 2 other powerful antioxidants, 0.05% pycnogenol or 0.02% resveratrol. Both antioxidants (21–23), unlike ASC, have no known cofactor role in the enzymatic hydroxylation reactions.
Microcomputed tomography (Fig. 7A) shows that there are no statistically significant differences in trabecular BVs, trabecular numbers (Tb.N) and trabecular thickness (Tb.Th) of lumbar vertebrae (LV5) of 3-month old intact male WT and GRKO mice fed a regular mouse chow diet devoid of ASC (ASC content = 0). Castration, however, leads to marked losses in bone volumes after 3 weeks in both strains with the bone loss significantly greater in the GRKO mice than WT mice (68 versus 46%, respectively, p = 0.004). ASC feeding (1% ASC chow pellets) beginning on the day of castration prevented this heightened bone loss in the castrated GRKO mouse, indicating that the observed 22% increase in BV loss is attributable to ASC deficiency. Similar changes (p < 0.005 or better) were found in the observed trabecular number and thickness parameters. Both pycnogenol and resveratrol antioxidants limited the BV and trabecular losses to those observed in castrated WT mice, suggesting that the ASC-sensitive component of BV loss is in part mediated through increased oxidative stress and/or osteoclast activity.
These results, in concert with our findings in the long bones and nasal turbinates described above, suggest that ASC deficiency causes an imbalance in bone osteoclast/osteoblast activity favoring bone resorption. This effect is likely due at least in part to the proliferation of immature osteoblasts in the GRKO mice; moreover, base-line tartrate-resistant acid phosphatase (TRAP) levels measured in a small subset of GRKO mice were elevated, suggesting increased osteoclastic activity as well (data not shown). This was further investigated by histomorphometry.
Histomorphometric analyses (Fig. 7B) show the osteoclast parameters (Oc.S/BS and N.Oc/B.Pm) are comparable in the intact WT and GRKO mice on a regular diet (p = not significant) but are significantly elevated in castrated mice, p < 0.001, with this increase being much greater in the GRKO mice, indicating increased osteoclastic activity driving bone resorption. The increased osteoclast response is efficiently suppressed by ASC, pycnogenol, and resveratrol, confirming heightened base-line oxidative stress in the intact GRKO mice due to ASC deficiency. Reactive oxygen species such as hydrogen peroxide have been shown both in vitro and in vivo to directly stimulate osteoclastic activity and osteoclastogenesis (34–36). It is noted that the combination of pycnogenol and ASC feeding results in a significant increase in osteoclast numbers as compared with feeding pycnogenol alone, suggesting the ASC-induced increase in osteoblast numbers and maturation as a probable cause (see below).
Osteoblast parameters (Fig. 7B) are comparable in intact WT and GRKO mice and are significantly increased only in the castrated WT mice, p < 0.001. The osteoblast numbers are not elevated in the castrated GRKO mice receiving ASC but are significantly increased in the mice receiving the pycnogenol, pycnogenol plus ASC, or resveratrol diet pellets. Only ASC feeding restores osteoblast parameters to the levels observed in intact WT and GRKO mice. The elevated number of osteoblasts in the GRKO castrated mice receiving pycnogenol or resveratrol compared with those receiving ASC together with the fact that all these mice have a similar bone volume (BV/TV) suggests that only ASC-treated osteoblasts are fully functional. The suppression of osteoclasts by pycnogenol and resveratrol and the loss of bone volume in these mice despite significant increases in osteoblast numbers are consistent with the finding that these osteoblasts are not fully functional.
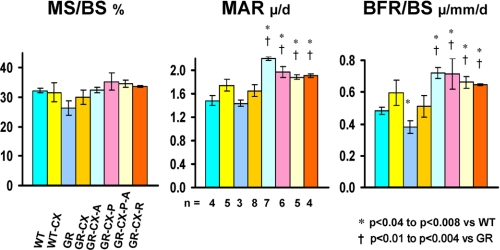
Dynamic indices of bone formation (mineralized surface/bone surface (BS), mineral apposition rate (MAR), and bone formation rate (BFR)) are similar in intact WT and GRKO mice fed a regular ASC-deficient diet (Fig. 8). However, MAR and BFR indices are increased in all other castrated groups (p < 0.05 or better) whether fed ASC or antioxidants as compared with intact WT or GRKO mice. These data confirm that androgen deficiency in male mice increases bone turnover, resulting from increased osteoclastic activity and decreased osteoblastic activity with a net bone loss. The administration of ASC or antioxidants, at least at the dosages used in this study, is however, not sufficient to protect the mice from this effect.
FIGURE 8.
Effect of castration on dynamic histomorphometry parameters (MS/BS%, mineralized surface/BS %; MAR, μm/day; BFR/BS, bone formation rate/BS = μm/mm/day) in WT and GRKO mice. Histomorphometry parameters do not differ between intact WT and GRKO mice. Castration does increase MAR or BFR values above those of intact mice, as expected; however, it leads to significant increases in these values only in the treated groups (ASC and antioxidants), indicating that ASC and antioxidants therapy increase the bone formation rate despite the observed overall bone loss. The number of mice/group is shown in the MAR panel. All data are shown ± S.E., and significant differences are indicated on each panel.
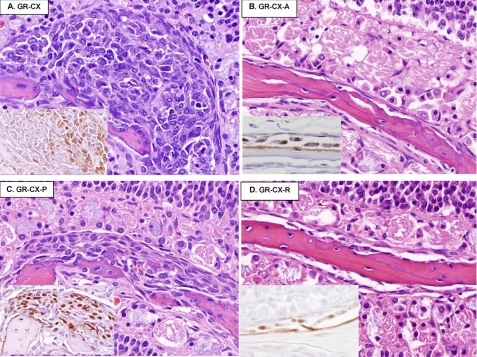
Examination of the nasal turbinates (Fig. 9, B and D) show that ASC and resveratrol resulted in essentially normal bones with complete prevention of the proliferative dystrophic cell responses. Pycnogenol treatment reduced but did not eliminate their incidence and severity (Fig. 9C). Thus resveratrol appears to be more potent than pycnogenol in the prevention of these dysplastic osteoblasts. The advantage of ASC over resveratrol appears to be that ASC promotes the differentiation of quiescent or inactive osteoblasts into plump active osteoblasts, whereas the subperiosteal osteoblasts in the resveratrol-treated mice appear inactive and are generally flattened with reduced cytoplasm (Fig. 9D, inset). The turbinates from CX-Pyc-ASC mice are indistinguishable from the CX-ASC mice, with no evidence of proliferation or loss of bone, with many of the subperiosteal osteoblasts being plump and active.
FIGURE 9.
A–D, shown are the effects of various antioxidants fed for 3 weeks as indicated on dystrophic osteoblasts in nasal turbinates of castrated GRKO male mice (hematoxylin and eosin stain). Insets show immunostaining of adjacent sections with osterix antibody and identify committed osteoblasts. Note that the subperiosteal cell mass in panel A (GRKO-CX on regular diet) contains osterix-positive cells at the apex of the cell mass and osterix-negative cells closer to the remnant bone indicating graded differentiation. B shows normal bone in ASC-fed mice. C and D show that pycnogenol reduces but does not eliminate the proliferation of immature osterix-positive osteoblasts, whereas resveratrol appears to have normalizing effects on the turbinate structure.
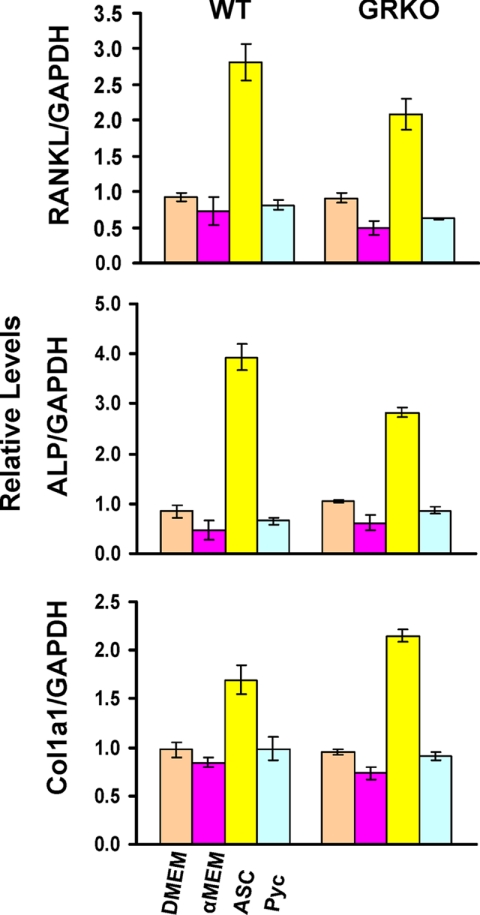
To rule out a possible osteoblast-secreted RANKL-mediated osteoclastogenesis versus a cell autonomous effect of ASC on osteoclasts, we performed in vitro studies to determine whether GRKO osteoblasts and/or ASC deficiency cause increased RANKL production in osteoblasts. Primary WT and GRKO calvarial osteoblasts and osteoblast precursors were treated for 48 h with ASC or pycnogenol. Fig. 10 shows that only ASC, but not pycnogenol, increases transcription of RANKL, ALP, and type 1 collagen, confirming that, at least in vitro, ASC is needed for full differentiation of osteoblasts. Moreover, low ASC concentrations, such as those of the GRKO mice, do not stimulate RANKL production and, thus, exclude a potential RANKL-dependent osteoclastogenesis as the mechanism for the increase in osteoclast number seen in the GRKO mice.
FIGURE 10.
Relative expression of RANKL, alkaline phosphatase (ALP), and type 1 collagen (Col1a1) mRNAs in primary calvarial osteoblast cultures from WT and GRKO mice grown in the indicated media for 48 h (DMEM, no ASC; α-minimum Eagle's medium (α-MEM) = <10 μg/ml ASC; ASC = long-acting ASC phosphate (30 μg/ml), and Pyc = pycnogenol 100 ng/ml). A statistical significant increase in gene expression is observed in response to ASC but not to pycnogenol, suggesting a specific transcriptional role for ASC.
DISCUSSION
Both aldehyde reductase and aldose reductase are able to metabolize d-glucuronate to l-gulonate, albeit with different catalytic efficiencies. The two enzymes have a similar Km for glucuronate (∼5 mm), although aldehyde reductase has a much higher catalytic efficiency (kcat) for glucuronate and is, thus, the dominant enzyme in this conversion (supplemental Fig. S5). The predominant presence of aldehyde reductase in liver, the sole site of ASC synthesis in capable mammals, is thus consistent with aldehyde reductase being the main enzyme. Clearly, aldose reductase is also able to contribute to the provision of l-gulonate for ASC synthesis. Our 2 mouse knock-out models, GRKO and ARKO, allow us to estimate that the two enzymes contribute ∼85 and ∼15% toward ASC synthesis, respectively. The GR/ARKO double knock-out mouse model has a ≥95% reduction in liver ASC levels and develops an ASC deficiency scurvy syndrome indistinguishable from that seen in the gulonolactone oxidase knock-out (GULOKO) mouse (supplemental Fig. S3). These in vivo studies firmly establish the enzymatic pathway for ASC synthesis (Fig. 1) and provide a quantitative and hitherto unappreciated potential regulatory step involving glucuronate substrate flow.
The recruitment of both GR and AR in the formation of ASC demonstrates a new physiological role for these two enzymes in mammals. We have also observed that cultured murine osteoblasts and osteoclast precursors (isolated bone marrow monocytes) express high levels of GR (data not shown). Because these cells cannot synthesize ASC, GR may have an additional role in these cells, perhaps in regulating cellular oxidative stress.
The ∼85% reduction in ASC synthesis nevertheless allows the GRKO mouse to grow and develop normally. The GRKO model with a marginal ASC production capacity, thus, allows studies of the effects of a variety of conditions that may lead to additional ASC requirements as well as further clarifications of ASC metabolic role(s). Although humans have lost the ability to synthesize ASC and are dependent on dietary intake, these models can allow in vivo studies of the role and mechanisms of ASC in organ development.
What is the nature of ascorbate metabolic actions? The effects of ASC on bone-forming osteoblasts and bone resorbing osteoclasts have been primarily studied in vitro. In osteoblasts, ASC is a positive regulator of matrix molecules production, increasing rates of both procollagen hydroxylation and secretion (37). It was proposed that ASC enhancement of the expression of several osteoblast markers, including alkaline phosphatase, osteocalcin, and RANKL are dependent on prior collagen triple helix formation and integrin-collagen interaction (38). However, the basis for such claims was the use of inhibitors of collagen hydroxylation (37), which are now recognized to inhibit many hydroxylation reactions. These reactions involve oxygenase enzymes and oxidative decarboxylation of α-ketoglutarate and require molecular oxygen and reduced ferrous iron (Fe2+). ASC maintains the iron in the reduced state and functions as a cofactor in a wide range of prolyl and lysyl hydroxylases that are important not only in collagen formation but also in the modulation of nuclear translocation of several transcription factors that are involved in the differentiation and development of bone and other tissues. ASC partly regulates osterix expression through the nuclear translocation and binding of NF-E2 related factor-1 (Nrf1) to an antioxidant response element upstream of its transcription start site to activate genes critical for osteoblast differentiation (32). Similarly, the nuclear translocation of the oxygen-dependent hypoxia-inducible factor, which is the mammalian oxygen sensor, is modulated in part by hydroxylation of proline and asparagine residues on its α-subunit, hypoxia-inducible factor-1α, by a family of conserved prolyl hydroxylases that require ASC as a cofactor (39). Clemens and co-workers (40, 41) recently demonstrated that hypoxia-inducible factor-1α promotes angiogenesis and osteogenesis by elevating vascular endothelial growth factor levels in osteoblasts. However, recent studies show that ASC deficiency has no significant effect on the hydroxylation of proline and collagen production in scorbutic GULOKO mice, suggesting a possible ASC-independent collagen hydroxylation mechanism (42). Cell-matrix interaction was also originally proposed as the basis for ASC modulation of chondrocyte differentiation, but this was subsequently shown to be independent of the production of a collagen-rich matrix (43).
Thus, ASC can play several roles in bone development and formation as a cofactor in several transcription and enzymatic reactions that regulate early osteoblast differentiation as well as the downstream biosynthesis of matrix molecules, especially collagen. Our studies in the GRKO mouse model provide the first in vivo evidence for a role for ASC in these processes. ASC has an additional important role in the suppression of osteoclast activity via a direct reactive oxygen species scavenger effect (34). The osteoclast parameters in the GRKO mice are significantly elevated in castrated mice leading to increased bone resorption, and this increase is blocked by ASC as well as the antioxidants pycnogenol and resveratrol, thus demonstrating an additional independent role for ASC as an antioxidant to suppress osteoclast activity.
These in vivo studies demonstrate that bone loss caused by low levels of sex steroids is significantly worsened in a situation where ASC levels are limited. Whether an organism (we used a mouse model, but human data in the literature point in the same direction) is able to synthesize or needs to acquire additional ASC from its diet, it is now clear from these data that low concentrations of ASC can significantly impact situations where increased oxidative stress is observed. Thus, the progressive decrease in sex steroids that accompanies aging may significantly affect the skeletal system because of the observed ASC effects on both the osteoblast and osteoclast compartments. Furthermore, the precise mechanisms of action of ASC on osteoblast differentiation and osteoclasts, not to mention a potential role on osteocytes, will require additional experimental approaches and studies.
Unfortunately, it is not possible at present to determine the adequacy of dietary recommended intake for ASC in humans. Although current recommendations may be valid for the prevention of scurvy, they are not necessarily appropriate for the prevention of osteoporosis. Our observations are consistent with the findings of the Women's Health Initiative Study alluded to earlier (5) of a lack of relation between total antioxidant intake and bone mass density but a significant relation between vitamin C intake and bone mass density in subjects on hormone replacement therapy and suggest the need for evaluation of the salutary effects of vitamin C in specific age groups of patients. The GRKO and associated mouse models described herein provide evidence for potential aspects of the development of human osteoporosis that are not easily approachable in the clinical setting. Human osteoporosis is a complex, multi-factorial, long term condition in which it is difficult to specifically isolate and assess ASC functional status. These mouse models may also be useful in the development of a long term practical biologic indicator that will allow the assessment of ASC sufficiency in terms of end-organ status.
Supplementary Material
Acknowledgments
We thank Drs. Caren Gundberg, Thomas Carpenter, Robert Brommage, and David Powell for helpful discussions and support, Kathy Henze, Mary Thiel, and Lazaro Pina for superb technical assistance, Dr. Jian Song for advice and help in colony management and surgery, and Michael Starbuck, The Bone Histomorphometry Core, and The Rolanette and Berdon Lawrence Bone Disease Program of Texas for expert histomorphometric analyses.
This work was supported by grants (to K. H. G.) from the Harry B & Aileen B Gordon Foundation, the Jacob & Louise Gabbay Foundation, the Agar Corporation, and USDA ARS 6250-51000-051.

The on-line version of this article (available at http://www.jbc.org) contains supplemental Figs. S1–S5.
K. H. Gabbay and K. M. Bohren, manuscript in preparation.
- ASC
- ascorbate or vitamin C
- AR
- aldose reductase
- GR
- aldehyde reductase
- GULO
- l-gulonolactone-γ-oxidase
- KO
- homozygous knockout
- CX
- castrate
- RANKL
- receptor activator for nuclear factor κB ligand
- MAR
- mineral apposition rate
- DMEM
- Dulbecco's modified Eagle's medium
- AKR
- aldo-keto reductase
- WT
- wild type
- BS
- bone surface
- μCT
- microcomputed tomography.
REFERENCES
- 1.Morton D. J., Barrett-Connor E. L., Schneider D. L. (2001) J. Bone Miner. Res. 16, 135–140 [DOI] [PubMed] [Google Scholar]
- 2.Simon J. A., Hudes E. S. (2001) Am J. Epidemiol. 154, 427–433 [DOI] [PubMed] [Google Scholar]
- 3.Sahni S., Hannan M. T., Gagnon D., Blumberg J., Cupples L. A., Kiel D. P., Tucker K. L. (2008) J. Nutr. 138, 1931–1938 [DOI] [PMC free article] [PubMed] [Google Scholar]
- 4.Sahni S., Hannan M. T., Gagnon D., Blumberg J., Cupples L. A., Kiel D. P., Tucker K. L. (2009) Osteoporos. Int. 20, 1853–1861 [DOI] [PMC free article] [PubMed] [Google Scholar]
- 5.Wolf R. L., Cauley J. A., Pettinger M., Jackson R., Lacroix A., Leboff M. S., Lewis C. E., Nevitt M. C., Simon J. A., Stone K. L., Wactawski-Wende J. (2005) Am. J. Clin. Nutr. 82, 581–588 [DOI] [PubMed] [Google Scholar]
- 6.Schnitzler C. M., Schnaid E., MacPhail A. P., Mesquita J. M., Robson H. J. (2005) Calcif. Tissue Int. 76, 79–89 [DOI] [PubMed] [Google Scholar]
- 7.Sato P., Udenfriend S. (1978) Arch. Biochem. Biophys. 187, 158–162 [DOI] [PubMed] [Google Scholar]
- 8.Beamer W. G., Rosen C. J., Bronson R. T., Gu W., Donahue L. R., Baylink D. J., Richardson C. C., Crawford G. C., Barker J. E. (2000) Bone 27, 619–626 [DOI] [PubMed] [Google Scholar]
- 9.Mohan S., Kapoor A., Singgih A., Zhang Z., Taylor T., Yu H., Chadwick R. B., Chung Y. S., Donahue L. R., Rosen C., Crawford G. C., Wergedal J., Baylink D. J. (2005) J. Bone Miner. Res. 20, 1597–1610 [DOI] [PubMed] [Google Scholar]
- 10.Kawai T., Nishikimi M., Ozawa T., Yagi K. (1992) J. Biol. Chem. 267, 21973–21976 [PubMed] [Google Scholar]
- 11.Kondo Y., Inai Y., Sato Y., Handa S., Kubo S., Shimokado K., Goto S., Nishikimi M., Maruyama N., Ishigami A. (2006) Proc. Natl. Acad. Sci. U.S.A. 103, 5723–5728 [DOI] [PMC free article] [PubMed] [Google Scholar]
- 12.Linster C. L., Van Schaftingen E. (2007) FEBS J. 274, 1–22 [DOI] [PubMed] [Google Scholar]
- 13.Bohren K. M., Bullock B., Wermuth B., Gabbay K. H. (1989) J. Biol. Chem. 264, 9547–9551 [PubMed] [Google Scholar]
- 14.Bohren K. M., Page J. L., Shankar R., Henry S. P., Gabbay K. H. (1991) J. Biol. Chem. 266, 24031–24037 [PubMed] [Google Scholar]
- 15.Gabbay K. H., Merola L. O., Field R. A. (1966) Science 151, 209–210 [DOI] [PubMed] [Google Scholar]
- 16.Gabbay K. H. (1973) N. Engl. J. Med. 288, 831–836 [DOI] [PubMed] [Google Scholar]
- 17.Oates P. J. (2008) Curr. Drug Targets 9, 14–36 [DOI] [PubMed] [Google Scholar]
- 18.Ho H. T., Chung S. K., Law J. W., Ko B. C., Tam S. C., Brooks H. L., Knepper M. A., Chung S. S. (2000) Mol. Cell. Biol. 20, 5840–5846 [DOI] [PMC free article] [PubMed] [Google Scholar]
- 19.MacKinnon R. (2004) Biosci. Rep. 24, 75–100 [DOI] [PubMed] [Google Scholar]
- 20.Pan Y., Weng J., Cao Y., Bhosle R. C., Zhou M. (2008) J. Biol. Chem. 283, 8634–8642 [DOI] [PMC free article] [PubMed] [Google Scholar]
- 21.Packer L., Rimbach G., Virgili F. (1999) Free Radic. Biol. Med. 27, 704–724 [DOI] [PubMed] [Google Scholar]
- 22.Rohdewald P. (2002) Int. J. Clin. Pharmacol. Ther. 40, 158–168 [DOI] [PubMed] [Google Scholar]
- 23.Baur J. A., Pearson K. J., Price N. L., Jamieson H. A., Lerin C., Kalra A., Prabhu V. V., Allard J. S., Lopez-Lluch G., Lewis K., Pistell P. J., Poosala S., Becker K. G., Boss O., Gwinn D., Wang M., Ramaswamy S., Fishbein K. W., Spencer R. G., Lakatta E. G., Le Couteur D., Shaw R. J., Navas P., Puigserver P., Ingram D. K., de Cabo R., Sinclair D. A. (2006) Nature 444, 337–342 [DOI] [PMC free article] [PubMed] [Google Scholar]
- 24.Omaye S. T., Turnbull J. D., Sauberlich H. E. (1979) Methods Enzymol. 62, 3–11 [DOI] [PubMed] [Google Scholar]
- 25.van den Hoogen B. M., van Weeren P. R., Lopes-Cardozo M., van Golde L. M., Barneveld A., van de Lest C. H. (1998) Anal. Biochem. 257, 107–111 [DOI] [PubMed] [Google Scholar]
- 26.Heinegård D., Tiderström G. (1973) Clin Chim. Acta 43, 305–310 [DOI] [PubMed] [Google Scholar]
- 27.Zambrowicz B. P., Abuin A., Ramirez-Solis R., Richter L. J., Piggott J., BeltrandelRio H., Buxton E. C., Edwards J., Finch R. A., Friddle C. J., Gupta A., Hansen G., Hu Y., Huang W., Jaing C., Key B. W., Jr., Kipp P., Kohlhauff B., Ma Z. Q., Markesich D., Payne R., Potter D. G., Qian N., Shaw J., Schrick J., Shi Z. Z., Sparks M. J., Van Sligtenhorst I., Vogel P., Walke W., Xu N., Zhu Q., Person C., Sands A. T. (2003) Proc. Natl. Acad. Sci. U.S.A. 100, 14109–14114 [DOI] [PMC free article] [PubMed] [Google Scholar]
- 28.Silver J., Keerikatte V. (1989) J. Virol. 63, 1924–1928 [DOI] [PMC free article] [PubMed] [Google Scholar]
- 29.Parfitt A. M., Drezner M. K., Glorieux F. H., Kanis J. A., Malluche H., Meunier P. J., Ott S. M., Recker R. R. (1987) J. Bone Miner. Res. 2, 595–610 [DOI] [PubMed] [Google Scholar]
- 30.Morello R., Bertin T. K., Chen Y., Hicks J., Tonachini L., Monticone M., Castagnola P., Rauch F., Glorieux F. H., Vranka J., Bächinger H. P., Pace J. M., Schwarze U., Byers P. H., Weis M., Fernandes R. J., Eyre D. R., Yao Z., Boyce B. F., Lee B. (2006) Cell 127, 291–304 [DOI] [PubMed] [Google Scholar]
- 31.Nakashima K., Zhou X., Kunkel G., Zhang Z., Deng J. M., Behringer R. R., de Crombrugghe B. (2002) Cell 108, 17–29 [DOI] [PubMed] [Google Scholar]
- 32.Xing W., Singgih A., Kapoor A., Alarcon C. M., Baylink D. J., Mohan S. (2007) J. Biol. Chem. 282, 22052–22061 [DOI] [PubMed] [Google Scholar]
- 33.Basu S., Michaëlsson K., Olofsson H., Johansson S., Melhus H. (2001) Biochem. Biophys. Res. Commun. 288, 275–279 [DOI] [PubMed] [Google Scholar]
- 34.Lean J. M., Davies J. T., Fuller K., Jagger C. J., Kirstein B., Partington G. A., Urry Z. L., Chambers T. J. (2003) J. Clin. Invest. 112, 915–923 [DOI] [PMC free article] [PubMed] [Google Scholar]
- 35.Lean J. M., Jagger C. J., Kirstein B., Fuller K., Chambers T. J. (2005) Endocrinology 146, 728–735 [DOI] [PubMed] [Google Scholar]
- 36.Lean J., Kirstein B., Urry Z., Chambers T., Fuller K. (2004) Biochem. Biophys. Res. Commun. 321, 845–850 [DOI] [PubMed] [Google Scholar]
- 37.Franceschi R. T. (1992) Nutr. Rev. 50, 65–70 [DOI] [PubMed] [Google Scholar]
- 38.Xiao G., Gopalakrishnan R., Jiang D., Reith E., Benson M. D., Franceschi R. T. (2002) J. Bone Miner. Res. 17, 101–110 [DOI] [PubMed] [Google Scholar]
- 39.Bruick R. K., McKnight S. L. (2001) Science 294, 1337–1340 [DOI] [PubMed] [Google Scholar]
- 40.Wang Y., Wan C., Deng L., Liu X., Cao X., Gilbert S. R., Bouxsein M. L., Faugere M. C., Guldberg R. E., Gerstenfeld L. C., Haase V. H., Johnson R. S., Schipani E., Clemens T. L. (2007) J. Clin. Invest. 117, 1616–1626 [DOI] [PMC free article] [PubMed] [Google Scholar]
- 41.Wan C., Gilbert S. R., Wang Y., Cao X., Shen X., Ramaswamy G., Jacobsen K. A., Alaql Z. S., Eberhardt A. W., Gerstenfeld L. C., Einhorn T. A., Deng L., Clemens T. L. (2008) Proc. Natl. Acad. Sci. U.S.A. 105, 686–691 [DOI] [PMC free article] [PubMed] [Google Scholar]
- 42.Parsons K. K., Maeda N., Yamauchi M., Banes A. J., Koller B. H. (2006) Am. J. Physiol. Endocrinol. Metab. 290, E1131–E1139 [DOI] [PubMed] [Google Scholar]
- 43.Sullivan T. A., Uschmann B., Hough R., Leboy P. S. (1994) J. Biol. Chem. 269, 22500–22506 [PubMed] [Google Scholar]
Associated Data
This section collects any data citations, data availability statements, or supplementary materials included in this article.


