

Abstract
In good accord with the protein aggregation hypothesis for neurodegenerative diseases, ALS-associated SOD1 mutations are found to reduce structural stability or net repulsive charge. Moreover there are weak indications that the ALS disease progression rate is correlated with the degree of mutational impact on the apoSOD1 structure. A bottleneck for obtaining more conclusive information about these structure-disease relationships, however, is the large intrinsic variability in patient survival times and insufficient disease statistics for the majority of ALS-provoking mutations. As an alternative test of the structure-disease relationship we focus here on the SOD1 mutations that appear to be outliers in the data set. The results identify several ALS-provoking mutations whose only effect on apoSOD1 is the elimination or introduction of a single charge, i.e. D76V/Y, D101N, and N139D/K. The thermodynamic stability and folding behavior of these mutants are indistinguishable from the wild-type control. Moreover, D101N is an outlier in the plot of stability loss versus patient survival time by having rapid disease progression. Common to the identified mutations is that they truncate conserved salt-links and/or H-bond networks in the functional loops IV or VII. The results show that the local impact of ALS-associated mutations on the SOD1 molecule can sometimes overrun their global effects on apo-state stability and net repulsive charge, and point at the analysis of property outliers as an efficient strategy for mapping out new ALS-provoking features.
Keywords: Mutant, Neurodegeneration, Protein Conformation, Protein Folding, Protein Stability, ALS, Protein Misfolding, Protein Aggregation, Structural Dynamics, Surface Hydrogen Bonds
Introduction
As in other soluble proteins, the charged and polar side chains of SOD1 are found in connection to the protein surface where they protrude freely into the solvent or are involved in solvent-accessible salt links and hydrogen bonds (Fig. 1). Replacement of such surface groups by point mutation has typically small effects on protein folding and stability. Even so, charged side chains have been observed to play key roles in controlling protein-protein interactions and aggregation. This control can either be exerted in the context of the folded structure by, e.g. providing edge protection of β-sheets (1, 2), or by modulation the aggregation propensity of the unfolded chain (1, 3). In this perspective it is interesting that 48 out of the 142 SOD1 mutations that have so far been linked to the neurodegenerative disease amyotrophic lateral sclerosis (ALS)2 involve charge replacements (4) (supplemental Table S1). Like most proteins, SOD1 carries a net negative charge under physiological conditions, which assure some degree of electrostatic repulsion between the molecular components in the crowded cellular interior. Strikingly, 83% of the ALS-mutations targeting SOD1 charges are found to decrease this net repulsive charge (5) and genetic data suggest the loss of a single negative charge is enough to trigger ALS (5). At the other end of the spectrum are the ALS-associated mutations of hydrophobic residues in the SOD1 interior and of the loop glycines (Fig. 1). The common effect of these mutations is to destabilise the SOD1 framework by shifting the folding equilibrium toward the denatured state. For some mutants, e.g. A4V and G93A, the protein is even destabilised to the extent that the nascent chain cannot fold under physiological conditions without oxidation of the Cys57–Cys146 disulfide bridge or acquisition of the native metals (6). Taken together, this tendency of the ALS-associated SOD1 mutations to reduce either repulsive charge or structural stability point at protein aggregation as a deterministic factor in ALS (5, 7). This physical-chemical link to protein aggregation complies also with the occurrence of pathological SOD1 inclusions in the spinal cord of ALS patients (8–11). Another conspicuous feature of the ALS mechanism is that several of the SOD1 mutations show a characteristic uniform disease progression. For example, the survival time after symptomatic onset for patients carrying the A4V is invariable short (<2 years), whereas the survival time for patients with the H46R is always very long (≫10 years). On this basis several investigations have been directed to examine if there is a coupling between the physical-chemical properties of the ALS-provoking SOD1 mutations and the severity of disease (12–14). That is, are the most perturbing mutations also the ones that cause the worse damage? Regarding the age of onset there is no apparent trend, most mutations for which reliable data are available has a mean age of onset of 46–47 years (14), indicating the ALS mechanism in this respect is different from that of Lund-Huntington disease where the length of the poly(Q) additions correlates with age of onset of clinical symptoms (15, 16). When it comes to the disease progression, however, the thermodynamic stability of the apoSOD1 species hints at a weak correlation with survival time after first diagnosis for a subset of non-charged ALS mutations selected on the basis of good clinical statistics (17). This trend has also been discerned with a more extensive set of ALS mutations even though the scatter of the data is close to abbreviate the significance of the signal (13). The main problem is uncertain survival statistics because of low patient numbers. For the majority (76%) of the ALS-associated SOD1 mutations there are less than 5 reported disease cases and this shortage of data is particularly alarming for mutations with long survival times (supplemental Table S1). In addition to this statistical uncertainty, however, there seems also to be mutations that simply break the pattern. A good example of such a statistically safe outlier is the mutation D101N. This mutation yields a thermal melting transition close to that of the wild-type protein and is still associated with patient survival times of <5 years (n = 17). In sharp contrast, the more destabilizing ALS mutation D90A displays typically survival times >5 years (n = 15) despite having the same effect on the net repulsive charge. Both mutations reduce the charge of the apoSOD1 monomer from −6 to −5 accordingly, it is reasonable to assume that these differences in survival time stem from specific effects on the SOD1 molecule or its interaction with cellular components that go beyond any underlying dependence on the global parameters net charge and thermodynamic stability. In this study, we have systematically tried to verify and extend the set of property outliers to see if these deviating SOD1 mutations can reveal new clues to the ALS mechanism. The analysis identifies 5 ALS-associated charge mutations with apo-state stabilities and global folding transitions identical to those of the wild-type protein, i.e. D76V, D76Y, D101N, N139D, and N139K. The results provide direct experimental support for the genetic indication that reduction of the net charge by just one unit induces ALS with high penetrance. Moreover, the data point at an additional molecular factor in the mechanism of SOD-induced ALS: the rupture of conserved hydrogen-bond networks at the SOD1 surface.
FIGURE 1.

The distribution of charged, polar, and hydrophobic amino acids in the SOD1 structure (PDB entry 1HL5) is shown as sticks. Positions with ALS-associated mutations are marked as spheres in the right monomer only. A, SOD1 dimer showing the positions of charged side chains, D (blue), E (light blue), K (red), and R (bright red), and histidines (cyan). B, structural positions of the polar (beige) side chains (S, T, C, N, and Q). C, structural positions of the hydrophobic (green) side chains (A, V, F, M, I, W, and L). Proline (white) and glycine (yellow). D, SOD1 amino acid sequence indicating the degree of side chain conservation across 17 eukaryotic species as visualized by Homologene (53). The degree of conservation is measured in bits (log2(20) = 4.3 bits, where 20 is the number of possible amino acids in a peptide chain). For each sequence position there is a stack of amino acid occurrences. The height of each stack indicates the sequence conservation for that position (54). The height of each letter reflects the relative frequency for the amino acid in question and the letter at the top of each stack is the most frequent in that position. Multiple alignments were made with the T-coffee software using default parameters (55). The consensus sequence was made with the WebLogo software (54).
EXPERIMENTAL PROCEDURES
All experiments were done on apo-protein under oxidizing conditions with the intramolecular disulfide bridge between Cys57 and Cys146 kept intact.
Protein Preparation
All mutants were made on a background of C6A/C111A and for the monomers on C6A/C111A/F50E/G51E. The proteins were coexpressed with the copper chaperone (yCCS) as described in Ref. 12. The apo-protein was prepared as described in Ref. 6. The standard buffer was 10 mm MES (pH 6.3) with 10 mm EDTA to maintain the proteins as metal-free.
Kinetic Measurements
Stopped-flow measurements were performed on a SX-17MV stopped-flow spectrofluorometer (Applied Photophysics, Leatherhead, UK) with excitation at 280 nm and emission detection above 320 nm using a cut-off filter. For slow relaxations, i.e. k < 0.003 s−1, additional measurements were done by manual mixing with detection on a FP-6500 spectrofluorometer (Jasco). All measurements were done at 25 °C and at a final SOD1 concentration of 4 μm monomer. Urea was used as denaturant (ultra PURE; MP Biomedicals, Solon, OH).
Data Analysis
Under the assumption of two-state kinetics for the apoSOD1 monomer (6), protein stability was derived from chevron data according to Equation 1,
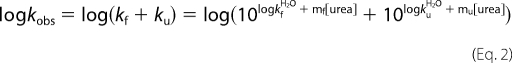
where ΔGD–M is the protein stability, KD–M = [D]/[M], ku is the unfolding rate constant, and kf is the unfolding rate constant. The plots of log kf and log ku versus [urea] were fitted by Refs. 6 and 18) in Equation 2,
 |
where kfH2O and kuH2O are the rate constants at [urea] = 0 m, and mf and mu are the slopes of the refolding and unfolding limbs, respectively. The stability changes caused by point mutations were calculated from Equation 3,
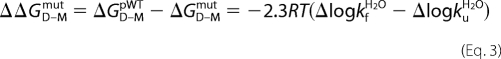 |
where ΔGD–MpWT is the stability of the pseudo-WT and ΔGD–Mmut is the stability of the mutant protein. ΔlogkfH2O and ΔlogkuH2O are the mutant-induced changes of the rate constants. The changes in stability upon mutation of dimeric apoSOD was calculated from 6 in Equation 4,
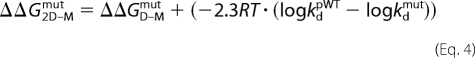 |
where logkd is the dimer dissociation rate constant at 5.8 m [urea]. For data analysis, we used KALEIDAGRAPH software (Synergy Software, Reading, PA).
Normalization of Protein Stabilities
To be able to compare mutant stabilities measured by denaturant-induced and thermal unfolding we normalized the data as follows. For denaturant-induced measurements, the normalized destabilization upon point mutation (ΔΔGnorm) was estimated as Equation 5,
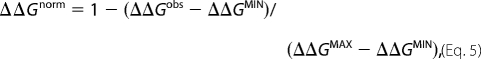 |
where ΔΔGobs is the observed destabilization for the mutation in question, and ΔΔGMAX and ΔΔGMIN are the maximum and minimum values of the dataset taken from Table 2 in Ref. 17. For the thermal data, ΔΔGnorm was correspondingly derived as Equation 6,
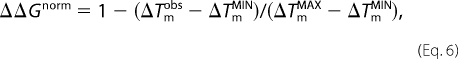 |
where the changes in melting temperatures upon point mutation ΔTmobs, ΔTmMAX, and ΔTmMIN were averages of the apo-monomer data in Refs. 19–23.
RESULTS AND DISCUSSION
Screening of ALS Mutations at the SOD1 Surface
To identify ALS-associated SOD1 mutations with minimal impact on structural stability we focused on a set of surface-associated positions at maximum distance from the dimer interface, i.e. D76V, D76Y, N86D, N86K, N86S, D90V, D90A, D101N, D101G, N139D, and N139K (Fig. 2). The apparent role of these residues is to form weak, peripheral solvent-accessible hydrogen bonds or salt links, and their mutation seems overall to cause minimal steric conflicts. The effect of the mutations on the structural stability and folding of the apoSOD1 molecule was determined by chevron analysis (6, 18). A particular advantage of this approach is that stability changes and perturbations of the folding process can be observed simultaneously from changes of folding and unfolding rate constants. Moreover, the use of urea as a denaturant reduces the risk of irreversibility artifacts because of aggregation of the unfolded protein. To further reduce the risk of erroneous disulfide cross-linking all experiments were done on the background C6A/C111A. Although these substitutions are somewhat destabilizing to the SOD1 structure this contribution cancels upon comparison of the pseudo-wildtype and mutant proteins (6). Finally, to assure monomeric apo-states, we added to all constructs the dimer-splitting substitutions F50E/G51E (24). Again, the small absolute effects of these substitutions are additive and cancel effectively upon comparative analysis of the pseudo-wild-type and mutant proteins (6).
FIGURE 2.

Structural positions of the ALS-associated SOD1 mutations examined in this study. Each mutant is color coded with a corresponding color-coded close-up on the affected hydrogen bonds. A, front view of SOD1 dimer and side view of monomer (PDB entry 1HL5). B–F, close-ups of the local structural environments of Asp90, Asn139, Asp76, Asn86, and Asp101, respectively.
Folding of apoSODpWT
The folding of wild-type apoSOD1, as well as the C6A/C11A pseudo wild-type variant (apoSODpWT), follow a three-state process (25), in which the monomer forms independently before the assembly of the final homodimeric structure (6, 26) in Scheme 1, where D is the denatured state, M is the folded monomer, M2 is the folded homodimer, kf and ku are the refolding and unfolding rate constants, and ka and kd the rate constants for dimer association and dissociation, respectively. Like other small globular proteins, the apoSOD1 monomer folds in a cooperative, two-state manner characterized by a classical V-shaped chevron plot (Fig. 3), where the ratio of ku and kf measures monomer stability (Equation 1). This cooperative formation of the apoSOD1 monomer is also the rate-limiting step for dimer formation. The small off-set of the refolding limbs (logkf versus [urea]) between the monomeric and dimeric SOD1 variants is caused by the dimer-splitting substitutions F50E/G51E (6). With respect to unfolding reaction, the apoSOD1 dimers show a downward kink in the chevron plots at 5 m urea where dimer dissociation (kd) becomes the rate-limiting step. Accordingly, any mutational perturbation of the stability or folding of the SOD1 monomers and dimers can be identified by characteristic alterations of their chevron plots (17).
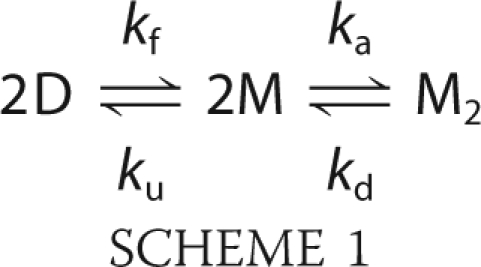
FIGURE 3.

Chevron plots of D76V, D76Y, N86D, N86K, and N86S. kf and ku are the rate constants for folding and refolding, respectively, and the dashed line shows the urea dependence of log kd. apoSODmonopWT (●), apoSODmonomut (○), apoSODdimerpWT (■) and apoSODdimermut (□). The units of [urea] and k are M and s−1, respectively.
D76V and D76Y
Our results show that the chevron plots of both the monomeric and homodimeric forms of apoSOD1D76V and apoSOD1D76Y are identical to those of the pseudo wild-type protein (Fig. 3). This suggest that mutational substitution of the Asp76 side chain at the surface of loop IV is structurally benign and has no significant impact on SOD1 stability of the way the protein attains its folded state in vitro. Yet, Asp76 displays a high degree of conservation across the SOD1 family (Fig. 1) indicating that the carboxylate moiety of this side chain plays an important functional or structural role.
The most obvious structural clue to what this role could be is a hydrogen bond to Gly73, close to the Zn ligand H71 (Fig. 2D). In addition, there are indications of a conserved salt link between Asp76 and Lys128 in loop VI (27) although this bond is missing or disorganised in several crystal structures, e.g. 1HL5 (28) and 1PUO (29). By these surface interactions Asp76 could provide specificity to the geometry of the peripheral turn of loop IV, affecting for example the accessibility of proteases to the putative nick sites at Arg69/Lys70 and the neighboring Lys75 (30). Even if the hydrogen bond and putative salt link do not contribute much to the thermodynamic stability of SOD1 structure they can still restrict the loop dynamics; because hydrogen bonds are inclined to be either fully formed or open to solvent interactions they provide some degree of click fit. Consistent with such an increased sensitivity to degradation, D76Y and the nearby mutation G72S show only half of the expected enzymatic turnover in erythrocytes from ALS patients (31, 32). It is also conceivable that Asp76 can modulate macromolecular association (1, 2) or be a key contributor to the electrostatic potential around the active site.
In line with the negligible effect of D76V and D76Y on SOD1 folding and stability, the few ALS patients diagnosed with these mutations display overall very slow disease progression. The survival times after first diagnosis are 19 years (n = 4) and 17/5 years (n = 2) for D76V and D76Y, respectively. It is also notable that the disease penetrance of D76Y is incomplete (31), indicating that the mutation just reaches the pathogenic threshold. The ALS-inducing property seems in this case to be the sole loss of a negative charge.
N86D, N86K, and N86S
The three ALS-associated mutations of Asn86 lead to characteristic perturbations the SOD1 stability that depends on the identity of the substitution (Fig. 3). N86K decreases the stability of the apoSOD1 monomer by a selective increase of the unfolding rate constant, ku. According to standard ϕ-value analysis (18) this suggest that the mutational perturbation sets in late in the folding process and affects mainly the fully structured apo-monomer (17). The most likely cause of the perturbation is steric clashes because the introduced side chain of Lys is larger than the original Asn. Consistently, mutation of Asn86 to the smaller side chains Asp and Ser yields no appreciable effect on the monomer stability. Even so, and more puzzlingly, all three mutations seem to weaken the strength of the dimer interface despite being located at the opposite ends the constituent monomers (Fig. 2E). The effect is manifested in an accelerated rate constant for dimer dissociation (kd) that is similar for all three mutations (Fig. 3). An explanation for this long-range coupling to the dimer interface is hinted by two hydrogen-bond links between Asn86 and the backbone of Asp124 (loop VII) that, in turn, propagates to the metal ions via hydrogen bonds to the Cu ligand His46 (β4) and the Zn ligand His71 (loop IV) (Fig. 2E). The final coupling to the dimer interface could then be mediated by altered dynamics of loop VII to the interface strand β8, or via loop IV and the metal coordination. It has been demonstrated in several earlier studies that loop IV forms an integral part of the dimer interface that is modulated by both the Cys57–Cys146 disulfide cross-link and metal binding; disulfide-reduced apoSOD1 molecules lose their ability to dimerize at μm concentration (6, 33, 34). Moreover, the dimer interface and metal-binding loops are found to be coupled dynamically through a high connectivity, interaction network (35). The importance of solvent-accessible hydrogen bonds for folding and stability of loops has also been demonstrated by the insertion of artificial side chain moieties in the WW domain (36).
In terms of disease progression, however, N86D, N86S, and N86K seem to follow a simplistic trend based on the extent of mutational perturbation, albeit that the patient statistics are still too sparse to be conclusive. The single ALS patient identified with N86D, involving a putatively protective increase of the net charge is still alive four years after onset and displays slow progression. The similarly destabilized N86S, which does not alter the charge, shows a survival time after first diagnosis of 6.8 years (n = 4), and the most perturbing N86K, which also involves a reduction of the net negative charge, shows a survival time of 1.7 years (n = 7) and complete disease penetrance. Another notable feature is that N86S and N86D have incomplete disease penetrance (14),3 indicating that marginally perturbing SOD1 mutations are indeed on the verge to provoke ALS.
D90V and D90A
From the chevron data it is apparent that the two mutations in position D90 destabilize selectively the apoSOD1 monomer, whereas the dimer interface is left relatively unaffected (Fig. 3). The chief effect is a selective increase of the unfolding rate constant for the monomeric species. This effect seems fully consistent with the structural location of the mutated side chain (Fig. 2B). By hydrogen bonding to the backbones of Asp92 and Gly93, the carboxylate of Asp90 supports the tight turn of loop V between β5 and β6. Loop V forms also the closest contact point between the edge strands 5 and 6 at the open side of the SOD1 half-barrel (Fig. 2B), and contains several ALS-provoking mutations, i.e. D90A/V and G93A/C/D/R/S/V. The higher destabilization observed for D90V could be that the substitution to Val, in addition to truncate the carboxylate hydrogen bonds, leads to steric conflicts at the protein surface. Another contributing factor could be the “inverse hydrophobic effect” where substitution of a solvent-exposed hydrophobic side chain to a polar ditto increases protein stability by destabilization of the unfolded state (37).
Again, the results provide weak indications that the extent of mutational perturbation scales with the pathogenic capacity. The average survival times after onset are 8 years (n = 15) and 2.7 (n = 3) for patients heterozygous for the D90A and D90V mutations, respectively. In addition to this, the disease penetrance and progression of D90A is notoriously variable with both rapidly progressing heterozygote patients and slowly progressing homozygote cases depending on the geographical region (14, 31, 38).
D101G and D101N
Interestingly, the structural impact of D101G and D101N is quite different. D101G leads to a pronounced destabilization of both the monomeric and dimeric apoSOD1 species whereas the mutation D101N appears perfectly wild-type like or even somewhat stabilizing. The significance, or cause, of this stabilization that is manifested in slight decrease of ku for the apoSOD1 monomer is yet not clear. In the folded state, Asp101 (β6) forms a seemingly critical and strictly conserved salt link with Arg79 (end of loop IV, close to β5). This salt link, which is also relatively embedded by the surrounding structure, could serve two roles. First, it bridges the edge strands β5 and β6 at their widest separation at the open end of the SOD1 half barrel (Fig. 2F). Second, it provides some specificity to the conformation of loop IV by a hydrogen-bond network that anchors Arg79 with the backbones of Pro74, His80, Val81, and Asp83 (Fig. 2F). From a structural perspective, the iso-steric substitution D101N would then be relatively benign by affecting only the electrostatic component of the interaction with the Arg79 head group, whereas the cavity-creating mutation D101G would be worse by also truncating several Van der Waals contacts. In the latter case, the perturbation seems further to propagate to the dimer interface. Despite these differences both D101N and D101G yield remarkably rapid disease progressions with survival times after first diagnosis of 2.3 years (n = 17) and 1.9 years (n = 3), respectively. By comparison with the structurally related mutation D90A, D101N seems thus to be disproportionally aggressive. In common with heterozygous D90A, however, D101N displays incomplete disease penetrance (39).
N139K and N139D
Our final choice of ALS-associated mutations fell on N139K and N139D that target a highly conserved position in the electrostatic loop VII. Of particular interest is that this pair of mutations involves both an increase and decrease of the net repulsive charge. The mutations affect mainly the two hydrogen bonds to Asn131 that runs along the small E133-T137 helix at the very surface of loop VII (Fig. 2C). Consistent with the surface-exposed position of Asn139, the mutations have no detectable effect on either the folding or stability of the apoSOD1 molecule (Fig. 4). Similar to D76Y, however, N139K displays only half of the normal SOD1 activity in lymphoblasts (40). A plausible explanation for this effect is that the mutation reduces the levels of mature SOD1 by introducing an addition protease cleavage site in loop VII, or makes the protein more susceptible to proteolytic cleavage by curbing the hydrogen bonds to Asn131. The obvious, yet unresolved, question is then if N139K, like D76Y, has a slow disease progression. It will also be interesting to find out if N139D has even lower disease impact (or is even a mistaken polymorphic variant), as this mutation does not introduce a new protease site, has smaller effect on the hydrogen bonding and also increases the net repulsive charge. For comparison, the related mutation N139H has a notably aggressive progression with a survival time of 3 years (n = 6) after first diagnosis but still incomplete penetrance (41). If the effect on stability of N139H is as modest as observed for N139K/D, it categorizes as a putative outlier together with D101N.
FIGURE 4.

Chevron plots of D90V, D90A (17), D101N, D101G, N139D, and N139K. apoSODmonopWT (●), apoSODmonomut (○), apoSODdimerpWT (■) and apoSODdimermut (□). The units of [urea] and k are M and s−1, respectively.
Critical Assessment of the Protein Aggregation Model
As a minimalist test of the role of SOD1 aggregation in the ALS mechanism, several studies have searched for simple relations between the physical-chemical properties of the ALS-provoking mutations and their associated clinical manifestation (12, 13, 17, 42). One of the most controversial result from these examinations is the indication of a correlation between the extent of SOD1 stability loss and patient survival time after first diagnosis (8–10). The key problem is that insufficient clinical statistics and an intrinsic variability of the disease progression for many ALS mutations render the data inconclusive. Nevertheless, the verification or falsification of such a correlation constitute a critical test of the aggregation hypothesis, and of the relation between ALS and other neurodegenerative diseases where the toxic gain-of-function has been linked to the aggregation propensity of the precursor proteins (15, 43). To illustrate the scatter of the data, an extended version of the stability-progression plot is shown in Fig. 5. In addition to the new data presented in Table 1, the plot includes additional new data for the mutations L38V, S105L, G114A, and L144S (supplemental Table S1) and data from Refs. 19–23. To allow comparison of urea- and thermal-denaturation experiments, the measured stabilities have been normalized as relative SOD1 destabilization (ΔΔGnorm.). Taken together, the data show no compelling correlation between ΔΔGnorm and disease progression. Even so, a basic pattern emerges in the distribution of data points upon separation of the mutations according to their effect on the SOD1 charges. Upon elimination of the few ALS mutations that increase the net repulsive charge (blue) it is apparent that the most destabilizing mutations show invariable very short survival times: the scatter in survival times for severely destabilizing mutations seems due to deviating charge replacements. The pattern complies nicely with assumption that increased repulsive charge is a protective factor because it opposes aggregation. These substitutions are also underrepresented in the list of ALS-associated mutations and have a slower than average disease progression, i.e. 7 years (blue only) versus 5.6 years (the rest) (Fig. 5). Vice versa, it is apparent that the mutations that decrease the net repulsive charge (red) are biased to lower values of ΔΔGnorm, and that the mutations at this end of the spectrum have more variable survival times. One interpretation of this ΔΔGnorm bias is that the ALS mutations that decrease the net repulsive charge require on the whole a lower stability cutback to reach the aggregation/toxic threshold. Another, more reductionist, explanation is that charge substitutions more frequently occur at the SOD1 surface where the stability losses are generally smaller. Neither of these explanations, however, provides a satisfactory answer to the increased scatter in disease progression. From the aggregation model it is expected that diminished repulsive charge would overall accelerate the disease, but clearly there are both short and long survival times at overlapping values of ΔΔGnorm. The question then arises, are the low-ΔΔGnorm mutations with rapid disease progression outliers? If so, these mutations would involve specific/local effects that add to the global parameters ΔΔGnorm and net repulsive charge. One such effect could be the rupture of conserved hydrogen bonds, or electrostatic networks, on the SOD1 surface that need not to affect the global protein stability (Figs. 3 and 4 and Table 1). From this perspective it is interesting to see that the most obvious outliers in Fig. 5 are all targeting conserved hydrogen bonds and salt links in loops IV and VII, i.e. N86K, D101N, D101G, D125H, and S134N. Stretching the point even further, elimination of all the mutants associated with the rupture of surface hydrogen bonds and charge alterations leaves a seemingly correlated data set with r = 0.78. The common feature of these remaining mutations is that they represent pure perturbations of the global SOD1 stability, either induced by steric obstruction or by the truncation of native, hydrophobic contacts. Even so, it is important to realize that, upon selective analysis of complex data sets, correlative patterns will eventually emerge by chance. Therefore we refrain from judging the significance of these data patterns: we just note that they can, tentatively, be rationalized according to a simplistic aggregation model.
FIGURE 5.

Plots of patient survival time after first diagnosis versus the stability loss of the ALS-provoking SOD1 mutation (ΔΔGnorm). Data are from supplemental Table S1. The dotted lines are tentatively set at 5 years to denote the division between short and medium/long survival times. A, plot of the combined data set, showing the mutations that do not affect charges (black), the mutations that decrease the net repulsive charge (blue), and the mutations that increase the net repulsive charge (red). Solid circles denotes n > 5 and open circles n < 5 (supplemental Table S1). The red, blue, and black arrows show the average ΔΔGnorm of each mutant group. B, subset of mutations that do not affect charges, hydrogen bonds or directly affect metal binding, yields an apparent correlation of r = 0.78. Although the statistical significance of these patterns are not yet clear, it is interesting to note that they comply with a reductionist disease model based on the propensity of SOD1 aggregation.
TABLE 1.
The kinetic parameters for the monomeric and dimeric apoSOD1 species analyzed in this study
Log kfH2O and log kuH2O are obtained from chevron data according to Eq. 2, ΔΔGD–M is derived from Eq. 3 and ΔΔGD–M2 is derived from Eq. 4. Log kd5.8M shows the dimer-dissociation rate constant at 5.8 m urea.
| apoSODmono | log kfH2O | log kuH2O | ΔΔGD–M | apoSODdimer | log kd5.8M | ΔΔGD–M2 |
|---|---|---|---|---|---|---|
| kcal/mol | kcal/mol | |||||
| pWT | −1.36 | −3.59 | – | pWT | −2.13 | – |
| L38Va | −1.62a | −2.19 | 2.25 | L38V | −1.4 | 3.24 |
| D76V | −1.24 | −3.32 | 0.20 | D76V | −2.23 | 0.06 |
| D76Y | −1.48 | −3.55 | 0.21 | D76Y | −2.22 | 0.09 |
| N86D | −1.33 | −3.59 | −0.05 | N86D | −1.4 | 0.94 |
| N86K | −1.46a | −3.20 | 0.66 | N86K | −1.58 | 1.41 |
| N86S | −1.25 | −3.53 | −0.07 | N86S | −1.75 | 0.45 |
| D90V | −1.18a | −2.37 | 1.41 | D90V | −1.8 | 1.85 |
| D90Ab | −1.54 | −3.28 | 0.66 | D90A | −2.14 | 0.65 |
| D101G | −1.44a | −3.14 | 0.72 | D101G | −1.64 | 1.39 |
| D101N | −1.31a | −4.12 | −0.80 | D101N | −2.09 | −0.75 |
| S105L | −1.20a | −2.10 | 1.81 | S105L | −1.55 | 2.60 |
| G114A | −1.98a | −2.52 | 2.33 | G114A | −1.44 | 3.27 |
| N139D | −1.43a | −3.64 | 0.01 | N139D | −2.4 | −0.36 |
| N139K | −1.30a | −3.48 | 0.06 | N139K | −2.0 | 0.24 |
| L144S | −1.39 | −3.47 | 0.20 | L144S | −1.49 | 1.07 |
Distribution of Charge Alterations among Patients with Rapid and Slow ALS Progression
Finally, as an independent test of how the ALS progression responds to the molecular identity of the SOD1 mutations, we examined the distribution of charge mutations among patient with short (<5 years, n = 546) and long (≥5 years, n = 233) survival time after first diagnosis. The reference set of 75 confirmed ALS-associated SOD1 mutations with progression data were obtained from Refs. 13, 14 and is listed in supplemental Table S2. The result shows that the proportion of charge-altering mutations is substantially higher in the ALS cases with slow disease progression. For survival times below and above 5 years the fractions of charge alterations are 30 and 50%, respectively (Fig. 6A). Looking at the absolute numbers of mutations, however, the charge alterations display no preference for long or short survival times but are equally distributed among short and long survival times (14 versus 14). The bias arises because the mutations that not affect charge have predominantly short survival times (33 versus 14) (Fig. 6B). Notably, the trend is even more apparent in relation to the total number of ALS cases with SOD1 mutations: charge replacements are found for 63% of the cases with slow disease progression but only for 19% of the cases with rapid progression (Fig. 6C). Rapid ALS progression is thus rarely associated with charge alterations. This observation, however, does not imply that charge alterations are protective as suggested in Ref. 13. Rather, these mutations seem to represent relatively mild perturbations, unless they involve substantial stability losses or the truncation of key hydrogen bonds (see Fig. 5). Loss of a single negative charge appears sufficient for ALS penetrance (5). The only molecular factor that is yet indicated to oppose ALS is the addition of extra negative charges to the SOD1 molecule (or loss of positive dittos), because these are under-represented among the disease-provoking mutations (5). Such a suppressing role of augmented repulsive charge is also in line the overall slow disease progression for the severely destabilizing mutations G41D (n = 15) and G93D (n = 7), where the similarly destabilized, but charge neutral, mutations G41S (n = 16) and G93A (n = 16) have clearly shorter survival times (Fig. 5). On this basis we conclude that, even if the relation between SOD1 stability and ALS progression is yet uncertain, there is a statistically significant overrepresentation of charge alterations among the ALS-associated mutations with survival times >5 years after first diagnosis.
FIGURE 6.

The statistical distribution of charge alterations among ALS-associated SOD1 mutations with survival times below and above 5 years after first diagnosis. A, fractions of the total number of different ALS mutations. B, absolute numbers of different ALS mutations. C, fractions of the total number of ALS cases involving SOD1 mutations.
Concluding Remarks
Naturally evolved proteins seem to employ two basic strategies to remain soluble in the crowded interior of the cell: (i) they protect potentially sticky epitopes in their folded interior (44), and (ii) they use charges to obstruct aggregation by negative design (1–3, 45, 46). If ALS is indeed linked to the precursor protein's intrinsic propensity to aggregate (47, 48), as is implicated for other protein-deposition diseases (44, 49–51), we would also expect a coupling between the outbreak/progression of the disease and the physical-chemical properties of the ALS-provoking SOD1 mutations. In the simplest case, with decreased protein stability because this increases the amount of unfolded and partly unfolded SOD1 material. The most apparent outliers in such a relation, if it exists, are the severely destabilized mutations with slow ALS progression and, vice versa, the marginally destabilized mutations with fast progression (Fig. 5). In the first set we find G41D and G93D that both increase the net repulsive charge. According to elementary electrostatic considerations these mutations are expected to suppress the aggregation propensity and, consistently, G41D is observed to aggregate less than the charge neutral but equally destabilizing mutation G41S (17). In the second set, intriguingly, we find mutations that target conserved hydrogen bond networks or electrostatic contacts at the surface of loops IV and VII. The mechanistic role of these mutations seems to extend beyond stability and charge of the apo-protein. One possibility is that they make the loop geometry more susceptible to distortions and breathing motions (35). This is perfectly consistent with the computational observation that altered loop dynamics modulates the aggregation of ALS-associated SOD1 mutants because of long-range communication within the SOD1 structure (52) (35). Such increased breathing of the loops could influence how SOD1 holds onto its metal cofactors and/or render the structure more sensitive to degradation by proteases. Some of these loop-targeting SOD1 mutations display also decreased protein levels/enzymatic turnover in human erythrocytes (31, 32, 42). Taken together, the results from this study point thus at the possibility that mutational perturbation of hydrogen bonds and electrostatic interactions at the SOD1 surface constitute an independent ALS factor that needs not to be accompanied by alterations of apoSOD1 stability or charge to trigger disease.
Supplementary Material
This work was supported in part by the Swedish Research Council, the Knut and Alice Wallenberg Foundation, the Bertil Hållsten Foundation, and Hjärnfonden.

The on-line version of this article (available at http://www.jbc.org) contains supplemental Tables S1 and S2.
P. M. Andersen, unpublished data.
- ALS
- amyotrophic lateral sclerosis
- MES
- 4-morpholineethanesulfonic acid
- PDB
- Protein Data Bank.
REFERENCES
- 1.Otzen D. E., Kristensen O., Oliveberg M. (2000) Proc. Natl. Acad. Sci. U.S.A. 97, 9907–9912 [DOI] [PMC free article] [PubMed] [Google Scholar]
- 2.Richardson J. S., Richardson D. C. (2002) Proc. Natl. Acad. Sci. U.S.A. 99, 2754–2759 [DOI] [PMC free article] [PubMed] [Google Scholar]
- 3.Chiti F., Stefani M., Taddei N., Ramponi G., Dobson C. M. (2003) Nature 424, 805–808 [DOI] [PubMed] [Google Scholar]
- 4.Alsod (2009) The ALS Online Database, http://alsod.iop.kcl.ac.uk/Als/index.aspx
- 5.Sandelin E., Nordlund A., Andersen P. M., Marklund S. S., Oliveberg M. (2007) J. Biol. Chem. 282, 21230–21236 [DOI] [PubMed] [Google Scholar]
- 6.Lindberg M. J., Normark J., Holmgren A., Oliveberg M. (2004) Proc. Natl. Acad. Sci. U.S.A. 101, 15893–15898 [DOI] [PMC free article] [PubMed] [Google Scholar]
- 7.Shaw B. F., Valentine J. S. (2007) Trends Biochem. Sci. 32, 78–85 [DOI] [PubMed] [Google Scholar]
- 8.Shibata N., Hirano A., Kobayashi M., Sasaki S., Kato T., Matsumoto S., Shiozawa Z., Komori T., Ikemoto A., Umahara T. (1994) Neurosci. Lett 179, 149–152 [DOI] [PubMed] [Google Scholar]
- 9.Shibata N., Hirano A., Kobayashi M., Asayama K., Umahara T., Komori T., Ikemoto A. (1993) Acta Histochem. Cytochem. 26, 619–622 [Google Scholar]
- 10.Watanabe M., Dykes-Hoberg M., Culotta V. C., Price D. L., Wong P. C., Rothstein J. D. (2001) Neurobiol. Dis. 8, 933–941 [DOI] [PubMed] [Google Scholar]
- 11.Jonsson P. A., Ernhill K., Andersen P. M., Bergemalm D., Brännström T., Gredal O., Nilsson P., Marklund S. L. (2004) Brain 127, 73–88 [DOI] [PubMed] [Google Scholar]
- 12.Lindberg M. J., Tibell L., Oliveberg M. (2002) Proc. Natl. Acad. Sci. U.S.A. 99, 16607–16612 [DOI] [PMC free article] [PubMed] [Google Scholar]
- 13.Wang Q., Johnson J. L., Agar N. Y., Agar J. N. (2008) Plos Biology 6, 1508–1526 [DOI] [PMC free article] [PubMed] [Google Scholar]
- 14.Andersen P. M. (2006) Curr. Neurol. Neurosci. Rep. 6, 37–46 [DOI] [PubMed] [Google Scholar]
- 15.Chen S. M., Ferrone F. A., Wetzel R. (2002) Proc. Natl. Acad. Sci. U. S.A. 99, 11884–11889 [DOI] [PMC free article] [PubMed] [Google Scholar]
- 16.Landles C., Bates G. P. (2004) EMBO Rep. 5, 958–963 [DOI] [PMC free article] [PubMed] [Google Scholar]
- 17.Lindberg M. J., Bystrom R., Boknas N., Andersen P. M., Oliveberg M. (2005) Proc. Natl. Acad. Sci. U.S.A. 102, 9754–9759 [DOI] [PMC free article] [PubMed] [Google Scholar]
- 18.Fersht A. (1999) Structure and Mechanism in Protein Science: a Guide to Enzyme Catalysis and Protein Folding, W.H. Freeman and Company, New York [Google Scholar]
- 19.Stathopulos P. B., Rumfeldt J. A., Scholz G. A., Irani R. A., Frey H. E., Hallewell R. A., Lepock J. R., Meiering E. M. (2003) Proc. Natl. Acad. Sci. U.S.A. 100, 7021–7026 [DOI] [PMC free article] [PubMed] [Google Scholar]
- 20.Stathopulos P. B. R. J., Karbassi F., Siddall C. A., Lepock J. R., Meiering E. M. (2006) J. Biol. Chem. 281, 6184–6193 [DOI] [PubMed] [Google Scholar]
- 21.Vassall K. A., Stathopulos P. B., Rumfeldt J. A. O., Lepock J. R., Meiering E. M. (2006) Biochemistry 45, 7366–7379 [DOI] [PubMed] [Google Scholar]
- 22.Rodriguez J. A., Shaw B. F., Durazo A., Sohn S. H., Doucette P. A., Nersissian A. M., Faull K. F., Eggers D. K., Tiwari A., Hayward L. J., et al. (2005) Proc. Natl. Acad. Sci. U.S.A. 102, 10516–10521 [DOI] [PMC free article] [PubMed] [Google Scholar]
- 23.Furukawa Y., O'Halloran T. V. (2005) J. Biol. Chem. 280, 17266–17274 [DOI] [PubMed] [Google Scholar]
- 24.Ferraroni M., Rypniewski W., Wilson K. S., Viezzoli M. S., Banci L., Bertini I., Mangani S. (1999) J. Mol. Biol. 288, 413–426 [DOI] [PubMed] [Google Scholar]
- 25.Levy Y., Wolynes P. G., Onuchic J. N. (2004) Proc. Natl. Acad. Sci. U. S. A. 101, 511–516 [DOI] [PMC free article] [PubMed] [Google Scholar]
- 26.Svensson A. K. E., Bilsel O., Kondrashkina E., Zitzewitz J. A., Matthews C. R. (2006) J. Mol. Biol. 364, 1084–1102 [DOI] [PubMed] [Google Scholar]
- 27.Tiwari A., Hayward L. J. (2005) Neurodegenerative Dis. 2, 115–127 [Google Scholar]
- 28.Strange R. W., Antonyuk S., Hough M. A., Doucette P. A., Rodriguez J. A., Hart P. J., Hayward L. J., Valentine J. S., Hasnain S. S. (2003) J. Mol. Biol. 328, 877–891 [DOI] [PubMed] [Google Scholar]
- 29.DiDonato M., Craig L., Huff M. E., Thayer M. M., Cardoso R. M., Kassmann C. J., Lo T. P., Bruns C. K., Powers E. T., Kelly J. W., et al. (2003) J. Mol. Biol. 332, 601–615 [DOI] [PubMed] [Google Scholar]
- 30.Hubbard S. J., Beynon R. J., Thornton J. M. (1998) Protein Eng. 11, 349–359 [DOI] [PubMed] [Google Scholar]
- 31.Andersen P. M., Nilsson P., Keranen M. L., Forsgren L., Hagglund J., Karlsborg M., Ronnevi L. O., Gredal O., Marklund S. L. (1997) Brain 120, 1723–1737 [DOI] [PubMed] [Google Scholar]
- 32.Orrell R. W., Habgood J. J., Gardiner I., King A. W., Bowe F. A., Hallewell R. A., Marklund S. L., Greenwood J., Lane R. J., deBelleroche J. (1997) Neurology 48, 746–751 [DOI] [PubMed] [Google Scholar]
- 33.Tiwari A., Hayward L. J. (2003) J. Biol. Chem. 278, 5984–5992 [DOI] [PubMed] [Google Scholar]
- 34.Ding F., Dokholyan N. V. (2008) Proc. Natl. Acad. Sci. U. S. A. 105, 19696–19701 [DOI] [PMC free article] [PubMed] [Google Scholar]
- 35.Khare S. D., Dokholyan N. V. (2006) Proc. Natl. Acad. Sci. U. S. A. 103, 3147–3152 [DOI] [PMC free article] [PubMed] [Google Scholar]
- 36.Ferguson N., Pires J. R., Toepert F., Johnson C. M., Pan Y. P., Volkmer-Engert R., Schneider-Mergener J., Daggett V., Oschkinat H., Fersht A. (2001) Proc. Natl. Acad. Sci. U.S.A. 98, 13008–13013 [DOI] [PMC free article] [PubMed] [Google Scholar]
- 37.Munoz V., Lopez E. M., Jager M., Serrano L. (1994) Biochemistry 33, 5858–5866 [DOI] [PubMed] [Google Scholar]
- 38.Andersen P. M., Sims K. B., Xin W. W., Kiely R., O'Neill G., Ravits J., Pioro E., Harati Y., Brower R. D., Levine J. S., et al. (2003) Amyotroph Lateral Scler Other Motor Neuron Disord 4, 62–73 [DOI] [PubMed] [Google Scholar]
- 39.Jones C. T., Shaw P. J., Chari G., Brock D. J. H. (1994) Mol. Cell Probes 8, 329–330 [DOI] [PubMed] [Google Scholar]
- 40.Pramatarova A., Figlewicz D. A., Krizus A., Han F. Y., Ceballos-Picot I., Nicole A., Dib M., Meininger V., Brown R. H., Rouleau G. A. (1995) Am. J. Hum. Genet. 56, 592–596 [PMC free article] [PubMed] [Google Scholar]
- 41.Nogales-Gadea G., Garcia-Arumi E., Andreu A. L., Cervera C., Gamez J. (2004) J. Neurol. Sci. 219, 1–6 [DOI] [PubMed] [Google Scholar]
- 42.Sato T., Nakanishi T., Yamamoto Y., Andersen P. M., Ogawa Y., Fukada K., Zhou Z., Aoike F., Sugai F., Nagano S., et al. (2005) Neurology 65, 1954–1957 [DOI] [PubMed] [Google Scholar]
- 43.Stefani M., Dobson C. M. (2003) J. Mol. Med. 81, 678–699 [DOI] [PubMed] [Google Scholar]
- 44.Chiti F., Dobson C. M. (2006) Annu. Rev. Biochem. 75, 333–366 [DOI] [PubMed] [Google Scholar]
- 45.Thirumalai D., Klimov D. K., Dima R. I. (2003) Curr. Opin. Struct. Biol. 13, 146–159 [DOI] [PubMed] [Google Scholar]
- 46.Rousseau F., Schymkowitz J., Serrano L. (2006) Curr. Opin. Struct. Biol. 16, 118–126 [DOI] [PubMed] [Google Scholar]
- 47.Furukawa Y., Kaneko K., Yamanaka K., O'Halloran T. V., Nukina N. (2008) J. Biol. Chem. 283, 24167–24176 [DOI] [PMC free article] [PubMed] [Google Scholar]
- 48.Shaw B. F., Lelie H. L., Durazo A., Nersissian A. M., Xu G., Chan P. K., Gralla E. B., Tiwari A., Hayward L. J., Borchelt D. R., Valentine J. S., Whitelegge J. P. (2008) J. Biol. Chem. 283, 8340–8350 [DOI] [PMC free article] [PubMed] [Google Scholar]
- 49.Balch W. E., Morimoto R. I., Dillin A., Kelly J. W. (2008) Science 319, 916–919 [DOI] [PubMed] [Google Scholar]
- 50.Luheshi L. M., Crowther D. C., Dobson C. M. (2008) Curr. Opin. Chem. Biol. 12, 25–31 [DOI] [PubMed] [Google Scholar]
- 51.Luheshi L. M., Tartaglia G. G., Brorsson A. C., Pawar A. P., Watson I. E., Chiti F., Vendruscolo M., Lomas D. A., Dobson C. M., Crowther D. C. (2007) Plos Biol. 5, 2493–2500 [DOI] [PMC free article] [PubMed] [Google Scholar]
- 52.Banci L., Bertini I., Boca M., Calderone V., Cantini F., Girotto S., Vieru M. (2009) Proc. Natl. Acad. Sci. U.S.A. 106, 6980–6985 [DOI] [PMC free article] [PubMed] [Google Scholar]
- 53.Homologene (2009) in http://www.ncbi.nlm.nih.gov/homologene
- 54.Crooks G. E., Hon G., Chandonia J. M., Brenner S. E. (2004) Genome Res. 14, 1188–1190 [DOI] [PMC free article] [PubMed] [Google Scholar]
- 55.Notredame C., Higgins D. G., Heringa J. (2000) J. Mol. Biol. 302, 205–217 [DOI] [PubMed] [Google Scholar]
Associated Data
This section collects any data citations, data availability statements, or supplementary materials included in this article.