Abstract
Filopodia are actin-rich finger-like cytoplasmic projections extending from the leading edge of cells. Unconventional myosin-X is involved in the protrusion of filopodia. However, the underlying mechanism of myosin-X-induced filopodia formation is obscure. Here, we studied the movements of myosin-X during filopodia protrusion using a total internal reflection microscope to clarify the mechanism of myosin-X-induced filopodia formation. Myosin-X was recruited to the discrete site at the leading edge where it assembles with exponential kinetics before the filopodia extension. The myosin-X-induced filopodia showed repeated extension-retraction cycles with each extension of 2.4 μm, which was critical to produce long filopodia. Myosin-X, lacking the FERM domain, could move to the tip as does the wild type. However, it was transported toward the cell body during filopodia retraction, did not undergo multiple extension-retraction cycles, and failed to produce long filopodia. During the filopodia protrusion, the single molecules of full-length myosin-X moved within filopodia. The majority of the fluorescence spots showed two-step photobleaching, suggesting that the moving myosin-X is a dimer. Deletion of the FERM domain did not change the movement at the single molecule level with the same velocity of ∼600 nm/s as wild-type, suggesting that the myosin-X in filopodia moves without interaction with the attached membrane via the FERM domain. Based upon these results, we have proposed a model of myosin-X-induced filopodia protrusion.
Keywords: Cell Migration, Fluorescence, Microscopic Imaging, Molecular Motors, Myosin
Introduction
Cells change their shape during the diverse motile processes, and the cytoskeletal structural reorganization is a fundamental element in cellular motility and contractile processes. There are two types of actin cytoskeletal architectures, filopodia and lamellipodia, both playing an important role in such motile events. Filopodia are slender projections, which extend from the leading edge of migrating cells and play an important role in a wide range of cell motilities such as cancer cell migration (1, 2) and neuronal path finding (3, 4). Although many studies have examined the role of actin and actin-binding proteins in the dynamics of membrane protrusion (5–7), recent attention has been given to myosin-X, a vertebrate-specific unconventional myosin, and its role in the production of filopodia (8–13). It has been shown that myosin-X localizes at the tips of filopodia (8, 10, 12), and importantly, myosin-X overexpression has been reported to induce filopodia protrusion (8, 11, 14). These findings have raised the idea that myosin-X plays a critical role in the production of filopodia.
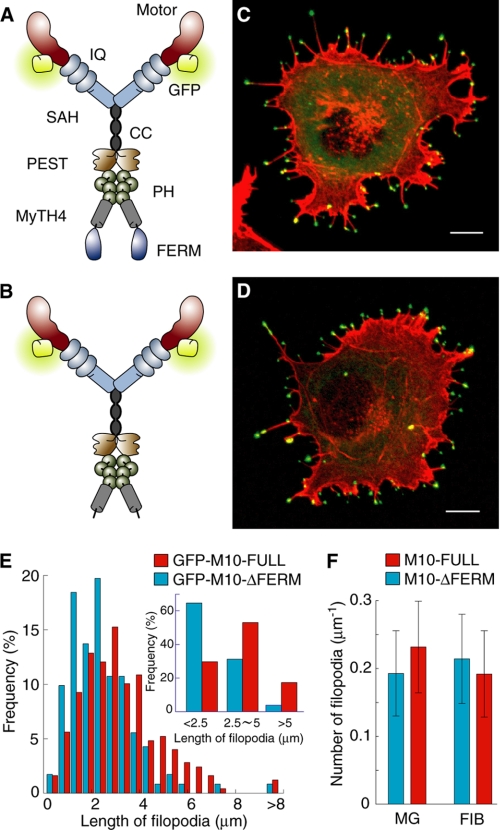
Myosin-X is composed of an N-terminal motor domain that hydrolyzes ATP and converts chemical energy to mechanical work; a neck region consisting of three IQ motifs that bind calmodulin light chains; a stable α-helix domain, which may lengthen the working stroke; a coiled-coil region for possible dimerization; and a unique globular tail domain at the C-terminal end (see Fig. 1A) (14, 15). The tail domain consists of Pleckstrin homology domains implicated in phosphatidylinositol 3-kinase signaling; a myosin tail homology 4 domain, which interacts with microtubules; and a protein 4.1, ezrin, radixin, moesin (FERM)2 domain, which may have a role for linking myosin-X to the membrane via integrin-β (11–13).
FIGURE 1.
M10-FULL and M10-ΔFERM fused with GFP. A and B, schematic images of M10-FULL (A) and M10-ΔFERM (B) fused with GFP. C and D, fluorescence confocal images of GFP-M10-FULL (C) and GFP-M10-ΔFERM (D) overexpressed in COS7 cells. Green indicates GFP fluorescent; red indicates actin labeled with Alexa Fluor phalloidin. Scale bars are 10 μm. E, filopodial lengths of cells expressing GFP-M10-FULL (red) or GFP-M10-ΔFERM (blue). The mean filopodial lengths of GFP-M10-FULL- and GFP-M10-ΔFERM-expressing cells were 3.6 ± 1.7 μm (n = 248 in 10 cells) and 2.3 ± 1.4 μm (n = 232 in 12 cells), respectively (p < 0.001 by paired t test). F, average number of filopodia per boundary length of cells expressing GFP-M10-FULL (red) or GFP-M10-ΔFERM (blue). We measured the average number of filopodia for two types of surface coating on the glass bottom dish (Matrigel (MG) and fibronectin (FIB)). The mean filopodial numbers of GFP-M10-FULL- and GFP-M10-ΔFERM-expressing cells on Matrigel coating were 0.23 ± 0.67 filopodia/μm (16 cells) and 0.19 ± 0.63 filopodia/μm (17 cells), respectively (p = 0.22). Those of fibronectin coating were 0.19 ± 0.64 filopodia/μm (18 cells) and 0.22 ± 0.68 filopodia/μm (13 cells), respectively (p = 0.57).
It was thought that the role of myosin-X in filopodia formation is the transportation of the specific cargo molecules to filopodia, which influence actin dynamics. However, we recently found that the myosin-X without the tail domain, including the FERM domain, can initiate filopodia upon dimer formation, suggesting that the dimer formation of myosin-X is critical for the initiation of filopodia (16). However the filopodia produced by myosin-X lacking the tail domain were short and unstable, unlike the filopodia induced by full-length myosin-X (10, 11). This finding suggests that the tail domain of myosin-X is necessary for producing long and stable filopodia. This observation is presumably due to the transportation of the cargo molecules that are required for the production of long and stable filopodia. But the underlying mechanism and the role of the tail domain are unknown.
In vitro assays have been performed to characterize the motor activities of myosin-X (17–19). It was shown by enzyme kinetic analysis that myosin-X is a high duty ratio motor that is suitable for a processive movement (17). On the other hand, another report suggested that myosin-X is a low duty ratio motor, although it may move processively in the cell while tethering with the membrane (18). It was reported that myosin-X moves processively along actin bundles, but not single actin filaments with a velocity of ∼600 nm/s (19). It was also suggested that myosin-X can transport its cargos in cells only in the places where actin forms bundles such as filopodia. Quite recently, it was reported that the movement of single myosin-X molecules toward the filopodial tips can be observed in living cells (20). Thus, the live imaging using the fluorescent microscope became the bridge between the in vitro properties of the molecules and their physiological function. Understanding the movement of myosin-X in filopodia is not simple. It is critical to directly observe the movements of myosin-X during various stages of filopodia protrusion (initiation, extension, and retraction) to understand the mechanism underlying myosin-X-induced filopodia formation.
In the present study, we observed the real-time movement of myosin-X fused with green fluorescent protein (GFP) in filopodia of living cells using a total internal reflection fluorescent (TIRF) microscope (21). This enabled us to specifically observe the filopodia attached to a glass surface in living cells. Using the kymograph method described recently (20) for the wild-type myosin-X movement, we analyzed the role of integrin-β binding FERM domain on the movements of myosin-X at the single-molecule level. Based upon the obtained results of TIRF observation of wild-type myosin-X (M10-FULL) and deletion mutant of FERM domain (M10-ΔFERM), we propose a working model of the myosin-X-induced filopodia-elongation mechanism.
EXPERIMENTAL PROCEDURES
Plasmid Construction
Bovine myosin-X cDNA fragments were kindly provided by Dr. D. P. Corey (Harvard University). The construction of the M10-FULL expression vector was described previously (8). The cDNA encoding amino acids 981–1752 was amplified by PCR and fused to pEGFP-C1/M10CC to generate the GFP-M10 mutant, which lacked the FERM domain (M10-ΔFERM).
Cell Culture and Transfection
African green monkey kidney COS7 cells (American Type Culture Collection) were cultured in Dulbecco's modified Eagle's medium supplemented with 10% fetal calf serum. Transient transfections were done with FuGENE 6 (Roche Biochemicals) according to the manufacturer's instructions. Cells were trypsinized at 16 h after transfection and replated on Matrigel (BD Bioscience)-coated coverslips for 3 h, then were observed by using a TIRF microscope.
Immunofluorescence Imaging
Immunofluorescence microscopy was performed as described previously (8). In brief, cells were cultured on Matrigel-coated coverslips and fixed with 4% formaldehyde, 2 mm MgCl2, 1 mm EGTA in phosphate-buffered saline for 10 min at room temperature, treated with 0.2% Triton X-100 in phosphate-buffered saline for 5 min, and washed with phosphate-buffered saline. For actin staining, the cells were incubated with Alexa Fluor phalloidin (Invitrogen) for 30 min at room temperature. Specimens were observed using a DM IRB laser scanning confocal microscope (Leica) controlled by TCS SP II system (Leica) equipped with a Plan-Apochromat (60/1.40 numerical aperture oil-immersion objective) at the appropriate binning of pixels and exposure time. The images were processed using Adobe Photoshop 7.0 software.
Microscopy
A TIRF microscope consists of an epifluorescent microscope (IX-71, Olympus Co.), objective lens (Olympus 60× PlanApo, 1.45 numerical aperture, and oil), and electron multiplier type charge-coupled device camera (EM-CCD, iXon DV887, Andor). An area of ∼30 × 30 μm2 was illuminated by a blue laser (488 nm, ∼1 microwatt/μm2 for each specimen, Furukawa) using total internal reflection irradiation. The fluorescence of GFP was filtered (transmission wavelength of the filter was 520–540 nm, Omega). The exposure times were 0.482 s (frame, 0.5 s) with 512 × 512 pixels or 0.098 s (frame, 0.1 s) with 256 × 256 pixels. Electron multiplier gain was 800 in a 0.482-s exposure and 600 in a 0.098-s exposure. The pixel size was 110 nm per a pixel.
For three-dimensional tracking of unattached filopodia, we used the same methods of three-dimensional confocal microscopy as previously reported (22). An area of ∼30 × 30 μm2 was illuminated by a blue laser (473 nm, ∼2 microwatts/μm2 for a specimen, Laser-Compact). The exposure times were 30 ms (frame, 31.8 ms) with 256 × 256 pixels. The objective was stepped every 1 μm per frame, and the nine confocal images were collected in one three-dimensional image. The pixel size was 106 nm per pixel. The computer obtained the position of the objective from the Piezo actuator, and the images from the charge-coupled device camera at the same time. Three-dimensional images were off-line reconstructed using these images and the position data.
The position of the puncta of GFP-fused myosin-X was determined with ∼2 nm accuracy by fitting the fluorescence image with two-dimensional Gaussian function (23). The images were processed with the software developed in-house by Visual Studio 6.0 (Microsoft) and Measurement Studio 6.1 (National Instruments).
RESULTS
To study the role of the globular tail domain on the movement and function of myosin-X in filopodia extension in living cell, we produced two GFP-tagged myosin-X constructs, a full-length construct (M10-FULL, 1–2052 amino acids) and a FERM domain-truncated construct (M10-ΔFERM, 1–1752 amino acids) (Fig. 1, A and B). We found that the overexpression of either M10-FULL or M10-ΔFERM induced a large number of filopodia, in which myosin-X localized at the filopodial tips (Fig. 1, C and D). The filopodia length induced by M10-ΔFERM was shorter than that by M10-FULL (Fig. 1E), whereas the number of filopodia was not affected by deleting the FERM domain (Fig. 1F). This is consistent with a previous report (11). The fluorescence intensity of GFP-tagged myosin-X constructs at the tip of the filopodia was quite strong, suggesting that the myosin-X molecules form a cluster at the tip (Fig. 1, C and D).
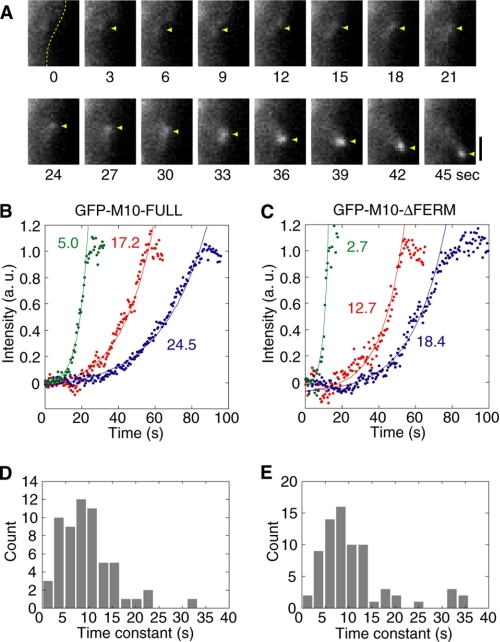
Using a TIRF microscope, we monitored the movement of myosin-X molecules in filopodia in detail during initiation, extension, and retraction of the filopodia protrusion processes (supplemental movies S1 and S2). As shown in Fig. 2A, M10-FULL started to assemble on the membrane at the leading edge, thus initiating the filopodium. Similar assembly of M10-ΔFERM was also observed (not shown), suggesting that the FERM domain is not critical for the assembly of myosin-X at the leading edge. We analyzed the kinetics of the assembly of myosin-X at the membrane using the GFP fluorescence intensity as an index (Fig. 2B). The increase in fluorescence intensity showed exponential kinetics. This result suggests that the rate of myosin-X assembly at the filopodia initiation site is proportional to myosin-X or myosin-X complex concentration at the initiation site. The exponential increment of the fluorescence was also observed for the M10-ΔFERM (Fig. 2C). The time constants of the exponential curves were plotted in the histograms for both constructs, and no obvious differences of the distributions were found (Fig. 2, D and E). These results suggest that the FERM domain is not essential for the initiation of the filopodia protrusion. This observation is consistent with previous results showing that the motor domain, but not the tail, is critical for the initiation step of filopodia formation (16). It should be mentioned that the accumulation of GFP signals plateaued after the exponential phase, and we found that this correlated with the movement of the spots toward filopodia.
FIGURE 2.
Assembly of myosin-X on the membrane when the protrusion was initiated. A, time courses of TIRF images during assembly of myosin-X in cells overexpressing M10-FULL. Scale bars are 1 μm. Yellow broken line shows the cell membrane. Yellow arrowheads indicate the protrusion site of the membrane. B and C, typical graphs of fluorescence intensities at the protrusion site with M10-FULL (B) and M10-ΔFERM (C). The fluorescence intensity was obtained by integrating the value of 5 × 5 pixels square, and then subtracting the background intensity estimated from the intensity of the boundary of the square. The photobleaching rate under the conditions used was determined by measuring the intensity of GFP fixed on the glass surface. The time constants were corrected with the photobleaching rate. Data were fitted to a single exponential curve (f(x) = I·exp{ − (x − x0)/τ}). The plots were normalized using the parameter of “I.” Values in panels indicate “τ,” which represents time constants. D and E, histograms of the time constants for M10-FULL (D) and M10-ΔFERM (E). The mean time constants were 9.8 ± 5.8 s (n = 60 in 11 cells) and 11.3 ± 8.2 s (n = 74 in 12 cells) for M10-FULL and M10-ΔFERM, respectively (p = 0.16 by paired t test).
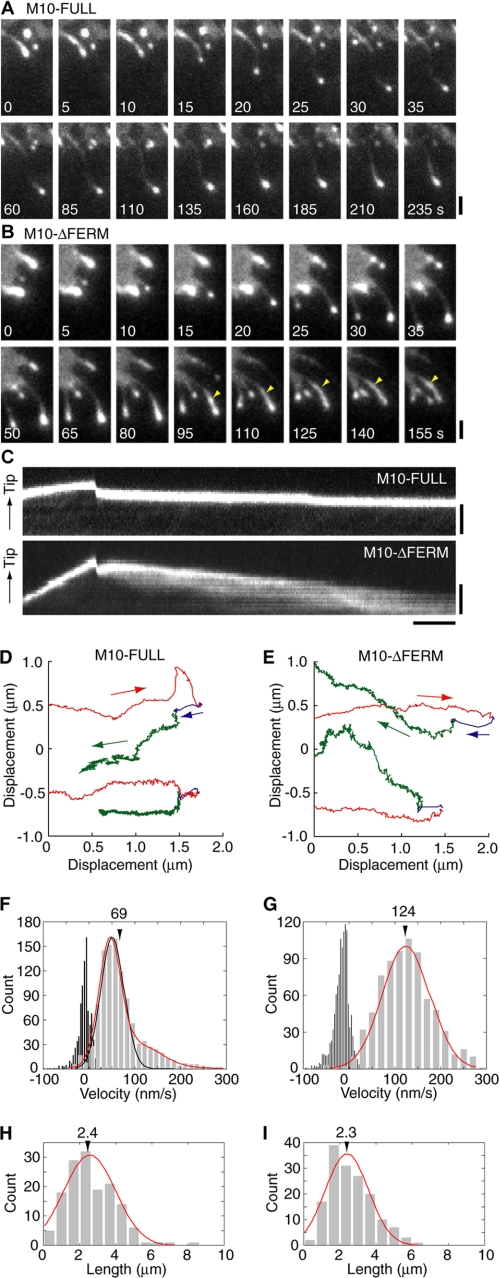
After the initiation of formation, the filopodium extended from the leading edge of the cells with myosin-X at the tips of the filopodium in living cells (Fig. 3, A and B). Fig. 3, A and B, shows sequential time-lapse images of GFP-M10 localized at the tip of extending filopodia. The filopodia showed sequential extensions and retractions, and M10-FULL remained at the tips during an entire protrusion cycle, i.e. an extension and retraction (Fig. 3, A and C (upper panel), and supplemental movie S3). In contrast, although M10-ΔFERM localized at the filopodial tips during the extension process, a part of the fluorescent puncta underwent a rearward movement during the retraction phase (Fig. 3, B and C (lower panel), and supplemental movie S4).
FIGURE 3.
Extension and retraction of filopodia overexpressing M10-FULL or M10-ΔFERM. A and B, time courses of TIRF images during the extension and retraction overexpressed M10-FULL (A) or M10-ΔFERM (B). Scale bars are 1 μm. C, kymograph along filopodial extension for overexpressed M10-FULL (upper) or M10-ΔFERM (lower). Scale bars are 5 s and 2 μm. D and E, typical traces of the tracking of tip positions from the initiation to the retraction in overexpressed M10-FULL (D) and M10-ΔFERM (E). These panels show x-y positions of the tracking. The time courses of the traces are shown in Fig. 4. Red, extension period; green, retraction period; and blue, rapid retraction. F and G, histograms of velocity every 1 s during the extension (gray) and every 2 s during retraction except for rapid retraction periods (black) in M10-FULL (F) and M10-ΔFERM (G). The black line in F and red line in G indicate fitting results with single Gaussian distribution. The red line in E indicates that of double Gaussian distribution. Mean values of the extension and the retraction of M10-FULL were 69 ± 50 and −10 ± 17 nm/s (n = 1047 and 906; 43 filopodia in 27 cells). Those of M10-ΔFERM were 124 ± 59 and −16 ± 20 nm/s (n = 737 and 1179; 49 filopodia in 29 cells), respectively (p < 0.001 by paired t test in the both the extension and the retraction). H and I, histograms of the length from the initial position to the position of the direction change for M10-FULL (H) and M10-ΔFERM (I). Lines indicate fitting of a single Gaussian function with peaks at 2.4 ± 1.4 μm for M10-FULL (n = 150 in 11 cells) and 2.3 ± 1.4 μm M10-ΔFERM (n = 157 in 14 cells) (p = 0.60). It should be noted that the bleaching time estimated by GFP photobleaching under the condition used in this study (100-ms exposure of the charge-coupled device) was much longer than the rate of decrease GFP-M10-ΔFERM fluorescence at the filopodial tips.
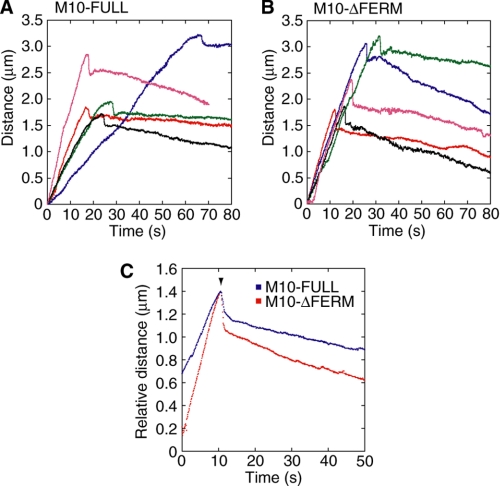
We analyzed the individual elastic movements of filopodial tips by monitoring the GFP signal of the myosin-X constructs (Fig. 3, D and E). We identified the tip of filopodia by weak background fluorescence due to GFP-myosin-X inside the filopodia that enabled us to distinguish the position of filopodial tip from the rest of the area. Filopodia were extended several microns from the cell body with significant flexibility, showing a “snake-like” track (Fig. 3, D and E, red), and then slowly retracted (Fig. 3, D and E, green). Fig. 4 shows the time courses of the distance of tip positions from the initiation. Interestingly, we found rapid retraction (shortening) of filopodia at the beginning of the retraction followed by a slow steady-state retraction (Fig. 3, D and E, blue, and Fig. 4). This phenomenon was observed in 85 of the total 96 traces (88.9%) for both constructs. The velocity of this rapid retraction was much larger than the average rate of actin retrograde flow (24, 25). The distance between the tip position and the initiation site was plotted as a function of time, and it was found that the extension velocity was decreased just before the rapid retraction (Figs. 3D, 3E, and 4). We monitored the velocity calculated with the distance-time plots (Fig. 4, A and B) for every 1 s during the extension and for every 2 s during the retraction periods except for the rapid retraction (Fig. 3, F and G). The graph for M10-ΔFERM was fitted with single Gaussian distribution with the peak of 113 nm/s and S.D. of 56 nm/s (Fig. 3G, red line), whereas that for M10-FULL was not well fitted with single Gaussian distribution (Fig. 3F, black line), but instead well fitted with a double Gaussian distribution (50 ± 25 nm/s and 108 ± 54 nm/s (peak ± S.D.) (Fig. 3F, red line). Because the values of 108 nm ± 54 nm of M10-FULL were very similar to those of M10-ΔFERM (113 ± 56 nm), it is thought that the FERM domain caused the second slow distribution of 50 nm/s during filopodia extension. It should be mentioned that these values agree with the movement of the filopodial tips obtained using a light-field imaging (26, 27). Because the FERM domain interacted with the membrane via integrin-β (11), the second peak of 50 nm/s (Fig. 3F) was likely to be due to the anchoring of myosin-X on the actin filament to the attached membrane.
FIGURE 4.
Movement of the filopodial tips of GFP-M10-FULL or GFP-M10-ΔFERM overexpressing cells. A and B, five typical traces of the distance of tip positions from the initiation to the retraction in overexpressed GFP-M10-FULL (A) and GFP-M10-ΔFERM (B). Each color indicates an individual filopodium. C, average traces for GFP-M10-FULL (blue, n = 43 in 27 cells) and GFP-M10-ΔFERM (red, n = 49 in 29 cells). Traces were averaged between the original position and the point where direction changed (arrowhead). The mean velocities of the extension just before the direction change were 79.3 nm/s and 128.8 nm/s for GFP-M10-FULL and GFP-M10-ΔFERM, respectively. Those of the retraction just after the direction change were 7.8 nm/s (GFP-M10-FULL) and 14.1 nm/s (GFP-M10-ΔFERM), respectively. The distances of the rapid retraction (arrowhead) were 241 ± 101 nm (GFP-M10-FULL) and 385 ± 200 nm (GFP-M10-ΔFERM) (p < 0.001 by paired t test). The durations of the rapid retraction were 1.9 ± 1.7 s for GFP-M10-FULL and 1.0 ± 0.5 s for GFP-M10-ΔFERM (p = 0.006). The maximum velocities of the rapid retraction were 461 ± 277 nm/s or GFP-M10-FULL and 927 ± 390 nm/s for GFP-M10-ΔFERM (p < 0.001).
Quite interestingly, the length of the filopodial extension during each cycle of protrusion, determined as the distance from the initiation site just before the rapid retraction, was ∼2.4 ± 1.4 μm (Fig. 3H). This was too short to explain the population of long filopodia (over 5 μm, Fig. 1E). With this length of filopodial extension, the probability of the formation of long protrusion of 5 μm was only 3.6% according to a Gaussian function with a peak at this mean value. Moreover, the length of the extension was not influenced by deletion of the FERM domain (Fig. 3I), whereas the overall length of the induced filopodia was significantly different between the two constructs (Fig. 1E). Although the mean of each extension length was not affected by FERM deletion, the extension time was shorter for M10-ΔFERM than M10-FULL, because the velocity increases by FERM deletion.
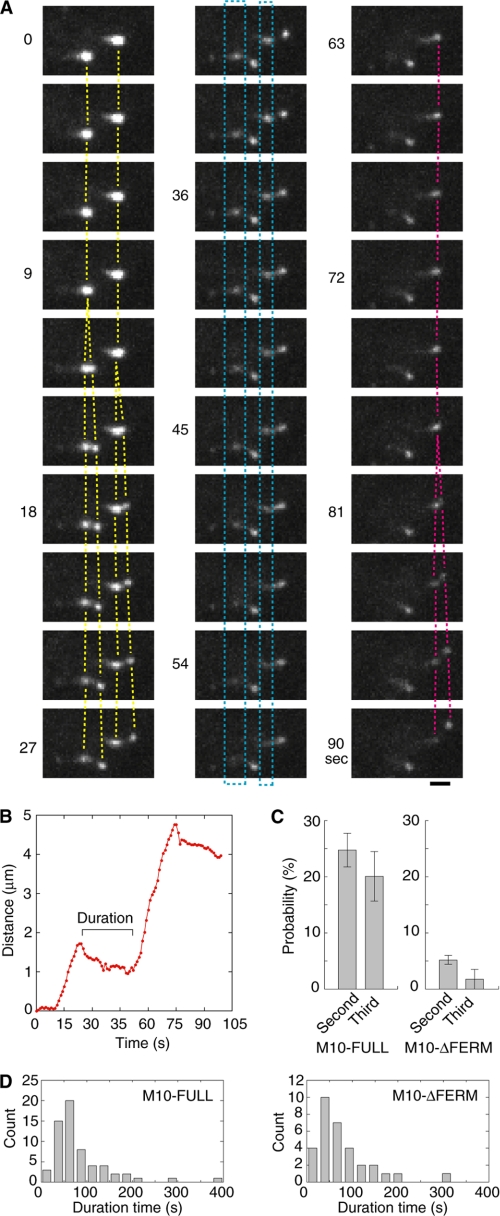
To understand this apparent discrepancy, we further analyzed the filopodia extension-retraction processes in living cells. A critical finding was that the filopodia showed multiple extension-retraction cycles (Fig. 5A, and supplemental movies S5 and S6). After the puncta of GFP-M10-FULL on the tip moved forward during the elongation, it slowly moved back and then divided into two spots; one moving forward and the other stationary during the next extension phase (Fig. 5A, yellow and red lines). The stationary spot began to diffuse slowly during the second filopodia extension phase (Fig. 5A, blue rectangles). This result suggests that the stationary GFP-myosin-X diffused without interacting with the actin filaments after the first retraction. On the other hand, the fluorescent spot moving forward toward the tip represents GFP-myosin-X interacting with actin. This finding indicates that the filopodia extension is achieved by this phased-extension (cycle-by-cycle) mechanism and, thus, producing long filopodia (Fig. 5B). Supporting this view, the deletion of the FERM domain greatly decreased the probabilities of the second/third extension (Fig. 5C), but not the extension length of each cycle (Fig. 3, H and I). This can explain why the overall length of the produced filopodia is significantly decreased by the deletion of the FERM domain (Fig. 1E). The time between the first and the second extension phase (duration time) was a little less for the FERM domain deletion mutant, i.e. 85 s for M10-FULL and 69 s for M10-ΔFERM, respectively (Fig. 5D). Because M10-ΔFERM tends to diffuse during the retraction phase, it would be less probable to induce the second filopodia extension phase at longer duration time.
FIGURE 5.
Phased extension of filopodia. A, time courses of TIRF images of phased extension in a M10-FULL-overexpressed cell. Yellow lines indicate the second extensions. Red lines indicate the third extension. Blue rectangles indicate the GFP fluorescence that gradually disappeared. Scale bar is 2 μm. B, typical trace of the tip position during the second and third extensions. Positions (red circle) were obtained every 1 s. C, probabilities of second/third extensions. 158 filopodia in 25 cells were counted for M10-FULL, and 1157 filopodia in 36 cells were counted for M10-ΔFERM. The error bars are standard errors. We monitored the phased retraction until each observed filopodium was completely retracted. Therefore, the absence of the second extension is not related to observation times (p < 0.001 by paired t test between M10-FULL and M10-ΔFERM). D, histograms of the duration times (see B) until the next extension for M10-FULL (left) and M10-ΔFERM (right). Mean duration times were 85.1 s (M10-FULL, n = 61 in 25 cells) and 68.9 s (M10-ΔFERM, n = 32 in 36 cells), respectively (p = 0.21).
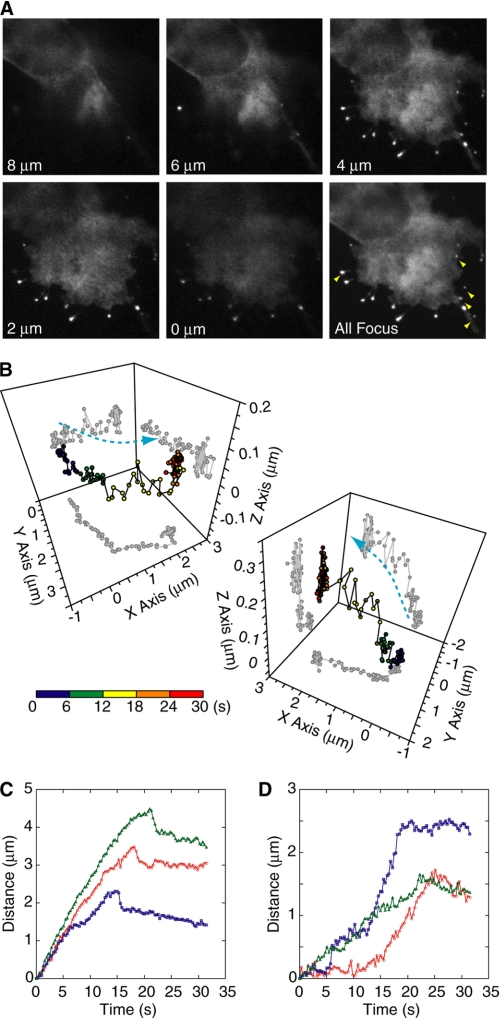
To investigate the relationship between the second extension and the cell adhesion, we observed the filopodia protrusion unattached to the substratum as well as those attached by using the three-dimensional confocal microscope (22). We succeeded in tracking 15 unattached filopodia from the initiation to the retraction (Fig. 6). Even though the myosin-X stayed on the filopodial tips, neither phased-extension nor rapid-retraction was observed for all the 15 unattached filopodia tested (Fig. 6, C and D). These results support the idea that adhesion is required for the phased extension of filopodia.
FIGURE 6.
Elongation of unattached filopodial tips using three-dimensional tracking technique. A, confocal images of GFP-M10-FULL-overexpressed cells at distinct focal planes. The lower right panel shows a projection of images collected from nine different focal planes. The glass surface was set to be at a 2-μm position. Yellow arrowheads indicate the unattached filopodia. B, typical traces of three-dimensional tracking of tips from attached (left) or unattached (right) filopodia. The color bar indicates the running time. C and D, three typical traces of the tip positions from initiation to retraction of attached (C) or unattached (D) filopodia in overexpressed GFP-M10-FULL. The distance was defined as the distance from the initiating position to the most distant point of the fluorescence spot to avoid the effect of filopodia swinging motion.
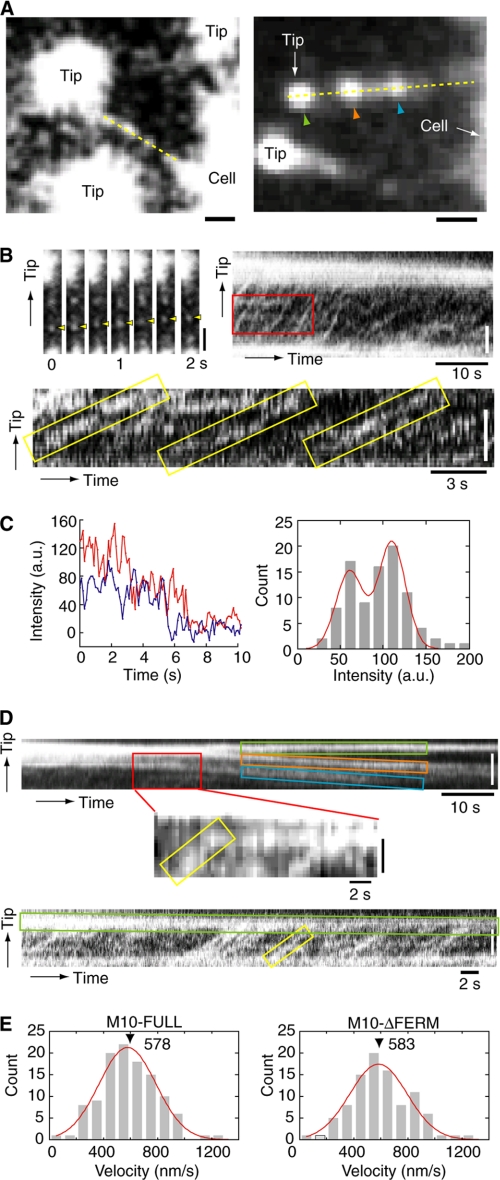
Next, we examined whether or not the association of myosin-X with integrin-β affects the movement of myosin-X in filopodia. To address this question, it is necessary to monitor the tracking of myosin-X movement within filopodia at the single molecule level (Fig. 7). Fig. 7B showed the movement of the GFP-M10-FULL single-fluorescent spot toward the tip of filopodium. The moving GFP spots showed either one- or two-step photobleaching. The majority of the GFP spots demonstrated two-step photobleaching (Fig. 7C, left). We made a histogram of the fluorescence intensities averaged for 1 s just after appearing of individual spots (Fig. 7C, right). The histogram showed two peaks (58 and 116 arbitrary units) with values corresponding to the fluorescence intensities of initial 1 s of one- and two-step photobleachings, respectively. It has been known that there is a significant fraction of non-fluorescent GFP (28), therefore our results suggest that the observed spots were single molecules of GFP-M10-FULL and that GFP-M10-FULL formed dimers in filopodia. Recently, Kerber et al. reported that the fluorescent spots of myosin-X moving in filopodia showed one-step but not two-step photobleaching (20), suggesting that the single-headed myosin-X may be able to continuously move in filopodia. Further study is required to clarify this point.
FIGURE 7.
Intrafilopodial movements of myosin-X and the effect of FERM domain deletion at the single molecule level. A, fluorescence images at high fluorescence sensitivity. Yellow lines indicate the regions of interest for kymograph. Scale bars are 1 μm. B, sequential images (upper left) and kymograph (upper right and lower) obtained from the yellow line on the left image in A. Yellow arrowheads in the upper left panel indicate the fluorescent spot moving toward the filopodia tip. The lower panel is a magnified image of the region indicated with a red rectangle on the upper panel. The time resolution was 0.1 s. The scale bars in the upper panels are 2 μm. C, photobleaching of GFP-M10-FULL in the filopodia. The left panel shows the typical photobleaching of fluorescent spot in filopodia. Red is two-step bleaching, and blue is one-step bleaching. The right panel shows the histogram of fluorescence intensities averaged for 1 s just after appearing of individual GFP spots (n = 91). The red line in the right panel is the fitting result with f(x) = a1·exp[−{(x − x0)/σ}2/2] + a2·exp[−{(x − 2·x0)/σ}2/2] (a1 = 15.1, a2 = 20.9, x0 = 58.1, and σ = 22.4). D, kymograph obtained from the yellow line in the right image in A before (upper) and after (lower) the GFP clusters of backward movements were photobleached. The middle panel is a magnified image of the region indicated with a red rectangle on the upper panel. The color of the rectangles corresponds with the color of the arrowheads of the right image in A. The time resolution is 0.3 s. The scale bars in the upper panels are 2 μm. Yellow rectangles in B and D indicate the movement of GFP-M10-FULL toward the filopodial tip. E, histograms of the forward velocity of myosin-X obtained by the kymographs for M10-FULL (left) and M10-ΔFERM (right). Lines indicate fittings of a single Gaussian function with peaks at 578 nm/s for M10-FULL (n = 112) and 583 nm/s for M10-ΔFERM (n = 94) (p = 0.67 by paired t test).
Because the fluorescence intensity of the puncta at tips was very strong, it caused a halation that concealed the signal of single GFP molecules when the excitation power or/and the sensitivity of the acquisition camera was increased (Fig. 7A and supplemental movie S7). Therefore, we used a kymograph method, by which the movements of GFP fluorophores could be identified even if the signal was lost intermittently during the course of unidirectional movement (Fig. 7B). Kerber et al. succeeded in observing the single molecule movements of myosin-X in filopodia by using this method and found the velocity of it was ∼600 nm/s (20). The unidirectional movements of myosin-X within filopodia are shown in Fig. 7B (yellow rectangles). The tangent of the kymographs indicates the velocity of the myosin-X. The histogram of the velocities of M10-FULL was fitted with a single Gaussian distribution with the peak of 578 nm/s (Fig. 7E, left), which is the same as previously reported (20) and over 5-fold higher than that of the puncta on the tip during the filopodia extension (Fig. 3). This value was similar to that obtained by an actin gliding assay and single molecular assay in vitro (17, 19), indicating that the myosin-X molecule moves with its maximum velocity in filopodia at room temperature. We did not detect the backward movements of myosin-X with the velocities similar to the forward movements (Fig. 7D). The fluorescence intensity of the spots moving backward was intense, suggesting that the myosin-X moved slowly while forming a cluster (Fig. 7D, upper panel, and supplemental movie S8). The velocity of myosin-X cluster moving backward within filopodial axis (∼30 nm/s) was corresponding to that of the actin retrograde flow (24, 25). Therefore, it is thought that myosin-X forms a cluster of molecules at the tip, where it binds at the barbed end of actin filaments and moves backward passively by the actin retrograde flow. On the other hand, the dimmer spots showed a rapid movement, which most likely represented single or a few molecules (Fig. 7D, middle panel).
To monitor more clearly the fast forward movement of individual myosin-X molecules during the filopodia retraction, the GFP clusters of backward movements were photobleached, and the forward movements of myosin-X were observed with the high gain of charge-coupled device sensitivity (Fig. 7D, lower). Although the myosin-X cluster moved backward with the slow retrograde flow, single molecules of myosin-X continuously moved forward with a fast velocity (∼600 nm/s) toward the tips. This indicated that the forward movement of myosin-X was independent of the backward movements of myosin-X cluster.
If the myosin-X interacted with the extracellular substrate-attached integrin-β via FERM domain during the fast movements, the velocity of M10-FULL would become slower than that of M10-ΔFERM. This might occur because the connection of the substrate and myosin-X via FERM and integrin-β causes the backward load against the myosin movement. However, the velocities of M10-ΔFERM were very similar to that of M10-FULL for both the mean value and the velocity distribution (Fig. 7E, right). This suggests that FERM did not influence the motor activity within the intra-filopodial movements. Therefore, our result suggests that myosin-X transports non-substrate engaged integrin-β toward the tip of filopodia. Alternatively, M10-FULL may not be bound to integrin-β but rather to other cargo, such as VASP, that has a role in filopodia elongation. M10-FULL may only engage with the integrin-β at the filopodial tips.
DISCUSSION
In this study, we attempted to clarify the mechanism by which myosin-X induces filopodia formation and extension. Various filopodial parameters determined in the present study are summarized in Table 1. The most intriguing finding is that the substrate-attached filopodia elongates with the phased-extension mechanism, in which a filopodium extends 2.4 μm per extension cycle. On the other hand, the nonattached filopodia did not show the phased elongation. Based upon the present findings, we think that myosin-X is responsible for the cell adhesion and elongates filopodia using the adhesive functions through the binding to presumably integrin-β (11). Supporting this view, we found that the FERM domain of myosin-X is important to increase the probability of succeeding extension after retraction. The elimination of the FERM domain resulted in the apparent diffusion of myosin-X during the retraction phase. The apparent diffuse images were in part due to the backward movement derived from the actin retrograde flow. However, GFP-M10-FULL was predominantly staying at the tips, suggesting that the FERM domain plays a role in attaching myosin-X at the tips. It was previously reported that the FERM domain of myosin-X interacts with integrin-β (11). We think that M10-FULL remains at the tip via interaction with the membrane mediated by the FERM domain/integrin-β binding and that this is crucial for subsequent extensions.
TABLE 1.
Summary for the experiments
All ranges are S.D.
| GFP-M10-FULL | GFP-M10-ΔFERM | |
|---|---|---|
| Length of filopodia in steady state (μm) | 3.6 ± 1.7 | 2.3 ± 1.4 |
| Average number of filopodia per boundary (number/μm) | ||
| Matrigel | 0.23 ± 0.67 | 0.19 ± 0.63 |
| Fibronectin | 0.19 ± 0.64 | 0.22 ± 0.68 |
| Assembling time (s) | 9.8 ± 5.8 | 11.3 ± 8.2 |
| Extension velocity (nm/s) | 69 ± 50 | 124 ± 59 |
| 79.3a | 128.8a | |
| Gaussian peaks (nm/s) | 50 ± 25, 108 ± 54 | 113 ± 56 |
| Retraction velocity (nm/s) | −10 ± 17 | −16 ± 20 |
| −7.8a | −14.1a | |
| Distances of the rapid retraction (nm) | 241 ± 101 | 385 ± 200 |
| 243a | 391a | |
| Maximum velocity of the rapid retraction (nm/s) | 461 ± 277 | 927 ± 390 |
| Length of the filopodial extension during each cycle (μm) | 2.4 ± 1.4 | 2.3 ± 1.4 |
| Probabilities of second extensions (%) | 25 ± 14 | 5.0 ± 1.0 |
| Probabilities of third extensions (%) | 20 ± 20 | 1.7 ± 1.7 |
| Duration time until next extension (s) | 85 ± 64 | 69 ± 45 |
| Velocity of Intra filopodial movements (nm/s) | 578 ± 210 | 583 ± 212 |
a Obtained from the average trace in Fig. 4.
Although the elimination of the FERM domain significantly decreases the second extension phase, the apparent duration between the first and the second extension was shortened by FERM elimination. We think that M10-ΔFERM can only induce the second extension before significant diffusion takes place, and this results in the apparent short duration time of M10-ΔFERM.
A model described by Mogilner and Rubinstein (29) estimated the limitation of the length of filopodia extension to be 2 μm, which agrees with our present results (Fig. 3, H and I). We think that the elastic relaxation of the membrane is necessary for the second extension and causes the duration period until the second extension. It is expected that the adhesion of filopodia to the substrate at the tips is responsible for the phased elongation.
Another interesting finding is the significant difference in the filopodia extension velocities between the cells expressing M10-FULL and M10-ΔFERM (Fig. 3). Although there was no difference in the motor activities between M10-FULL and M10-ΔFERM (Fig. 7E), the deletion of the FERM domain increased the extension velocity of filopodia (Fig. 3, F and G). The slow elongation (50 nm/s) of filopodia induced by M10-FULL (Fig. 3F) was possibly due to anchoring of myosin-X on the actin filaments to the membrane via FERM domain/integrin-β binding. It is plausible that myosin-X plays a role in both the cargo transport and the physical integrity of filopodia.
Our results showed that myosin-X moved along actin bundles with high velocity (∼600 nm/s) within filopodia, which is consistent with that of in vitro assay that myosin-X moved along actin bundles in filopodia at a single-molecule level (19). The value was similar to the velocity found in vitro of the tail-truncated forced dimer of myosin-X with free load conditions (30). This indicates that the full-length myosin-X is the fully activated form in filopodia and is likely to be a dimer, although myosin-X HMM in vitro is predominantly a monomer (14).
On the other hand, although we tried to observe the myosin-X motilities on the plasma membrane at the leading edge, no unidirectional movements, but only the diffusion movements, were observed (data not shown). This can be explained by the finding that myosin-X can move processively only where actin forms bundles (19). Alternatively, myosin-X is monomeric in cells before reaching the cell periphery and becomes a dimer at the root of filopodia (16). We found that myosin-X assembled at the leading edge with exponential kinetics to produce the base of filopodia. Because myosin-X selectively binds to the actin bundle (19), each myosin-X head may bind to two adjacent actin filaments within the actin bundle. We speculated that myosin-X stays on the barbed end of small actin bundles, which gathers myosin-X at the initiation site of short filopodia. This idea is based on our observation of the lateral movement of myosin-X cluster along the membrane (16). The bundling of the actin filaments is necessary for the initiation of the filopodia protrusion, and at least ten actin filaments are needed to overcome the membrane resistance for filopodia extension as previously reported (29). We hypothesize that the bridging of the actin filaments by myosin-X promotes the bundling of the actin like a zip fastener and induces the filopodia extension when the physical energy of polymerization of actin bundle dominates over the membrane tension. Different from the extension process, we think that the properties of the motor/neck domain of myosin-X, but not the FERM domain, are important for the initiation phase of filopodia formation (Fig. 2) (10, 14, 16).
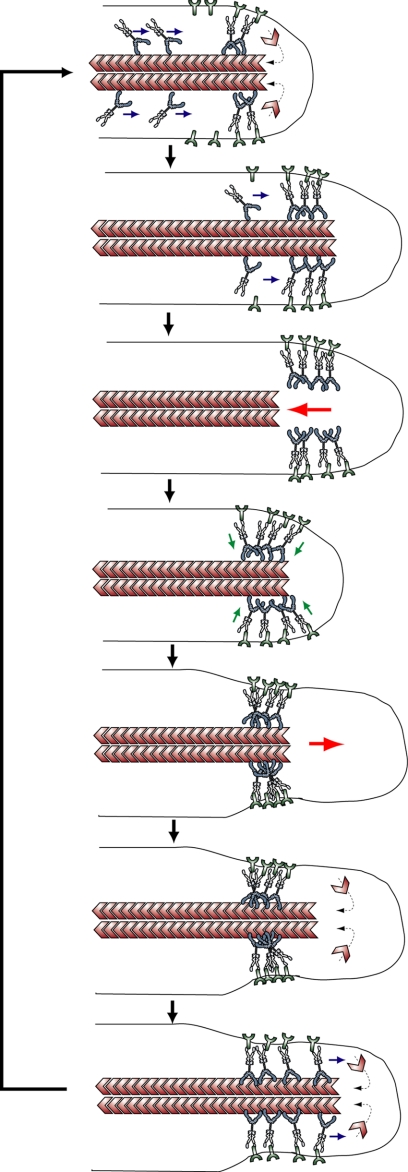
Based on the present findings, we propose the following model for the mechanism of myosin-X-induced filopodia protrusion (Fig. 8). At the filopodia initiation, the myosin-X molecules are recruited to the discrete place at the plasma membrane, where they form a dimer by the binding with their cargo molecules. This forms a base of filopodia. The increase in the local concentration of myosin-X and its partner molecules may enhance the rate of recruitment of the molecules, explaining the exponential increase in myosin-X recruitment (Fig. 2). The two-headed myosin-X moves toward the plus-end of the actin filament toward the tip of the filopodia without obstruction to transport the cargo molecules. At the induced filopodial tips, actin monomers polymerize to elongate actin filaments, thereby protruding the membrane (24, 25). When the clutch between actin and the substrate (or cell adhesion protein) is disrupted, actin filaments move toward the cell body by a retrograde flow (31–33). During this retraction stage, the cell adhesion complex, including integrin-β, keeps linking the membrane to the substrate, while myosin-X remains at the tip by binding to the membrane via FERM domain/integrin-β interaction. When backward tension overcomes the adhesion binding force, the membrane near the tip rapidly shrinks (Figs. 3D, 3E, and 4). Myosin-X molecules at the shrunken tip then rebind to the actin filament. While a part of the myosin-X moves back with retrograde flow, new myosin-X moves toward the tips. Because the unattached filopodia do not show multiple elongation-retraction cycles, the interaction of myosin-X and the substrate-engaged integrin is necessary for the phased elongation. Assuming that the myosin-X on the tip links the actin bundle and the extracellular substrate-associated membrane, myosin-X presumably creates a space for promoting the actin polymerization. In the absence of the FERM domain, the termination of actin polymerization results in myosin-X diffused in the filopodia without remaining at the tips, because myosin-X cannot bind to membrane localized there (Fig. 3).
FIGURE 8.
A model for myosin-X-induced filopodial extension. The model is described in the text. Myosin-X moves to the filopodial tip with integrin-β. The myosin-X/integrin-β is accumulated at the tip. During actin retrograde flow, myosin-X stays at the tip as a result of binding to integrin. Filopodia rapidly shrinks presumably due to the detachment of the tip from the substrate. Myosin-X re-binds to actin and produces force that squeezes the membrane to produce room for actin filaments to elongate. Actin filaments extend and myosin-X moves toward the tip.
In summary, the dynamic movement of myosin-X during filopodia protrusion was monitored using a TIRF microscope in live cells to clarify the mechanism of filopodia elongation by myosin-X. We reported previously that the formation of myosin-X dimers with appropriate neck lengths is important for the induction of filopodia (16). This suggests that the proper orientation and span of the two heads may be critical for the initiation of filopodia. However, it is still obscure how myosin-X can initiate filopodia formation and promote the phased extension. It is plausible that myosin-X has a unique feature to generate the force thereby promoting the cytoskeletal structural change and membrane extension. The question remains unsolved concerning the significance of the 2.4-μm “unit” of filopodia extension.
Supplementary Material
Acknowledgments
We gratefully acknowledge Dr. Richard Fenton (University of Massachusetts Medical School) and Peter Karagiannis for critical reading of this manuscript and thank Keiko Yoshizawa and Shugo Nishiyama for experiment preparation.
This work was supported, in whole or in part, by National Institutes of Health Grants DC006103, AR048526, and AR048898. This work was also supported by a grant-in-aid for young research (B) and PRESTO of Japan Science and Technology Corporation (JST).

The on-line version of this article (available at http://www.jbc.org) contains supplemental movies S1–S8.
- FERM
- 4.1, ezrin, radixin, moesin
- GFP
- green fluorescent protein
- TIRF
- total internal reflection fluorescent.
REFERENCES
- 1.Bennett R. D., Mauer A. S., Strehler E. E. (2007) J. Biol. Chem. 282, 3205–3212 [DOI] [PubMed] [Google Scholar]
- 2.Wicki A., Lehembre F., Wick N., Hantusch B., Kerjaschki D., Christofori G. (2006) Cancer Cell 9, 261–272 [DOI] [PubMed] [Google Scholar]
- 3.Bentley D., O'Connor T. P. (1994) Curr. Opin. Neurobiol. 4, 43–48 [DOI] [PubMed] [Google Scholar]
- 4.Lewis A. K., Bridgman P. C. (1992) J. Cell Biol. 119, 1219–1243 [DOI] [PMC free article] [PubMed] [Google Scholar]
- 5.Biyasheva A., Svitkina T., Kunda P., Baum B., Borisy G. (2004) J. Cell Sci. 117, 837–848 [DOI] [PubMed] [Google Scholar]
- 6.Nakagawa H., Miki H., Nozumi M., Takenawa T., Miyamoto S., Wehland J., Small J. V. (2003) J. Cell Sci. 116, 2577–2583 [DOI] [PubMed] [Google Scholar]
- 7.Lebrand C., Dent E. W., Strasser G. A., Lanier L. M., Krause M., Svitkina T. M., Borisy G. G., Gertler F. B. (2004) Neuron 42, 37–49 [DOI] [PubMed] [Google Scholar]
- 8.Tokuo H., Ikebe M. (2004) Biochem. Biophys. Res. Commun. 319, 214–220 [DOI] [PubMed] [Google Scholar]
- 9.Sousa A. D., Cheney R. E. (2005) Trends Cell Biol. 15, 533–539 [DOI] [PubMed] [Google Scholar]
- 10.Bohil A. B., Robertson B. W., Cheney R. E. (2006) Proc. Natl. Acad. Sci. U.S.A. 103, 12411–12416 [DOI] [PMC free article] [PubMed] [Google Scholar]
- 11.Zhang H., Berg J. S., Li Z., Wang Y., Lång P., Sousa A. D., Bhaskar A., Cheney R. E., Strömblad S. (2004) Nat. Cell Biol. 6, 523–531 [DOI] [PubMed] [Google Scholar]
- 12.Berg J. S., Derfler B. H., Pennisi C. M., Corey D. P., Cheney R. E. (2000) J. Cell Sci. 113, 3439–3451 [DOI] [PubMed] [Google Scholar]
- 13.Chishti A. H., Kim A. C., Marfatia S. M., Lutchman M., Hanspal M., Jindal H., Liu S. C., Low P. S., Rouleau G. A., Mohandas N., Chasis J. A., Conboy J. G., Gascard P., Takakuwa Y., Huang S. C., Benz E. J., Jr., Bretscher A., Fehon R. G., Gusella J. F., Ramesh V., Solomon F., Marchesi V. T., Tsukita S., Tsukita S., Hoover K. B. (1998) Trends Biochem. Sci. 23, 281–282 [DOI] [PubMed] [Google Scholar]
- 14.Berg J. S., Cheney R. E. (2002) Nat. Cell Biol. 4, 246–250 [DOI] [PubMed] [Google Scholar]
- 15.Knight P. J., Thirumurugan K., Xu Y., Wang F., Kalverda A. P., Stafford W. F., 3rd, Sellers J. R., Peckham M. (2005) J. Biol. Chem. 280, 34702–34708 [DOI] [PubMed] [Google Scholar]
- 16.Tokuo H., Mabuchi K., Ikebe M. (2007) J. Cell Biol. 179, 229–238 [DOI] [PMC free article] [PubMed] [Google Scholar]
- 17.Homma K., Ikebe M. (2005) J. Biol. Chem. 280, 29381–29391 [DOI] [PubMed] [Google Scholar]
- 18.Kovács M., Wang F., Sellers J. R. (2005) J. Biol. Chem. 280, 15071–15083 [DOI] [PubMed] [Google Scholar]
- 19.Nagy S., Ricca B. L., Norstrom M. F., Courson D. S., Brawley C. M., Smithback P. A., Rock R. S. (2008) Proc. Natl. Acad. Sci. U.S.A. 105, 9616–9620 [DOI] [PMC free article] [PubMed] [Google Scholar]
- 20.Kerber M. L., Jacobs D. T., Campagnola L., Dunn B. D., Yin T., Sousa A. D., Quintero O. A., Cheney R. E. (2009) Curr. Biol. 19, 967–973 [DOI] [PMC free article] [PubMed] [Google Scholar]
- 21.Sako Y., Yanagida T. (2003) Nat. Rev. Mol. Cell Biol. 4, SS1–SS5 [PubMed] [Google Scholar]
- 22.Watanabe T. M., Higuchi H. (2007) Biophys. J. 92, 4109–4120 [DOI] [PMC free article] [PubMed] [Google Scholar]
- 23.Yildiz A., Forkey J. N., McKinney S. A., Ha T., Goldman Y. E., Selvin P. R. (2003) Science 300, 2061–2065 [DOI] [PubMed] [Google Scholar]
- 24.Vallotton P., Danuser G., Bohnet S., Meister J. J., Verkhovsky A. B. (2005) Mol. Biol. Cell 16, 1223–1231 [DOI] [PMC free article] [PubMed] [Google Scholar]
- 25.Vallotton P., Gupton S. L., Waterman-Storer C. M., Danuser G. (2004) Proc. Natl. Acad. Sci. U.S.A. 101, 9660–9665 [DOI] [PMC free article] [PubMed] [Google Scholar]
- 26.Sheetz M. P., Wayne D. B., Pearlman A. L. (1992) Cell Motil. Cytoskeleton 22, 160–169 [DOI] [PubMed] [Google Scholar]
- 27.Mallavarapu A., Mitchison T. (1999) J. Cell Biol. 146, 1097–1106 [DOI] [PMC free article] [PubMed] [Google Scholar]
- 28.Ward W. W., Cody C. W., Hart R. C., Cormier M. J. (1980) Photochem. Photobiol. 31, 611–615 [Google Scholar]
- 29.Mogilner A., Rubinstein B. (2005) Biophys. J. 89, 782–795 [DOI] [PMC free article] [PubMed] [Google Scholar]
- 30.Homma K., Saito J., Ikebe R., Ikebe M. (2001) J. Biol. Chem. 276, 34348–34354 [DOI] [PubMed] [Google Scholar]
- 31.Pollard T. D., Blanchoin L., Mullins R. D. (2000) Annu. Rev. Biophys. Biomol. Struct. 29, 545–576 [DOI] [PubMed] [Google Scholar]
- 32.Pantaloni D., Le Clainche C., Carlier M. F. (2001) Science 292, 1502–1506 [DOI] [PubMed] [Google Scholar]
- 33.Jurado C., Haserick J. R., Lee J. (2005) Mol. Biol. Cell 16, 507–518 [DOI] [PMC free article] [PubMed] [Google Scholar]
Associated Data
This section collects any data citations, data availability statements, or supplementary materials included in this article.


