

Abstract
Model-based, three-dimensional reconstruction techniques depend on reliable starting models. We present an extension of the random-model method (RMM) that allows the ab initio generation of suitable starting models directly from un-averaged, experimental images of asymmetric or symmetric particles. Therefore, the asymmetric RMM can also be used to determine point-group symmetry. The procedure is facilitated by the use of a) variable angular step-sizes during iterative origin and orientation searches, b) high numbers of particle images, and c) highly defocused images. The method is inhibited by mixed-handedness orientation assignments and by particles with inconspicuous features. For symmetric particles, symmetric RMMs can overcome these deficiencies.
Keywords: Asymmetric reconstruction, Cryo-electron microscopy, Starting model, Model validation, Single-particle reconstruction, Symmetry determination
1. Introduction
In reconstructing three-dimensional (3D) structure from two-dimensional (2D) electron images of freestanding particles, model-based or projection-matching algorithms can effectively determine image origins (defined centers) and orientations (view angles) (Baker and Cheng, 1996; Crowther et al., 1994; Frank, 2006; Harauz and Ottensmeyer, 1984; Ludtke et al., 1999; Penczek et al., 1994; Schatz et al., 1995). In these techniques, a 3D structure (“model”) is projected into 2D images (projections) at orientations throughout the asymmetric unit. Each model projection is compared to each image in the experimental data set. The orientation used to produce the most similar projection becomes the particle orientation, and translational alignment of this projection gives the particle origin. A 3D reconstruction is then computed from the experimental images. This new structure is used as the model for another round of origin and orientation refinement. The cycle is repeated until no further improvement in resolution of the 3D reconstruction is observed.
Model-based processes rely on a starting model to initiate convergence to the correct 3D structure. If it leads to the correct structure, a starting model is deemed “suitable”. Commonly, a suitable model is a pre-existing, related 3D structure, resolved by cryogenic electron microscopy (cryo-EM) or X-ray crystallography (e.g. Bhella et al., 2004; Zhang et al., 2008). The absence of a related structure is a serious obstacle and usually requires that the initial model be computed ab initio—directly from the experimental images.
Several ab initio methods exist. Random conical tilt (Radermacher et al., 1987), orthogonal tilt (Leschziner and Nogales, 2006), and tomography (Walz et al., 1997) all require two or more views of the specimen taken at different tilt angles. Common lines (Castón et al., 1999; Thuman-Commike and Chiu, 1997), angular reconstitution (van Heel, 1987b), and simulated annealing (Elmlund et al., 2008; Liu et al., 2007; Ogura and Sato, 2006) do not require tilting of the specimen. Computer-generated shapes (Baker and Cheng, 1996; Ludtke et al., 2004), or reconstructions from one image of a particle (Cantele et al., 2003; Castón et al., 1999) have been used as starting models. Despite these advances, Taylor and Glaeser (2008) suggested that new tools are still needed to obtain starting models for unknown particles.
In the mid-1980s, van Heel (1984) and Harauz and van Heel (1985) proposed a “random model” strategy for ab initio 3D reconstruction. They suggested that an initial “random model” be created by first assigning random orientations to aligned, averaged 2D images (class averages) and then computing a 3D reconstruction. This model would be used to start iterative model-based, projection-matching searches for orientation and origin. After several refinement cycles, the correct structure could eventually emerge. The idea was abandoned in favor of other methods, but recently the strategy was used by other groups (Mullapudi et al., 2004; Ogura and Sato, 2006). The random method was proposed to work for non-averaged, experimental projection-images only if 1) the random orientation assignments were close to the correct values or 2) the structure exhibited high symmetry (Frank, 2006). Recently, Yan et al. (2007) and Liu et al. (2007) confirmed the prediction that the method would work for high symmetry objects by generating icosahedral starting models. Both groups suggested that the so-called “random-model method” (RMM) might work for particles with lower symmetries.
Using experimental cryo-EM images of ribosomes, we confirmed that the RMM can produce suitable starting models of asymmetric particles. We also produced suitable, symmetric starting models for dihedral and icosahedral data sets without imposing symmetry. Therefore, the RMM is also a tool for symmetry determination.
2. Methods
2.1. Particle images
We analyzed images of ribosomes, GroEL, and other particles that were prepared via standard cryo-EM procedures for other studies (Table S1). We applied a radial mask to particle images and set the background to the mean of intensities between the mask and the edge of the image (Bsoft; Heymann and Belnap, 2007) or the mask and the edge of a user-defined square that was several pixels larger than the mask (X3DPREPROCESS; Conway et al., 1993).
2.2. Random-model algorithm
We implemented the RMM as a six-step process (Fig. 1, see also supplemental section 2.2):
A random orientation was assigned to each imaged particle. The center of each image (i.e. the center of the image “box”) was used as the initial origin (Liu et al., 2007; Yan et al., 2007). A 3D “random model” was computed from the images.
The random model was projected at regular angular intervals throughout the asymmetric unit. The number and interval of the projections was determined by the angular step-size.
Each particle image was compared to the projections of the model for orientation and origin determination. We used a version of the model-based PFT algorithm (Baker and Cheng, 1996) modified to a) use both phase and amplitude information in selecting the best match of projections to each image, b) add a Cartesian real-space correlation coefficient (CC) and c) analyze particles that were asymmetric or had non-icosahedral point-group symmetry.
Particle images with the highest CCs were selected until 80% of the particles were included. These images were used to compute the new reconstruction.
The new 3D model was projected to begin a new cycle of origin and orientation determination. Generally, for each successive iteration, we used an angular step-size different from the previous iteration (Table 1).
We repeated steps 1-5 ten or more times. In each independent test, the same particle images were analyzed, but different random orientations were assigned and a new random model was computed for each test. The resulting starting models were compared visually and quantitatively.
We used the asymmetric RMM on all data sets (Table S1). No symmetry was imposed in either the origin, orientation search or 3D-reconstruction calculation. Two data sets were analyzed via symmetric RMMs; we used cyclic, dihedral, tetrahedral, octahedral, and icosahedral point-group symmetries (see suppl. section 2.2).
Fig. 1. Random-model method.

(1) A random orientation is assigned to every individual image. The center point of the image “box” is used as the initial origin for each image. A 3D reconstruction is then computed. (2) The 3D “random model” is projected at even angular steps throughout the asymmetric unit. (3) These projections are used to determine orientations and origins. (4) A figure-of-merit (e.g. correlation coefficient) measures the similarity of each matched projection and image. The value is used to determine the “best” rotational (orientation) and translational (origin) alignments in the set. Aligned particles are used to compute a new (intermediate) model. (5) The intermediate model serves as the input model for refinement of orientations and origins (step 3). Typically, steps 3-5 are repeated 40 to 100 times. The whole scheme (steps 1-5) is repeated independently 10 or more times. In each repetition, the same images are used, but a different random model is generated. (6) Resulting (starting) models are analyzed and compared both visually and quantitatively to determine suitability for further use.
Table 1.
Effect of angular step-size on the success rate of the asymmetric random-model method (with ribosome data set).*
| Angular step-size (°) | Success rate (%)d | Convergencee | ||
|---|---|---|---|---|
| Initiala | Finalb | Changec | ||
| 30 | 1 | −0.3 | 40 | ---- |
| 20 | 1 | −0.2 | 55 | ---- |
| 20 | 1 | −0.19f | 40g | 58 (±15) |
| 10 | 1 | −0.1 | 30 | 30 (±9) |
| 30 | 1 | −0.6 | 10 | ---- |
| 20 | 1 | −0.4 | 5 | 20 (±0) |
| 10 | 1 | −0.2 | 25 | 28 (±8) |
| 20 | < 1 | × 2/3 | 0g | ---- |
| 20 | 20 | 0 | 0 | ---- |
| 10 | 10 | 0 | 40 | 43 (±18) |
| 1 | 1 | 0 | 0 | ---- |
| 20,10h | 1 | −0.2 | 40 | ---- |
| 20,15h | 1 | −0.2 | 75 | 49 (±18) |
| 20,18h | 1 | −0.2 | 70 | ---- |
Classification of changes in angular step-size: slow-uniform decrease (rows 1-4), fast-uniform decrease (rows 5-8), constant (rows 9-11), and non-uniform (rows 12-14).
Angular step-size used in the first iteration.
Angular step-size lower limit.
For each successive iteration.
Percent success for 20 independent jobs, except as noted.
Iteration at which the correct structure appeared (average ± standard deviation), made by visual assessment of maps at iterations 10, 20, 30, …, 100. Only a few representative cases are shown.
The reason for this odd step-size is that in our initial RMM tests with model particle images we originally tried the RMM on model data and found that 100 iterations were sufficient to see if a suitable starting model would appear. After we decided to try varying the angular step-size, for our first attempts we decided to start at 20° and end at 1°, with 100 0.19° steps. This starting angle and step-size gave suitable starting models for the ribosome, GroEL, avian polyomavirus, and poliovirus-receptor data sets (Tables S1,S2).
10 independent jobs
The first number is the initial angular step-size for odd iterations; the second number is the initial angular step-size for even iterations.
2.3. Image processing
We used the Bsoft (Heymann and Belnap, 2007) and PFT3DR (Baker and Cheng, 1996; Bubeck et al., 2005; Heymann and Belnap, 2007) packages and X3DPREPROCESS (Conway et al., 1993) for image processing and reconstruction. Bsoft programs or X3DPREPROCESS were used for particle extraction, background subtraction, masking, and linear-gradient correction. CTF parameters were determined via bshow and images were corrected via bctf (Bsoft). PFT2 (PFT3DR) was used for orientation and origin determination. breconstruct (Bsoft) was used to compute 3D reconstructions. We developed a new Bsoft program, emgrand, to assign random orientations (Fig. 1, step 1) and two scripts to use PFT2 (pft2p) and breconstruct (breconstructp) on clustered computers. (Scripts and source code are available at http://bsoft.ws and http://people.chem.byu.edu/belnap/pft3dr.)
2.4. Validation of the starting models
We validated our starting models via visual inspection; principal component analysis (PCA); and assessments of resolution, CCs, and map variance. Maps generated from independent runs were compared to each other and to reference structures. A t-test, with unequal variance assumed, was applied to resolution, CC, and map-variance assessments.
Fourier shell correlation (FSC) (Saxton and Baumeister, 1982; van Heel, 1987a), differential phase-residual (DPR) (Frank et al., 1981), spectral signal-to-noise ratio (SSNR) (Unser et al., 1989) and reliability index R(A+B) (Winkelmann et al., 1991), were calculated in the last iteration by splitting selected particles into two subsets from which two maps were computed. Curves were calculated via bresolve (Bsoft). Resolution was estimated to be where the curve crossed the 0.5, 45°, 1 and 0.5 values, for FSC, DPR, SSNR and R(A+B), respectively.
CCs were obtained from the last PFT2 orientation and origin search (Fig. 1, step 3). For selected particles, we analyzed the mean and histogram of the CCs.
The standard deviation of the densities within each 3D map was calculated. We used a radius that encompassed the whole particle.
For PCA (Frank, 2006), we first aligned starting models from independent tests to a common origin, orientation, and handedness. (PCA was very sensitive to these three alignments.) The model with the highest resolution was the template. Models were aligned via the Bsoft program bfind or the alignment utility in UCSF Chimera (Goddard et al., 2007). We computed dissimilarity matrices by comparing aligned maps to each other via bmapdist (Bsoft). For the similarity functions, we tested two real-space criteria, −log CC and R-factor (least-squares measure), and two reciprocal-space criteria, FSC and DPR (0.5 and 45° cut-offs respectively). We used classical (metric) multi-dimensional scaling to display the similarities graphically via the cmdscale function in the R package (R Development Core Team, 2009) (http://www.Rproject.org).
3. Results and Discussion
We found that the model-based, projection-matching RMM, previously demonstrated only for icosahedral symmetry (Liu et al., 2007; Yan et al., 2007), can produce suitable starting models from images of asymmetric particles (Fig. 2, Table S1). The RMM is another tool in the ab initio starting-model repertoire and is designed to be relatively easy to implement and use. The technique also can be used to determine symmetry.
Fig. 2. Ribosome reconstruction by the asymmetric RMM.
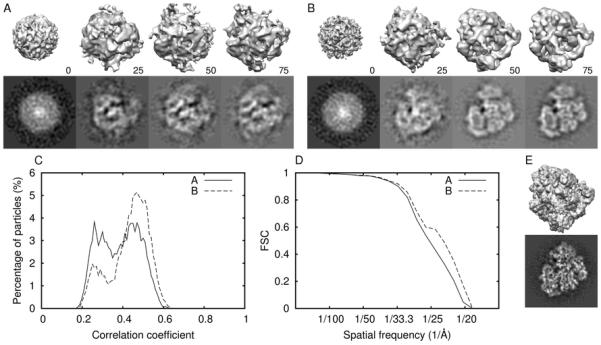
Panels A and B show, respectively, unsuitable and suitable starting models: top row, surface representation; bottom row, a central section. Numbers indicate the iteration number. Panel E shows the original published map (Valle et al., 2003a; Valle et al., 2003b) (EM Data Bank code 1055) at subnanometer resolution using the same data set: surface rendering, top; central section, bottom. Panels C and D display the CC histograms and the Fourier shell correlation plots (FSC), respectively, for the unsuitable (A) and the suitable maps (B).
3.1. Changes in angular step-size
Extending 3D-reconstruction algorithms from high symmetry to no symmetry usually only requires redefinition of the asymmetric unit and approximately n-fold or more particle images, but adapting the icosahedral RMM (Liu et al., 2007; Yan et al., 2007) to work with asymmetric particles proved to be non-trivial. Our attempts to simply use asymmetry, 60-fold more particle images, and methodology given by Yan et al. (2007) failed to compute suitable starting models with experimental cryo-EM images, though tests with model images (with and without noise) were successful (data not shown). After many tries using constant angular step-sizes—including adjustments to resolution range, radial range, and number of particle images—we discovered that changes in angular step-size allowed the asymmetric RMM to work for ribosome cryo-EM images (Table 1, Fig. 2). In only one case, discovered later, did a constant step-size result in suitable models (Table 1).
Because the angular step-size was critical for success with the asymmetric RMM, we tested several different changes in angular step-size among successive iterations (Table 1). Highest success occurred with the use of relatively large changes between consecutive iterations (non-uniform changes). Moderate success was observed if relatively small, constant changes were made between successive iterations (slow-uniform decreases) and if a constant step-size of 10° was used. Low success was observed if constant changes between consecutive iterations were moderately larger than the slow-uniform decreases (fast-uniform decreases). Use of a constant step-size of 1° and 20° gave no starting models matching the reference structure. Forty to 100 iterations were usually necessary to get suitable starting models. In general, more rapid declines in angular step-size gave lower success rates but did give suitable maps after fewer iterations.
Variations in angular step-size may allow particles to more easily escape local minima (wrong orientations or origins), especially if consecutive iteration cycles do not contain a subset of the same projections. For example, if an iteration with a 2° step-size is followed by an iteration at 1° steps, all projections used in the 2° set are also present in the 1° set. Few projections in the subsequent set will be identical if the second iteration has a 1.7° step-size. During RMM tests, the 3D structure evolves from a spherical-like model to correct or incorrect structures through a series of intermediate maps (e.g. Fig. 2A,B) that induce adjustment of origins and orientations to correct or incorrect values. Although random models look very similar (Fig. 2A,B), the stochastic orientation assignments (Fig. 1, step 1) produce small density differences that determine the subsequent evolution of the model. Despite repeated refinement cycles, unsuitable maps changed very little and showed at most only partial similarity to the correct structure. In our experience, these “local-minima structures” often corresponded to rotationally symmetric structures (e.g. Fig. S2 panel C1). These models generated nearly identical projections over the asymmetric unit, likely producing arbitrary orientation assignments, which resulted in near-identical (rotationally-symmetrized) structures.
3.2. Image defocus
Image defocus affects success rates of the asymmetric RMM. We grouped ribosome images by average defocus. Three sets of 8,000 ribosome images had average underfocus values of 1.7, 2.5, and 3.8 μm. The highest defocus set gave the highest rate of suitable starting models (70%). The two lower-defocus sets had success rates of 40%. A similar trend was observed previously (Yan et al., 2007).
3.3. Number of particles
For the ribosome data set and the asymmetric RMM, we obtained suitable starting models with as few as 500 particle images and as many as 76,000 (Table 2, see also section 3.5 and Suppl. Results & Discussion). To avoid bias because of defocus level, the average defocus of each set of images was the same. Each test used the same pattern of changes in angular step-size. We observed that the success rate increased as the number of images increased, from 20% with 500 images to 90% with 76,000 images.
Table 2.
Relationship of success rate to the number of particle images.*
| Number of Particle Images |
Success Rate (%) |
Iteration at Convergence§ |
|---|---|---|
| 500 | 20 | ---- |
| 1,000 | 20 | ---- |
| 3,000 | 40 | 80 (±23) |
| 10,000 | 40 | 58 (±15) |
| 76,000 | 90 | 57 (±23) |
Ribosome data set with 10 independent tests per entry. Angular step-size: initial 20°, each successive iteration changed the step-size by −0.19°. Average defocus, 2.9 μm underfocus.
Iteration at which the correct structure appeared (average ± standard deviation), made by visual assessment of maps at iterations 10, 20, 30, …, 100. The average number of iterations required for convergence to a suitable model declined substantially from 3,000 to 10,000 particle images, but declined insignificantly between 10,000 and 76,000 particles. Only a representative number of cases were assessed.
3.4. Symmetry determination via asymmetric RMM
The asymmetric RMM can determine the absolute symmetry of a particle. We obtained suitable starting models of known dihedral and icosahedral particles via the asymmetric RMM (Fig. S1; Tables S1,S2). GroEL particles have dihedral 7-fold symmetry (Ludtke et al., 2008). The asymmetric RMM showed a high success rate (70%) of GroEL models with correct shape and symmetry, even though the GroEL particles showed preferential orientations in the ice, as top and side views. Icosahedral symmetry, with correct triangulation number and pentameric subunits (capsomeres), was observed in 55% of the asymmetric RMM tests with images of avian polyomavirus.
3.5. Prominent structural features
Prominent structural features facilitate production of suitable models via the asymmetric RMM. Poliovirus is a relatively smooth, icosahedral virus (Belnap et al., 2000). Our asymmetric RMM tests with 5,016 poliovirus images were unsuccessful (Fig. S2; Tables S1,S3). Several modifications were tried without success, including changes in high- and low-pass Fourier filters, inner and outer radial boundaries, and angular step-size. When a similar number of images of a poliovirus-receptor complex were used, the asymmetric RMM generated suitable starting models (Fig. S1; Tables S1,S2). Yan et al. (2007) also reported lower success rates of the icosahedral RMM if particles lacked prominent features.
Random models are round and lack prominent features. Without constraints imposed by symmetry, random models appear unable to initiate successful orientation and origin searches if the particles are also round and relatively featureless, like some spherical viruses.
The success rate of the poliovirus-receptor tests—compared to the poliovirus tests—indicates that addition of antibodies or ligands facilitates reconstruction of refractory “featureless” particles, as was shown previously (Baker and Cheng, 1996). Additional particles may also facilitate reconstruction of such particles. When we used 44,000 poliovirus images, two of our 10 tests produced maps that appear suitable (Fig. S2).
3.6. Mixed handedness
Using images of octahedral polyomavirus, we were unable to produce suitable starting models with the asymmetric RMM because assigned orientations likely contained a mixture of handedness (Fig. S3). We flipped the handedness of our reference structure, aligned four adjacent pentameric subunits (capsomeres), and summed the two oppositely handed structures. The resulting map resembles models obtained via the asymmetric RMM. Therefore, if the RMM is unable to converge to a unique handedness, the resulting model will likely be unsuitable. (Similarly, if particle conformations vary significantly, the RMM is likely to produce an average structure.)
3.7. Ab initio reconstruction of refractory symmetric particles
Symmetric particles that were refractory to the asymmetric RMM were amenable to symmetric RMMs (Figs. S2,S3; Table S3; Suppl. Results and Discussion). Using the same images and experimental parameters employed in the asymmetric RMM experiment, we computed maps via symmetric RMMs imposing symmetries both compatible and incompatible with the native symmetry. Suitable starting models were computed via some, but not all, symmetries compatible with the native particle symmetry. Native particle symmetry gave the highest success rates. As expected, the use of incompatible symmetries produced unsuitable maps. The fact that symmetric RMMs worked for refractory icosahedral poliovirus and octahedral polyomavirus images indicates that symmetry constraints can overcome, at least some, deficiencies in the RMM.
3.8. Validation of starting models
Our experience is that any single validation criterion can be misleading, and the most reliable way to validate RMM results is to use multiple criteria. We validated starting models by comparing them visually and by FSC to reference structures. Our visual judgments were confirmed by FSC (Table S2). Next, without reference maps, we used FSC, map variance, CC, and principal component analysis (PCA) to corroborate the previous validations.
Visualization is a reliable way to identify well-defined, consistent structures that may be suitable and smeared structures likely to be unsuitable. In general, if the maps represent the correct structure, particle features should have the highest definition and be more consistent (from map to map) than incorrect structures. Smeared features likely indicate unsuitable starting models. For example, in the octahedral polyomavirus tests (Fig. S3), we saw smeared or distorted capsomeres for all symmetries except dihedral 4-fold, tetrahedral, octahedral, and icosahedral. In our tests, some unsuitable starting models resembled the correct structure in surface renderings and by quantitative assessment, but not in density section (e.g. Fig. 2, Table S2). Therefore, inspection of 3D maps rendered in two or more distinct ways, e.g. surface renderings and density sections, is advisable.
Consistent, well-resolved features do not necessarily imply correct structures. When the icosahedral RMM was used on the octahedral polyomavirus data set, the resulting maps were consistent with each other, but incorrect (Fig. S3). The incorrect features also appeared to be clearly defined. Highly detailed structures, correct or incorrect, typically correlate with high variance values (Cantele et al., 2003). In our variance tests, one data set showed higher variance of suitable maps than unsuitable maps (Table S2); two data sets showed the opposite (Table S2). Although p-values of the latter t-tests were greater than 0.01 and the p-value of the former test was significantly less than 0.01, map variance seems unreliable for validation.
PCA is a useful quantitative validation tool. We used four similarity functions combined with PCA to quantitatively compare all resulting maps to each other (section 2.4). The four criteria usually clustered all or most suitable maps together and apart from unsuitable maps (ribosome data in Fig. 3, other data not shown). In most cases, unsuitable maps did not cluster, except in the poliovirus and octahedral polyomavirus asymmetric RMM tests. However, if starting models show smeared features, as we observed in unsuitable poliovirus and octahedral polyomavirus maps (Figs. S2,S3), then clustering should be disregarded.
Fig. 3. Principal component analysis of ribosome starting models obtained by the asymmetric RMM.

Each plot graphically displays similarities among the resulting starting models (scales are unit-less). To get the data for each plot, each starting model was compared to every other model in the set using DPR, FSC, R-factor, or CC, as labeled. Marks indicate relative relationships among all maps. The closer the crosses, the more similar the models as assessed by the respective function and vice versa. Suitable models are encircled. Map “E” is unsuitable even though it clustered with suitable maps in the CC plot.
Our FSC and CC tests were reliable and consistent with our visual and FSC assessments if the t-test (between the suitable- and unsuitable-map populations) gave a p-value < 0.01 (Table S2). Otherwise, differences between the two populations were insignificant.
Plots of CCs and resolution curves are helpful for validation. CC values displayed as histograms showed patterns consistent with average CC values (Figs. 2C,S1C; Table S2). Starting models that deviated significantly from the correct structure had poorer FSC-resolution curves (Fig. S1D middle). If incorrect models resembled the correct structure, the FSC curves were similar (Figs. 2D,S1D top). DPR, SSNR, and reliability index R(A+B) gave similar assessments to the FSC results (data not shown). For reconstructions computed from the same set of particle images, a higher-resolution 3D map is more likely to be correct than a lower-resolution one; however, acceptable resolution does not guarantee map correctness. Maps judged unsuitable often had resolution values similar to those of suitable maps (Table S2). Erratic fluctuations of resolution curves likely signify unsuitable maps (Yan et al., 2007).
For unknown structures analyzed via the asymmetric RMM, we propose the following steps to help identify a suitable starting model:
Compute multiple starting models.
Visualize maps. Look for consistent, well-defined structures and smeared features.
Use PCA to compare each map to every other map. Inspect the dissimilarity matrix or display distances graphically (via a distance-function algorithm, e.g. Fig. 3).
Check resolution and CC (from orientation, origin finding) results to see if they are consistent with visual inspection and PCA. Apply a t-test to compare populations of “suitable” and “unsuitable” maps.
Start model-based searches with the starting model. As suggested (Yan et al., 2007), if a starting model only yields a low-resolution structure despite intensive computations, then the starting model is likely unsuitable.
If the particle is thought to have symmetry, try the RMM with the suspected symmetry or a lower compatible symmetry. If correct, definition of structural features should improve.
Our experiments with known structures suggest RMM results are authentic representations of particle structure if multiple maps a) correlate well visually and quantitatively, b) do not have smeared features, and c) differ statistically from unsuitable maps (e.g. PCA or p-value < 0.01). Also, a suitable RMM starting model should produce an improved structure in subsequent refinement.
As recently noted (Taylor and Glaeser, 2008), validation of 3D reconstructions is an important problem in cryo-EM studies. Current methods rely on comparisons that can be misleading—comparison of map projections to particle images or comparison of two separately computed 3D maps to each other—because incorrect structures may also correlate well. In the absence of atomic-resolution information (which is generally thought to validate structures) or complementary data, 3D maps of unknown structures are usually accepted if multiple tests or techniques produce the same result. Therefore, validation of RMM starting models must also rely on convergence of multiple tests or subsequent production of a near atomic-resolution structure. For an unknown structure, the RMM could be used with other ab initio methods to test convergence of multiple de novo experiments. In addition, if images were taken of the same field-of-view at two tilt angles, the tilt-verification method (Rosenthal and Henderson, 2003) could be used.
Supplementary Material
Acknowledgments
Four example maps were deposited in the EM Data Bank (Table S1). We thank J. Sengupta and J. Frank for the E. coli 70S ribosome images; P. Shen, D. Enderlein, and R. Johne for the avian polyomavirus images; and T. Baker, G. Wang, M. Cahoon, and R. Swenson for the octahedral mouse polyomavirus VP1 images. The GroEL dataset was provided by the National Resource for Automated Molecular Microscopy (NIH P41 RR-17573). Surface-rendered images of 3D maps were made via UCSF Chimera (Goddard et al., 2007) (NIH P41 RR-01081). We thank P. Shen, B. Heymann, G. Cardone, M. van Heel, M. Schatz, and members of the T. Baker laboratory for helpful discussions. We thank P. Shen, our peer reviewers, and editor for critiquing of the manuscript. We relied heavily on the Fulton Supercomputing Laboratory (Brigham Young University) for computational work. The project was supported by BYU institutional funds and by grant R21AI081221 from the National Institute of Allergy and Infectious Diseases. The content of this article is solely the responsibility of the authors and does not necessarily represent official views of NIAID or the National Institutes of Health.
Abbreviations
- nD
n-dimensional
- CC
correlation coefficient
- cryo-EM
cryogenic electron microscopy
- CTF
contrast transfer function
- DPR
differential phase residual
- FSC
Fourier shell correlation
- PCA
principal component analysis
- RMM
random-model method
- Sn
supplementary table or figure
- SSNR
spectral signal-to-noise ratio
Footnotes
Publisher's Disclaimer: This is a PDF file of an unedited manuscript that has been accepted for publication. As a service to our customers we are providing this early version of the manuscript. The manuscript will undergo copyediting, typesetting, and review of the resulting proof before it is published in its final citable form. Please note that during the production process errors may be discovered which could affect the content, and all legal disclaimers that apply to the journal pertain.
References
- Baker TS, Cheng RH. A model-based approach for determining orientations of biological macromolecules imaged by cryo-electron microscopy. J. Struct. Biol. 1996;116:120–130. doi: 10.1006/jsbi.1996.0020. [DOI] [PubMed] [Google Scholar]
- Belnap DM, Filman DJ, Trus BL, Cheng N, Booy FP, Conway JF, Curry S, Hiremath CN, Tsang SK, Steven AC, Hogle JM. Molecular tectonic model of virus structural transitions: the putative cell entry states of poliovirus. J. Virol. 2000;74:1342–1354. doi: 10.1128/jvi.74.3.1342-1354.2000. [DOI] [PMC free article] [PubMed] [Google Scholar]
- Bhella D, Goodfellow IG, Roversi P, Pettigrew D, Chaudhry Y, Evans DJ, Lea SM. The structure of echovirus type 12 bound to a two-domain fragment of its cellular attachment protein decay-accelerating factor (CD 55) J. Biol. Chem. 2004;279:8325–8332. doi: 10.1074/jbc.M311334200. [DOI] [PubMed] [Google Scholar]
- Bubeck D, Filman DJ, Cheng N, Steven AC, Hogle JM, Belnap DM. The structure of the poliovirus 135S cell entry intermediate at 10-Angstrom resolution reveals the location of an externalized polypeptide that binds to membranes. J. Virol. 2005;79:7745–7755. doi: 10.1128/JVI.79.12.7745-7755.2005. [DOI] [PMC free article] [PubMed] [Google Scholar]
- Cantele F, Lanzavecchia S, Bellon PL. The variance of icosahedral virus models is a key indicator in the structure determination: a model-free reconstruction of viruses, suitable for refractory particles. J. Struct. Biol. 2003;141:84–92. doi: 10.1016/s1047-8477(02)00577-4. [DOI] [PubMed] [Google Scholar]
- Castón JR, Belnap DM, Steven AC, Trus BL. A strategy for determining the orientations of refractory particles for reconstruction from cryo-electron micrographs with particular reference to round, smooth-surfaced, icosahedral viruses. J. Struct. Biol. 1999;125:209–215. doi: 10.1006/jsbi.1999.4085. [DOI] [PubMed] [Google Scholar]
- Conway JF, Trus BL, Booy FP, Newcomb WW, Brown JC, Steven AC. The Effects of Radiation Damage on the Structure of Frozen Hydrated HSV-1 Capsids. J. Struct. Biol. 1993;111:222–233. doi: 10.1006/jsbi.1993.1052. [DOI] [PubMed] [Google Scholar]
- Crowther RA, Kiselev NA, Böttcher B, Berriman JA, Borisova GP, Ose V, Pumpens P. Three-Dimensional Structure of Hepatitis B Virus Core Particles Determined by Electron Cryomicroscopy. Cell. 1994;77:943–950. doi: 10.1016/0092-8674(94)90142-2. [DOI] [PubMed] [Google Scholar]
- Elmlund H, Lundqvist J, Al-Karadaghi S, Hansson M, Hebert H, Lindahl M. A new cryo-EM single-particle ab initio reconstruction method visualize secondary structure elements in an ATP-fueled AAA+ motor. J. Mol. Biol. 2008;375:934–947. doi: 10.1016/j.jmb.2007.11.028. [DOI] [PubMed] [Google Scholar]
- Frank J. Three-dimensional electron microscopy of macromolecular assemblies: visualization of biological molecules in their native state. Oxford Univ. Press; New York: 2006. [Google Scholar]
- Frank J, Verschoor A, Boublik M. Computer averaging of electron micrographs of 40 S ribosomal subunits. Science. 1981;214:1353–1355. doi: 10.1126/science.7313694. [DOI] [PubMed] [Google Scholar]
- Goddard TD, Huang CC, Ferrin TE. Visualizing density maps with UCSF Chimera. J. Struct. Biol. 2007;157:281–287. doi: 10.1016/j.jsb.2006.06.010. [DOI] [PubMed] [Google Scholar]
- Harauz G, Ottensmeyer FP. Direct three-dimensional reconstruction for macromolecular complexes from electron micrographs. Ultramicroscopy. 1984;12:309–319. [Google Scholar]
- Harauz G, van Heel M. Direct 3D reconstruction from projections with initially unknown angles. In: Gelsema ES, Kanal LN, editors. Pattern Recognition in Practice II. Elsevier, North-Holland Publishing; Amsterdam: 1985. pp. 279–288. [Google Scholar]
- Heymann JB, Belnap DM. Bsoft: image processing and molecular modeling for electron microscopy. J. Struct. Biol. 2007;157:3–18. doi: 10.1016/j.jsb.2006.06.006. [DOI] [PubMed] [Google Scholar]
- Leschziner AE, Nogales E. The orthogonal tilt reconstruction method: an approach to generating single-class volumes with no missing cone for ab initio reconstruction of asymmetric particles. J. Struct. Biol. 2006;153:284–299. doi: 10.1016/j.jsb.2005.10.012. [DOI] [PubMed] [Google Scholar]
- Liu X, Jiang W, Jakana J, Chiu W. Averaging tens to hundreds of icosahedral particle images to resolve protein secondary structure elements using a Multi-path Simulated Annealing optimization algorithm. J. Struct. Biol. 2007;160:11–27. doi: 10.1016/j.jsb.2007.06.009. [DOI] [PMC free article] [PubMed] [Google Scholar]
- Ludtke SJ, Baldwin PR, Chiu W. EMAN: semiautomated software for high-resolution single-particle reconstructions. J. Struct. Biol. 1999;128:82–97. doi: 10.1006/jsbi.1999.4174. [DOI] [PubMed] [Google Scholar]
- Ludtke SJ, Chen D-H, Song J-L, Chuang DT, Chiu W. Seeing GroEL at 6 Å resolution by single particle electron cryomicroscopy. Structure. 2004;12:1129–1136. doi: 10.1016/j.str.2004.05.006. [DOI] [PubMed] [Google Scholar]
- Ludtke SJ, Baker ML, Chen D-H, Song J-L, Chuang DT, Chiu W. De novo backbone trace of GroEL from single particle electron cryomicroscopy. Structure. 2008;16:441–448. doi: 10.1016/j.str.2008.02.007. [DOI] [PubMed] [Google Scholar]
- Mullapudi S, Pullan L, Bishop OT, Khalil H, Stoops JK, Beckmann R, Kloetzel PM, Kruger E, Penczek PA. Rearrangement of the 16S precursor subunits is essential for the formation of the active 20S proteasome. Biophys. J. 2004;87:4098–4105. doi: 10.1529/biophysj.104.051144. [DOI] [PMC free article] [PubMed] [Google Scholar]
- Ogura T, Sato C. A fully automatic 3D reconstruction method using simulated annealing enables accurate posterioric angular assignment of protein projections. J. Struct. Biol. 2006;156:371–386. doi: 10.1016/j.jsb.2006.05.016. [DOI] [PubMed] [Google Scholar]
- Penczek PA, Grassucci RA, Frank J. The ribosome at improved resolution: new techniques for merging and orientation refinement in 3D cryo-electron microscopy of biological particles. Ultramicroscopy. 1994;53:251–270. doi: 10.1016/0304-3991(94)90038-8. [DOI] [PubMed] [Google Scholar]
- R Development Core Team . R: A Language and Environment for Statistical Computing R Foundation for Statistical Computing. Vienna: 2009. [Google Scholar]
- Radermacher M, Wagenknecht T, Verschoor A, Frank J. Three-dimensional reconstruction from a single-exposure, random conical tilt series applied to the 50S ribosomal subunit of Escherichia coli. J. Microsc. 1987;146:113–136. doi: 10.1111/j.1365-2818.1987.tb01333.x. [DOI] [PubMed] [Google Scholar]
- Rosenthal PB, Henderson R. Optimal determination of particle orientation, absolute hand, and contrast loss in single-particle electron cryomicroscopy. J. Mol. Biol. 2003;333:721–745. doi: 10.1016/j.jmb.2003.07.013. [DOI] [PubMed] [Google Scholar]
- Saxton WO, Baumeister W. The correlation averaging of a regularly arranged bacterial cell envelope protein. J. Microsc. 1982;127:127–138. doi: 10.1111/j.1365-2818.1982.tb00405.x. [DOI] [PubMed] [Google Scholar]
- Schatz M, Orlova EV, Dube P, Jäger J, van Heel M. Structure of Lumbricus terrestris hemoglobin at 30 A resolution determined using angular reconstitution. J. Struct. Biol. 1995;114:28–40. doi: 10.1006/jsbi.1995.1003. [DOI] [PubMed] [Google Scholar]
- Taylor KA, Glaeser RM. Retrospective on the early development of cryoelectron microscopy of macromolecules and a prospective on opportunities for the future. J. Struct. Biol. 2008;163:214–223. doi: 10.1016/j.jsb.2008.06.004. [DOI] [PMC free article] [PubMed] [Google Scholar]
- Thuman-Commike PA, Chiu W. Improved common-line-based icosahedral particle image orientation estimation algorithms. Ultramicroscopy. 1997;68:231–255. doi: 10.1016/s0304-3991(97)00033-8. [DOI] [PubMed] [Google Scholar]
- Unser M, Trus BL, Frank J, Steven AC. The spectral signal-to-noise ratio resolution criterion: computational efficiency and statistical precision. Ultramicroscopy. 1989;30:429–434. doi: 10.1016/0304-3991(89)90074-0. [DOI] [PubMed] [Google Scholar]
- Valle M, Zavialov A, Sengupta J, Rawat U, Ehrenberg M, Frank J. Locking and unlocking of ribosomal motions. Cell. 2003a;114:123–134. doi: 10.1016/s0092-8674(03)00476-8. [DOI] [PubMed] [Google Scholar]
- Valle M, Zavialov A, Li W, Stagg SM, Sengupta J, Nielsen RC, Nissen P, Harvey SC, Ehrenberg M, Frank J. Incorporation of aminoacyl-tRNA into the ribosome as seen by cryo-electron microscopy. Nat. Struct. Biol. 2003b;10:899–906, 1074. doi: 10.1038/nsb1003. [DOI] [PubMed] [Google Scholar]
- van Heel M. Three-dimensional reconstruction from projections with unknown angular relationships. In: Csanády Á, et al., editors. Programme Committee of the Eighth European Congress on Electron Microscopy; Eighth European Congress on Electron Microscopy; Budapest, Hungary. 1984. pp. 1347–1348. [Google Scholar]
- van Heel M. Similarity measures between images. Ultramicroscopy. 1987a;21:95–99. [Google Scholar]
- van Heel M. Angular reconstitution: a posteriori assignment of projection directions for 3D reconstruction. Ultramicroscopy. 1987b;21:111–123. doi: 10.1016/0304-3991(87)90078-7. [DOI] [PubMed] [Google Scholar]
- Walz J, Tamura T, Tamura N, Grimm R, Baumeister W, Koster AJ. Tricorn protease exists as an icosahedral supermolecule in vivo. Mol. Cell. 1997;1:59–65. doi: 10.1016/s1097-2765(00)80007-6. [DOI] [PubMed] [Google Scholar]
- Winkelmann DA, Baker TS, Rayment I. Three-dimensional structure of myosin subfragment-1 from electron microscopy of sectioned crystals. J. Cell Biol. 1991;114:701–713. doi: 10.1083/jcb.114.4.701. [DOI] [PMC free article] [PubMed] [Google Scholar]
- Yan X, Dryden KA, Tang J, Baker TS. Ab initio random model method facilitates 3D reconstruction of icosahedral particles. J. Struct. Biol. 2007;157:211–225. doi: 10.1016/j.jsb.2006.07.013. [DOI] [PMC free article] [PubMed] [Google Scholar]
- Zhang X, Settembre E, Xu C, Dormitzer PR, Bellamy R, Harrison SC, Grigorieff N. Near-atomic resolution using electron cryomicroscopy and single-particle reconstruction. Proc. Natl. Acad. Sci. USA. 2008;105:1867–1872. doi: 10.1073/pnas.0711623105. [DOI] [PMC free article] [PubMed] [Google Scholar]
Associated Data
This section collects any data citations, data availability statements, or supplementary materials included in this article.