Abstract
An off-line in vivo neurochemical monitoring approach was developed based on collecting nanoliter microdialysate fractions as an array of “plugs” segmented by immiscible oil in a piece of Teflon tubing. The dialysis probe was integrated with the plug generator in a polydimethlysiloxane microfluidic device that could be mounted on the subject. The microfluidic device also allowed derivatization reagents to be added to the plugs for fluorescence detection of analytes. Using the device, 2 nL fractions corresponding to 1–20 ms sampling times depending upon dialysis flow rate, were collected. Because axial dispersion was prevented between them, each plug acted as a discrete sample collection vial and temporal resolution was not lost by mixing or diffusion during transport. In vitro tests of the system revealed that the temporal resolution of the system was as good as 2 s and was limited by mass transport effects within the dialysis probe. After collection of dialysate fractions, they were pumped into a glass microfluidic chip that automatically analyzed the plugs by capillary electrophoresis with laser-induced fluorescence at 50 s intervals. By using a relatively low flow rate during transfer to the chip, the temporal resolution of the samples could be preserved despite the relatively slow analysis time. The system was used to detect rapid dynamics in neuroactive amino acids evoked by microinjecting the glutamate uptake inhibitor L-trans-pyrrolidine-2,4-dicarboxylic acid (PDC) or K+ into the striatum of anesthetized rats. The resulted showed increases in neurotransmitter efflux that reached a peak in 20 s for PDC and 13 s for K+.
Keywords: Microdialysis, Segmented flow, Off-line analysis, Temporal resolution, Electrophoresis, Amino acids
1. Introduction
The study of brain function and pathologies requires the accurate characterization of neurochemical concentration dynamics in response to external and pharmacological stimuli. Coupling microdialysis sampling to analytical methods such as high performance liquid chromatography (HPLC) or capillary electrophoresis (CE) is an effective approach for such measurements (Weiss et al., 2000; Watson et al., 2006). In developing a microdialysis method, achieving high temporal resolution is an important goal because neurotransmitter release events are observed on the order of seconds (Rossell et al., 2003; Venton et al., 2006). These rapid changes in neurotransmitter release may also be behaviorally relevant and involved in disease states. An inherent limit to temporal resolution is Taylor dispersion, i.e. broadening of concentration zones due to flow and diffusion, during transfer from the dialysis probe to the analytical system (on-line methods) or fraction collector (off-line methods). The effects of Taylor dispersion can be minimized by decreasing the length and volume of connection tubing and by using high sampling flow rates (1–2 μL/min). Under such conditions, a temporal resolution of 3–30 s has been realized with on-line analysis systems (Lada et al., 1997; Tucci et al., 1997; Boyd et al., 2000; Huynh et al., 2004; Bhatia et al., 2006). However, with on-line analysis the analytical method must be rapid enough to maintain this high temporal resolution.
Another approach to reduce dispersion is to segment the dialysate stream into discrete aqueous sample plugs carried by an immiscible oil phase (Wang et al., 2008). This approach allows sufficient temporal resolution that is nearly independent of flow rate and completely independent of tubing inner diameter (i.d.) or length. For example, this approach was used to obtain 35 s temporal resolution with a 60 cm length of connector tubing and sampling flow rate of 200–300 nL/min (Roman et al., 2008; Wang et al., 2009) with on-line analytical systems. Segmented flow provides other practical advantages such as compatibility with lower flow rates for higher recovery, larger bore tubing to prevent excessive back-pressure and leaking of the dialysis probe, and longer tubing for coupling to freely-moving subjects or other situations where the analytical system cannot be placed close to the subject.
A potential advantage of collecting dialysate fractions as plugs is storage and off-line analysis. Although on-line monitoring has significant advantages such as real-time data output, on-line analysis is not always possible or desirable. For example, analysis time could become the limiting factor of temporal resolution if using relatively slow assays operated in on-line mode, whereas with off-line measurements, fractions can be collected at the temporal resolution required and then analyzed at a slower pace. Off-line analysis is also desirable if the analytical instrument cannot be located near the subject as might occur in collaborative projects or clinical applications (Deeba et al., 2008).
Off-line analysis of dialysate collected at high temporal resolution is challenging because of the difficulty of manipulating the nanoliter samples generated. One approach to this problem has been to collect dialysate and naphthalene-2,3-dicarboxaldehyde/cyanide (NDA/CN) mixtures directly to a commercial CE sample vial and to analyzed the samples by commercial CE instrument (Parrot et al., 2004). In that study, a 940 nL mixture was collected over 20 s, corresponding to 667 nL dialysate at 2 μL/min sampling flow rate. Another approach is to collect dialysate (collected at 1 μL/min) and fluorescein isothiocyanate (FITC) derivatization solutions together in a piece of collection capillary (Rossell et al., 2003). The capillary is then cut into 4 mm pieces and the liquid sample in each segment, corresponding to only 30 nL volume and 1 s sampling time, is transferred to a test tube for incubation and CE analysis. These two approaches significantly decreased collection volume from minutes to seconds. However, using these methods requires relatively high flow rates to reduce collection time, improve temporal resolution, and maintain sufficient volume for manipulation. In the second report, a multiple post-collection manipulations added complexity to the operation.
In this paper, we report a new fraction collection method that used nanoliter plugs segmented by an immiscible oil as “collection vials”. Dialysate and NDA/CN derivatization solutions were compartmentalized into 2 nL plugs carried by perfluorinated oil after microdialysis sampling. The plug train was collected into a capillary, which was then removed and pumped at a slower flow rate into a microfluidic chip for CE analysis (Wang et al., 2009). Using this method, unprecedentedly low fraction volume was collected without using high sampling flow rate. Temporal resolution was only limited by the sampling probe and was as good as 2 s. The collection and manipulation of these sample fractions were automated and required little manual intervention.
2. Materials and methods
2.1 Chemical reagents
All chemicals were purchased from Sigma-Aldrich (St. Louis, MO) except the salts for artificial cerebral spinal fluid (aCSF) were from Fisher Scientific (Chicago, IL) and NDA was from Invitrogen (Eugene, OR). All aqueous solutions were prepared with water purified and deionized to 18 MΩ resistivity using a Series 1090 E-pure system (Barnstead Thermolyne Cooperation, Dubuque, IA). Amino acid standards were dissolved in aCSF. Octadecyletrichlorosilane (OTCS) was stored in a desiccator and was opened in dry N2 atmosphere in an Aldrich Atmosbag (St. Louis, MO).
2.2 Microdialysis probes
Side-by-side microdialysis probes with 18 kDa molecular weight cut-off membranes made from regenerated cellulose hollow-fibers were made in-house as described elsewhere (Parsons and Justice, 1992). Probes had 200 μm diameter, 2 mm sampling length and 40 μm i.d. × 100 μm outer diameter (o.d.) fused silica capillaries for inlet and outlet tubing.
2.3 PDMS chip fabrication
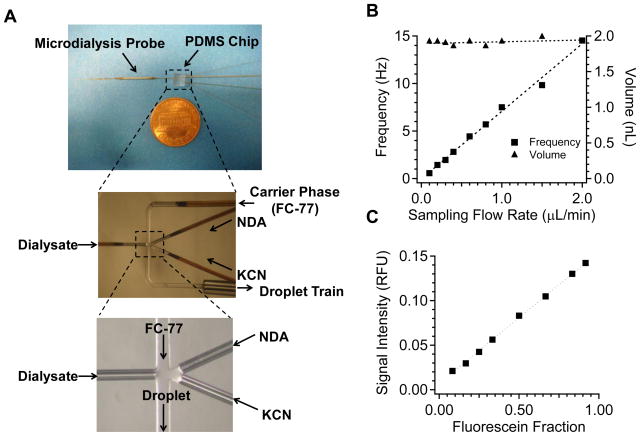
A microfluidic chip made from polydimethylsiloxane (PDMS) that was integrated with the microdialysis probe was used to segment the dialysate stream and add reagents to the plugs. A brightfield picture of the PDMS chip layout is shown in Figure 2A. Channels were molded using standard photolithography described elsewhere (McDonald and Whitesides, 2002; Wang et al., 2008). Channels for the delivery of dialysate, NDA and KCN/EDTA solutions were 75 μm wide × 70 μm deep while the segmented flow channel for oil delivery and plug flow was 100 μm wide × 70 μm deep. 40 μm i.d. × 100 μm o.d. fused silica capillaries (Polymicro, Phoenix, AZ) were inserted into three aqueous delivery channels. The dialysate delivery capillary was the outlet of microdialysis probe and was about 4 cm from the probe tip. Capillary for oil delivery was 40 μm i.d. × 100 μm o.d. Plugs were collected into high-purity perfluoroalkoxy (HPFA) tubing (Upchurch Scientific, Oak Harbor, OR) with 150 μm i.d. × 360 μm o.d. The whole chip with capillaries inserted was encased in PDMS, leaving the other ends of capillaries and tubing extending outward for connections.
Figure 2.
(A) Picture of dialysis/plug sampler placed next to a one-cent coin, brightfield picture of the PDMS chip network and enlarged picture of plug generation region. (B) Relationship between plug volume, frequency and sampling flow rate. Sum flow rate of derivatization reagents equaled to sampling flow rate and water fraction of segmented flow was 0.29. (C) Dependence of detected fluorescence signal on fluorescein fraction in plugs. Oil flow rate was 3 μL/min and total water flow rate was 0.6 μL/min. Fluorescein fraction is defined as the ratio between flow rate of fluorescein to total water flow rate.
2.4 Glass chip fabrication
Detailed descriptions of the design and fabrication of glass microfluidic chip for sampling and electrophoretic separation of segmented dialysate flow has been reported (Wang et al., 2009). For the chips used in the current work, the following changes were made: the size of segmented flow channel was 120 μm wide × 50 μm deep; the size of water extraction channel was 110 μm wide × 50 μm deep; the size of extraction bridge was 300 μm wide × 300 μm long × 6 μm deep. Consequently, the volume between extraction bridge and sampling channel was 1.8 nL. Selective patterning of channel surface with OTCS to create an hydrophobic segmented flow channel was also the same as that described before (Zhao et al., 2001; Roman et al., 2008; Wang et al., 2009).
2.5 Temporal resolution and relative recovery
aCSF (145 mM NaCl, 2.68 mM KCl, 1.01 mM MgSO4, 1.22 mM CaCl2, 1.55 mM Na2HPO4, 0.45 Mm NaH2PO4, pH 7.4) was pumped through a microdialysis probe at a flow rate of 0.1 to 2 μL/min into the PDMS chip. NDA and cyanide solutions (De Montigny et al., 1987; Wang et al., 2009) were pumped through separate channels, each at half the flow rate of microdialysate (see Figure 2A). Carrier phase (FC-77) flow rate was chosen to maintain a fixed water fraction (the ratio between aqueous flow rate and total flow rate) of 0.29. Plugs formed at the junction were transferred to a piece of 40 cm HPFA tubing connected to segmented flow channel. Total fluorescence signal of plugs were detected at the end of the tubing.
To determine temporal resolution, the microdialysis probe was dipped into 10 μM standard solution of amino acid mixture (γ-aminobutyric acid (GABA), taurine (Tau), serine (Ser), glycine (Gly), glutamic acid (Glu), and aspartic acid (Asp)) constantly stirred at 37 °C. Sampling flow rate was varied between 0.1 – 2 μL/min. At each flow rate, step change of concentration from 10 μM to 50 μM was made at the surface of the probe by rapidly spiking the solution with amino acids. During this time, the total fluorescence intensity of plugs were recorded downstream. Temporal resolution was defined as the time between 10% to 90% of the maximal signal.
2.6 PDMS chip characterization
Pure water was pumped into three aqueous delivery capillaries of the PDMS chip. Visual inspection and monitoring of plugs flowing in HPFA tubing was carried out with a Nikon inverted microscope (Eclipse TS100, Melville, NY). Photographs and videos were taken through the microscope using a digital camera (FinePix F30, Fujifilm). Photographs of plug were analyzed with ImageJ (NIH) to obtain the volume. Videos of plugs were analyzed with VirtualDub (Avery Lee) for frequency information.
To test the ability of the PDMS chip to form plugs with different analyte concentration, 0.2 mM fluorescein was pumped into dialysate delivery capillary while water was pumped into the other two water capillaries. Carrier phase flow rate was kept at 3 μL/min while total aqueous flow rate was kept at 1.2 μL/min. Relative flow rate of fluorescein and water was varied and the fluorescence signal intensity of resulted plug was recorded. Fluorescein fraction was defined as the ratio of fluorescein flow rate and total water flow rate.
2.7 In vitro experiments
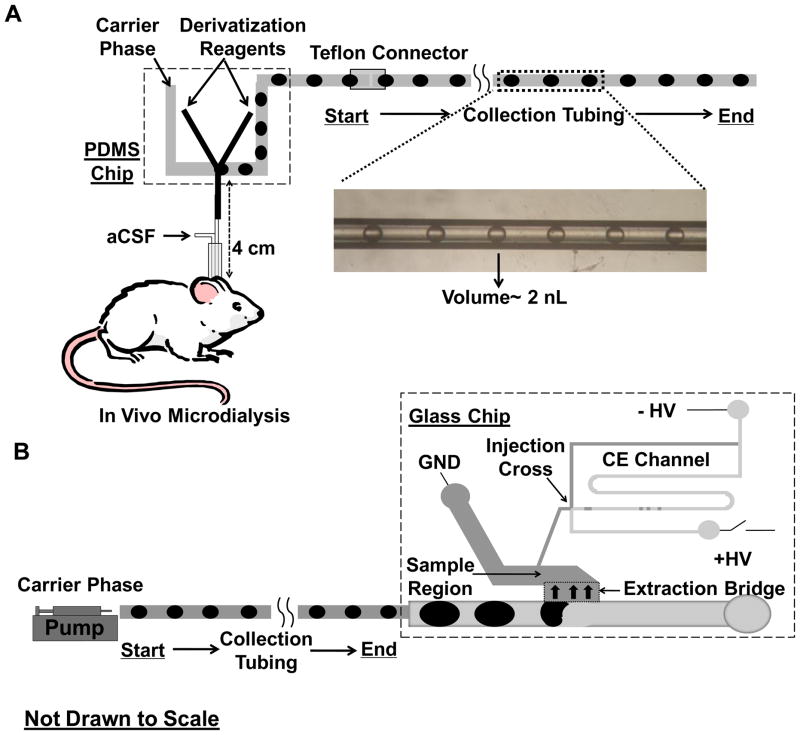
Sample plugs formed on PDMS chip were transferred to 10 cm HPFA tubing permanently connected to it (fixed tubing). Another 30 cm HPFA tubing (removable tubing) was connected to the fixed tubing through a Teflon adaptor. After completing the collection of plugs, the removable tubing was then disconnected from the PDMS chip body. NDA reaction in each plug was allowed to complete by leaving the tubing in darkness for 5 min before analysis. When plugs were to be analyzed by CE, the removable tubing was connected to another syringe filled with FC-77 and the plug train was pumped onto the glass chip at a slower flow rate (100 or 200 nL/min) (Figure 1). In the electrophoresis chip, segmented flow enters a large channel that has been rendered hydrophobic by selective derivatization. At the extraction bridge (indicated by region with heavy arrows in Figure 1B), the channels are hydrophilic and shallower. As a result, the aqueous samples are extracted across this bridge while the oil continues to flow past. The aqueous channel fills the sample region of the chip (indicated by light gray) and is ultimately injected onto the electrophoresis channel at the injection cross. (Further details of operation are given in our earlier publication (Wang et al., 2009).) Implementation of CE separation, LIF detection with home-built epi-confocal microscope and data processing were the same as reported in the earlier work (Wang et al., 2009). Separation buffer consisted of 10 mM sodium borate at pH 10. When only total fluorescence signal was to be collected for off-line analysis, detection was made at the end of the removable tubing.
Figure 1.
Operational scheme of off-line CE-based in vivo sensing using plugs as fraction collector. (A) In vivo dialysate was derivatized on-line and stored in collection tubing. (B) Plugs in the tubing was pumped to microfluidic chip for electrophoretic analysis. The inset shows a brightfield picture of sample plugs stored in 150 μm i.d. HPFA tubing. The volume of each plug is about 2 nL.
2.8 Surgery and in vivo experiments
In vivo microdialysis experiments were performed on male Sprague-Dawley rats (Harlan, Indianapolis, IN) weighing 250–350 g. Rats were anesthetized with intraperitoneal (i.p.) injections of ketamine (65 mg/kg) and domitor (0.5 mg/kg) and mounted on a stereotaxic apparatus (Kopf Instruments, Tujunga, CA). Rats were maintained under anesthesia for the entire experiment by giving i.p. injections of ketamine (32.5 mg/kg) and domitor (0.25 mg/kg) as needed. The probe was inserted into the striatum at following coordinates: +1.0 mm anterior of bregma, +2.0 mm lateral of midline, and 5.5 mm deep from dura (Paxinos and Watson, 1998). After inserting the microdialysis probe, the system was equilibrated by perfusing aCSF at 0.3 μL/min flow rate through the probe for 1 h before beginning measurements.
200 nL of either 10 mM PDC or high potassium aCSF (145 mM KCl, 2.63 mM NaCl, the other components were the same as aCSF) was delivered into the brain through a capillary (4.5 cm long × 20 μm i.d. × 90 μm o.d. fused silica capillary) by applying 78 psi air pressure for 4 s using an electrically actuated solenoid (Picospritzer, General Valve, Fairfield, NJ). A piece of 0.8 cm 100 μm i.d. × 200 μm o.d. capillary was sleeved over the outside of the 90 μm o.d. capillary near the tip. Both the microinjector assembly and the microdialysis probe were then threaded through a piece of 502 μm i.d. × 718 μm o.d. stainless steel tubing (Small parts, Inc., Miramar, FL) and were glued together. The tip of the microinjector was placed laterally 150 μm and vertically 1 mm above the tip of the probe. The microinjector was prefilled with drug solution before the microinjector-microdialysis probe assembly was inserted into the brain.
3. Results
3.1 Plug generation with PDMS chip
A PDMS chip integrated with the microdialysis probe was used to create plugs of dialysate mixed with fluorogenic reagent (Figure 1A and 2A). This design is a modification of previous reports, where a T-geometry channel with multiple water inlets was used for creating plugs of mixed composition (Song and Ismagilov, 2003; Wang et al., 2008). The new chip is designed to be compatible with sampling from freely moving animal by arranging the dialysate inlet and fluorogenic reagent inlets on opposite sides of the segmented flow channel (Figure 2A). In this way, when the microdialysis probe is placed downward into the brain of the animal the other fluid access tubing is brought out from the top and therefore does not interfere with animal movement. The system also uses fused silica capillaries inserted along PDMS channels as conduits for solution delivery. We found that this method, as opposed to using the PDMS channel itself, was necessary to form plugs of uniform composition resulting from the merging of dialysate and derivatization reagents streams on different sides. This effect was attributed to the need for hydrophilic nature of the fused silica tubing.
To characterize plug generation with the device, sampling flow rate was varied from 0.1 to 2 μL/min. Reagent and oil flow rate were varied concurrently to keep a constant water fraction of 0.29. Figure 2B shows the relationship of plug volume and time interval with dialysate flow rate. Because the water fraction was kept constant, the plug volume, which was around 2 nL, did not change with flow rate, while plug frequency increased with increasing flow rate, as expected. We also examined the ability of this device to achieve stable on chip dilution by varying the relative flow rate of fluorescein (from dialysate inlet) and water diluent (from reagent inlets). Figure 2C shows that average signal intensity of plugs measured at the end of the collection tubing formed a linear relationship with the calculated fluorescein fraction in those plugs. These results demonstrate reliable plug generation and dilution with this design.
3.2 Temporal resolution and relative recovery with integrated microdialysis-PDMS chip
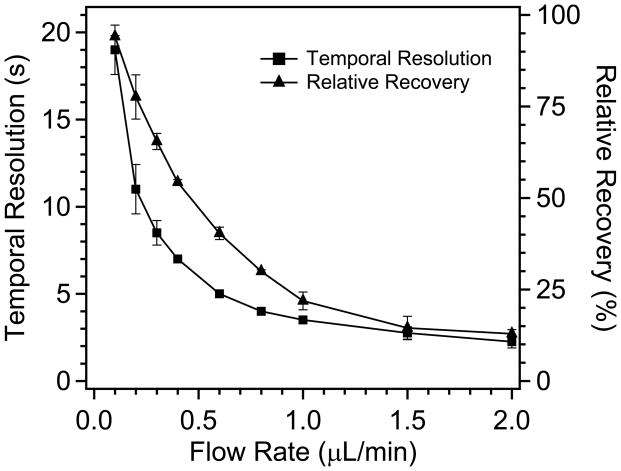
In continuous flow microdialysis sampling, a trade-off is made between temporal resolution and relative recovery as a function of flow rate i.e., higher flow rate results in better temporal resolution, but lower concentration in the sampling stream (Lada et al., 1997). The dialysis/plug sampler had a similar trade-off as illustrated by Figure 3. However, because any dispersion in the connection tubing between the probe and the analysis platform was eliminated with segmented flow (Wang et al., 2008), the temporal resolution obtained with this device depended only upon dispersion associated with the probe itself. Thus, the temporal resolution only varied from 2 to 19 s over the whole range of flow rates (0.1–1 μL/min) tested. These results demonstrate that good temporal resolution can be achieved while achieving high recovery.
Figure 3.
Dependence of temporal resolution and relative recovery on sampling flow rate using 2 mm microdialysis probes. Water fraction was 0.29. n=3 and error bars indicate standard deviation.
3.3 Off-line analysis using plug as fraction collector
Next, we evaluated the potential for off-line analysis of the collected fractions. In previous work, we have shown on-line analysis of plugs, i.e. plugs were directly pumped into an electrophoresis chip for analysis. However, the on-line method is limited because it requires that the analysis time be as fast as the temporal resolution. With the dialysis/plug sampler, we have obtained up to 2 s temporal resolution in sampling, placing great constraints on the analytical system for on-line analysis. Off-line analysis would allow slower assays to be used with the rapidly collected fractions. The small size of the plugs (~2 nL) means that off-line analysis cannot be performed by collecting fractions into separate tubes for analysis. Therefore, the fractions were stored in a collection capillary, then pumped into an analytical chip at a flow rate low enough to allow full analysis without affecting temporal resolution.
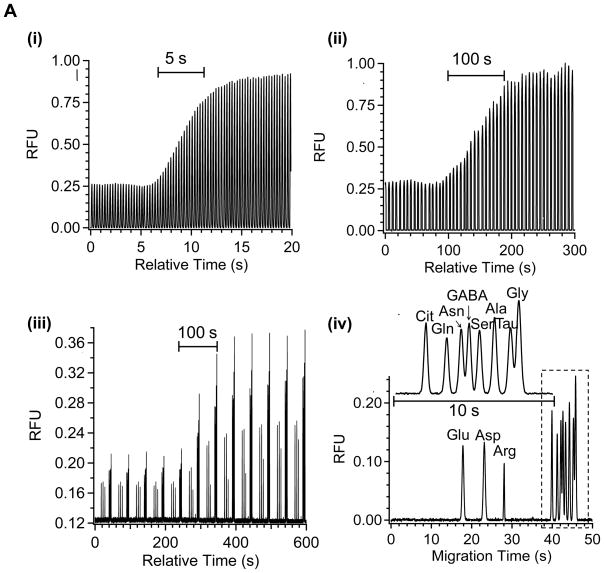
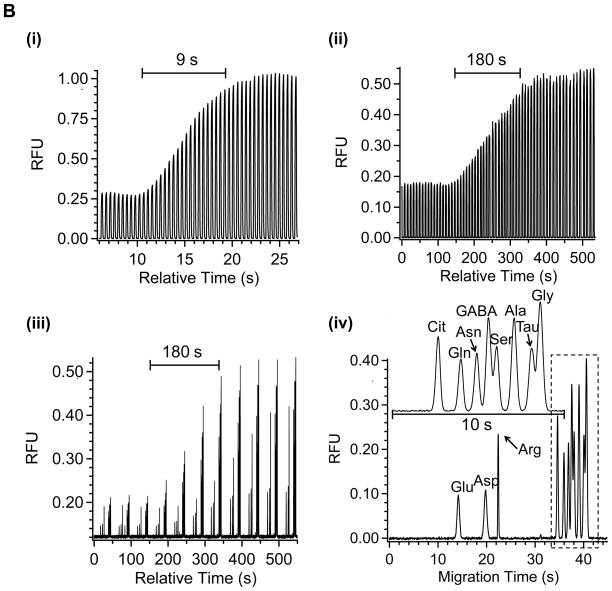
Figure 4 illustrates the effectiveness of off-line analysis at generating more time for analysis with the plug system while preserving temporal resolution. Figure 4A shows that a step change in concentration of amino acids at a microdialysis probe with on-line monitoring of the plug fluorescence yields a 5 s temporal resolution recorded over 20 plugs when using a total flow rate of 4.2 μL/min (dialysis, derivatization, and oil flow rates of 0.6 μL/min, 0.6 μL/min, and 3 μL/min respectively). By pumping the collected plug train off-line at an ~20-fold lower flow rate (0.2 μL/min), the time available for analysis of the 5 s concentration change is increased 20-fold to 100 s (Figure 4Aii). This plug train was then pumped at 0.2 μL/min into a CE chip while acquiring electropherograms at 50 s intervals. As shown in Figure 4Aiii, the resulting step change in concentration is recorded over 2 electrophoregrams or 100 s (corresponding to 5 s of actual collection time), showing preservation of temporal resolution with this type of analysis. In each electrophoresis run, 11 amino acid standards including GABA, taurine, serine, glycine, glutamate, and aspartate were resolved in 50 s (Figure 4Aiv). Thus, it was possible to monitor all of these compounds at 5 s temporal resolution even though each electropherogram required 50 s.
Figure 4.
Validation of off-line operation with in vitro analysis. Step change of amino acid solution concentration was made from 10 to 50 μM. Sampling flow rate and offline pumping flow rate was 0.6 μL/min, 0.2 μL/min in (A) and 0.3 μL/min, 0.1 μL/min in (B). Water fraction was kept at 0.29 in all cases. (i) On-line total fluorescence signal of plugs detected at the end of collection tubing; (ii) Fluorescence signal of plugs detected at the end of collection tubing when plug train was pumped off-line; (iii) Consecutive electropherograms collected when the plug train was off-line pumped to CE chip at the same flow rate as in (ii); (iv) Individual electropherogram showing the resolution of 11 amino acids. Insets show enlarged electropherograms in the dotted box. Separation buffer was 10 mM sodium borate at pH 10. Separation distance was 11 cm and electric field was 650 V/cm.
Figure 4B illustrates a similar example for collecting samples at 0.3 μL/min (total flow rate of 2.1 μL/min), yielding 9 s temporal resolution, and then performing off-line analysis at 0.1 μL/min to yield 180 s for analysis. These examples show the versatility for manipulating plugs and analysis time with off-line analysis by changing pumping flow rates.
3.4 High temporal resolution off-line monitoring neurotransmitters in vivo
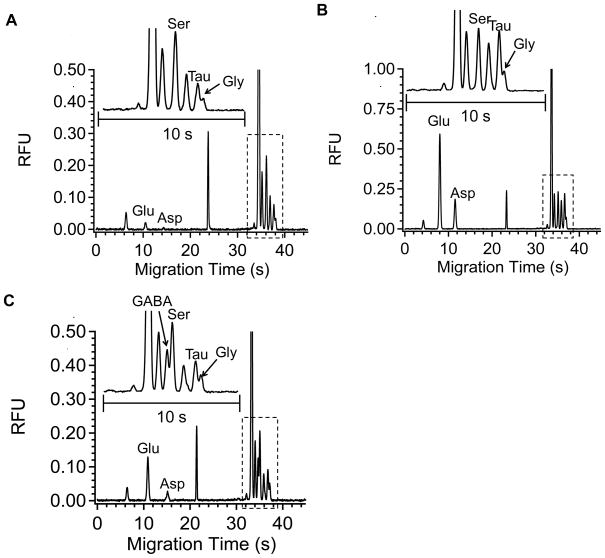
To demonstrate the validity of the method in vivo, it was applied to monitoring amino acids in anaesthetized rats during microinjection of pharmacological agents. Microinjections were chosen over reverse microdialysis for drug delivery because dispersion at the moving front of the drug before it reached microdialysis probe resulted in relatively slow concentration changes in the brain. 200 nL of either 10 mM PDC, a glutamate uptake inhibitor, or 145 mM K+ were microinjected over 4 s into the brain while sampling at 0.3 μL/min. The resulting collected fractions were then pumped into the electrophoresis chip at 0.2 μL/min. Figure 5 shows in vivo electropherograms of dialysate collected at basal (A) and levels obtained during PDC (B) or K+ (C) stimulations. Basal dialysate concentrations of serine, taurine, glycine, glutamate, and aspartate were found to be 27.6 ± 1.8, 9.9 ± 1.0, 5.1 ± 0.5, 2.9 ± 0.1, 0.3 ± 0.1 μM (mean ± SEM, n = 8), respectively, which were in good agreement with previous reports (Butcher et al., 1987; Anderson and DiMicco, 1992; Lada and Kennedy, 1996) when accounting for the differences in recovery at different flow rates. GABA was not quantified due to its low basal level and incomplete resolution from serine. Optimization of electrophoresis buffer and the use of more sensitive detectection methods will be necessary to monitor GABA reliably.
Figure 5.
In vivo electropherograms collected from the striatum of anesthetized rats at (A) basal level; (B) elevated level during PDC stimulation; (C) elevated level during K+ stimulation. Insets show enlarged electropherograms in the dotted box. Separation conditions were the same as in Figure 4.
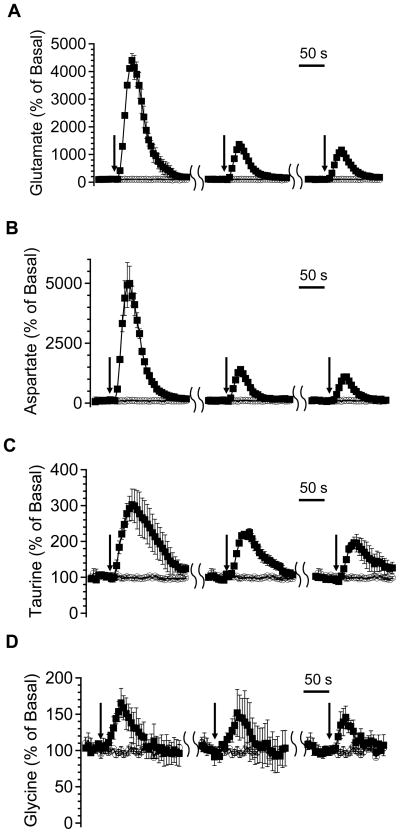
Figure 6 shows response of glutamate (A), aspartate (B), taurine (C), and glycine (D) upon PDC microinjection. The first injection produced the highest percentage of increase, which was 4320 ± 250% in glutamate, 5000 ± 720% in aspartate, 300 ± 40% in taurine, and 170 ± 20% in glycine (mean ± SEM, n = 3), while the second and third injections produced an attenuated response. Average increase in the second stimulation was 1370 ± 60% in glutamate, 1400 ± 80% in aspartate, 230 ± 20% in taurine, 150 ± 30% in glycine and in the third stimulation was 1160 ± 40% in glutamate, 1100 ± 100% in aspartate, 200 ± 30% in taurine, 150 ± 20% in glycine. For all amino acids, it took ~20 s to reach peak concentrations.
Figure 6.
The effect of microinjecting 200 nL 10 mM PDC on selected amino acids in the striatum of anesthetized rats (n = 3) as a function of injection number and relative time. Injections were made 30 min apart. Data are expressed as percentage of basal level (mean ± SEM) for glutamate (A), aspartate (B), taurine (C), and glycine (D). Each solid square represents a peak height value of corresponding amino acid in one electrophoresis run. Traces in empty circle are from control experiments when only aCSF was injected. Black arrows indicate the start of microinjection.
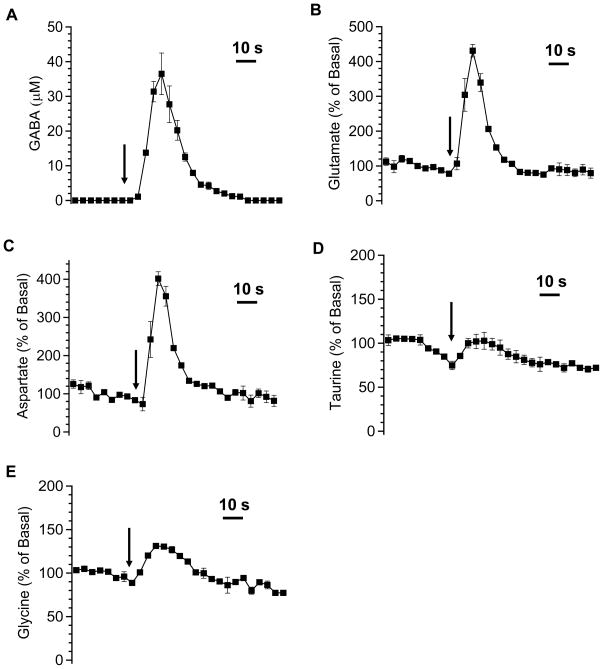
Figure 7 shows the response of GABA (A), glutamate (B), and aspartate (C) upon 145 mM K+ stimulation. Elevated GABA level could be observed in vivo and on average reached a maximum of 37 ± 6 μM (mean ± SEM, n=3) in the dialysate. Glutamate and aspartate increased to 430 ± 20 and 400 ± 40% (mean ± SEM, n=3) of basal level, respectively. The rise time for K+ response was faster compared that of PDC at about 9–12 s.
Figure 7.
The effect of microinjecting 200 nL 145 mM potassium on selected amino acids. GABA response (A) is expressed as concentration (μM) (mean ± SEM, n=3) in the dialysate and its baseline value is treated as zero. Responses of glutamate (B), aspartate (C), taurine (D), and glycine (E) are expressed as percentage of basal. The other conditions were the same as in Figure 6.
4. Discussion
4.1 Methodology
Improving temporal resolution of microdialysis sampling with off-line analysis creates multiple challenges. As the temporal resolution is increased, the volume of fractions decreases and the number of fractions that must be analyzed increases. Thus, efficient methods of manipulating low volume samples are necessary to achieve temporal resolution better than 10 s. This paper describes the use of segmented flow to collect dialysate fractions as plugs that are stored in a length of tubing for subsequent off-line analysis. This approach is an easy way to precisely and reproducibly collect and manipulate sample fractions down to 2 nL which is impractical with conventional methods using sample vials. Furthermore, this method is compatible with low sampling flow rate, which is important because low flow rates improve relative recovery and sensitivity.
The best temporal resolution possible by this method is ~ 2 s (Figure 3). By generating plugs at the immediate exit of the dialysis probe, the temporal resolution is independent of the tubing length used after the probe. Instead, temporal resolution is only determined by the sampling flow rate and the volume of the probe, which reflects true microdialysis temporal resolution with little effect of the post-sampling section (e.g. transportation and analysis system). We previously reported a limit of 15 s in temporal resolution with segmented flow microdialysis (Wang et al., 2008). However, the current work pushed this limit to 2 s because the dead volume between the sampling tip and the flow segmentation point was decreased with the newly designed dialysis/plug sampler. It is likely that the 2 s limit is determined by the mass transportation of analytes across the dialysis membrane, which is found to be the limiting factor at high sampling flow rate (Stenken et al., 1993). Further improvement of temporal resolution beyond 2 s would require the use of smaller, membrane-less probes with lower dead volume.
The use of segmented flow also means that the length of collector tubing can be varied to collect fractions for an arbitrary period. In the current work, we used 30 cm removable tubing because it was enough to collect fractions for 4 min (at 0.3 μL/min sampling flow), which was the time required for the microinjection experiments. However, the length of the collection tubing can be increased on demand, as long as its induced back pressure is tolerable for the dialysis membrane. This feature makes it more suitable for long term monitoring than the method of collecting sample in a capillary and then cutting the resulting capillary into short sections to create fractions (Rossell et al., 2003). In that method, the capillary had to be kept short (16 cm long) to prevent excessive dispersion during collection. As a result, time for collecting sample was limited (40 s collection time).
The current method uses reagent addition as the fractions were collected like other reports for off-line fraction collection (Rossell et al., 2003). This is important in this case because it facilitates reagent addition to the small fractions that are collected. On-line reagent addition is not likely to be necessary however as methods for adding reagents to pre-formed plugs have been reported (Li et al., 2007). The fractions collected were analyzed immediately after the derivatization reaction was complete (~5 min); therefore, the stability of samples over time was not investigated. Preliminary results from our laboratory suggest that longer term storage of plugs is feasible; however, further study is required to identify robust conditions.
The method was coupled off-line to electrophoretic analysis. Although electrophoresis can provide rapid separations, which has been used to advantage in on-line analysis (Lada et al., 1997; Zhou et al., 1999; Bowser and Kennedy, 2001; Huynh et al., 2004; Smith et al., 2004), resolving multiple compounds often requires times longer than the 2–19 s temporal resolution achieved by segmented flow fraction collection. Thus, off-line analysis is necessary to preserve the high temporal resolution represented in the collected fractions. Although off-line analysis allows preservation of high temporal resolution, it is still desirable to use a relatively fast assay because of the time required to analyze the many fractions collected. The electrophoresis chip was designed to be compatible with this challenge. We determined the size of the channels so that dead volume between extraction bridge and sampling channel was only 1.8 nL. As this volume was smaller than average plug volume (~2.0 nL), the incoming plug content would sweep the previous one away from the sampling point, which introduced little extra mixing at this de-segmentation region and preserved temporal resolution stored in plug train. This plug extraction design, which was described in detail in our earlier publication (Wang et al., 2009), is not limited to coupling to CE. It can also act as a preceding step before analytical techniques such as capillary liquid chromatography and electrospray ionization mass spectrometry, which expands the number of available analysis methods for segmented sample flow to as many as those for continuous flow.
4.2 In vivo experiments
The in vivo experiments (Figure 5–7) demonstrate the potential utility of this method for amino acid measurements with high temporal resolution. PDC is a glutamate uptake inhibitor that is expected to increase excitatory amino acid efflux in the brain. Such changes were recorded with glutamate and aspartate as in Figure 6A and 6B. The percentage of increase of glutamate, which is around 4500%, is comparable to the reported value with similar microinjection procedure (Parrot et al., 2004), but is significantly higher than our previously obtained value using reverse microdialysis, which is around 200% (Wang et al., 2009). We speculate that this difference come from different concentrations of PDC that are generated in the vicinity of the probe as well as the different methods for drug delivery. Levels of taurine and glycine were also observed to increase (Figure 6C and 6D). The increase in taurine and glycine suggests a positive interaction between excitatory amino acids and inhibitory amino acids when the concentration of glutamate and aspartate are sufficiently elevated as previously studied (Segovia et al., 1997; Del Arco and Mora, 1999). The time for neurotransmitters to reach peak level was around 20 s for most of the injections, which was larger than the 9 s temporal resolution of the sampling and analysis system. In agreement with the argument that glutamate evokes the release of taurine, we observed that the increase in taurine was delayed by ~ 9 s relative to the increase in glutamate. These results illustrate how the method can be used to study interactions of neuroactive compounds in vivo.
We also examined microinjection of 145 mM K+ solution because this has previously been reported to yield even faster concentration changes in the brain (Day et al., 2006). A substantial effect was seen with GABA, which became detectable after stimulation (Figure 5C). The average rise time for neurotransmitters was 9–12 s. This time range approaches the temporal resolution limit of the system under the flow condition used. Potassium evoked glutamate release recorded using a microelectrode (Nickell et al., 2005; Day et al., 2006) has been shown to reach a peak value in only 1–3 s and last for 10–20 s before returning to baseline. Therefore, we speculate that the slower response we observed is due to the limitation imposed by the microdialysis sampling probe. Nevertheless, these results highlight how a dialysis system can approach the temporal performance of a microelectrode while offering a different complement of components to be measured. For example, our measurements reveal high K+ microinjection evokes a much larger increase in GABA than Glu or Asp. Interestingly, Tau is not elevated by this injection. Infusion of K+ through a microdialysis probe has been reported to elevate Tau (Semba et al., 1995; Lada and Kennedy, 1996). With higher temporal resolution, we have found that this increase is slower than the changes in Glu, Asp, and GABA (data not shown). These results suggest that the brief microinjection of K+ does not provide sufficient depolarization to evoke release of Tau. We can also conclude that the increased efflux of Glu evoked by the microinjection of K+ is insufficient to increase efflux of Tau, which is supported by the fact that Tau is significantly elevated during PDC injection when concurrent Glu increase is around 4000%, 10 times higher than that induced by K+ injection. These results hint at a different mechanism of release for Tau than Glu, Asp, and GABA.
Although the current work used anesthetized rats, this method should be applicable to freely moving animals. We are presently engineering the plug generator chip for robust mounting on freely moving rats. The combination of freely-moving animals and the proposed off-line analysis method will enable us to correlate neurochemical dynamics to behavioral changes on a second to second timescale.
5. Conclusion
In this report, we have developed and validated an off-line CE analysis method using nanoliter plugs as sample fraction collector to monitor multiple neurotransmitters in vivo. With off-line approach, temporal resolution is determined by sampling condition and is not limited by separation speed. Information with up to 2 s temporal resolution can be stored with 2 nL fraction volume.
Acknowledgments
We thank Maura Perry, Neil Hershey and Qiang Li for their help with animal experiments. This work was supported by NIH grants R37 EB003320 and P41 EB002030-120002 (R.T.K.) and Pfizer Graduate Fellowship in Analytical Chemistry.
Footnotes
Publisher's Disclaimer: This is a PDF file of an unedited manuscript that has been accepted for publication. As a service to our customers we are providing this early version of the manuscript. The manuscript will undergo copyediting, typesetting, and review of the resulting proof before it is published in its final citable form. Please note that during the production process errors may be discovered which could affect the content, and all legal disclaimers that apply to the journal pertain.
References
- Anderson JJ, DiMicco JA. The use of microdialysis for studying the regional effects of pharmacological manipulation on extracellular levels of amino acids - some methodological aspects. Life Sci. 1992;51:623–30. doi: 10.1016/0024-3205(92)90232-e. [DOI] [PubMed] [Google Scholar]
- Bhatia R, Hashemi P, Razzaq A, Parkin MC, Hopwood SE, Boutelle MG, Strong AJ. Application of rapid-sampling, online microdialysis to the monitoring of brain metabolism during aneurysm surgery. Neurosurgery. 2006:58. doi: 10.1227/01.NEU.0000208963.42378.83. ONS-313-ONS-21 10.1227/01.NEU.0000208963.42378.83. [DOI] [PubMed] [Google Scholar]
- Bowser MT, Kennedy RT. In vivo monitoring of amine neurotransmitters using microdialysis with on-line capillary electrophoresis. Electrophoresis. 2001;22:3668–76. doi: 10.1002/1522-2683(200109)22:17<3668::AID-ELPS3668>3.0.CO;2-M. [DOI] [PubMed] [Google Scholar]
- Boyd BW, Witowski SR, Kennedy RT. Trace-level amino acid analysis by capillary liquid chromatography and application to in vivo microdialysis sampling with 10-s temporal resolution. Anal Chem. 2000;72:865–71. doi: 10.1021/ac990872n. [DOI] [PubMed] [Google Scholar]
- Butcher SP, Sandberg M, Hagberg H, Hamberger A. Cellular origins of endogenous amino acids released into the extracellular fluid of the rat striatum during severe insulin-induced hypoglycemia. J Neurochem. 1987;48:722–8. doi: 10.1111/j.1471-4159.1987.tb05576.x. [DOI] [PubMed] [Google Scholar]
- Day BK, Pomerleau F, Burmeister JJ, Huettl P, Gerhardt GA. Microelectrode array studies of basal and potassium-evoked release of l-glutamate in the anesthetized rat brain. J Neurochem. 2006:1626–35. doi: 10.1111/j.1471-4159.2006.03673.x. [DOI] [PubMed] [Google Scholar]
- De Montigny P, Stobaugh JF, Givens RS, Carlson RG, Srinivasachar K, Sternson LA, Higuchi T. Naphthalene-2,3-dicarboxyaldehyde/cyanide ion: A rationally designed fluorogenic reagent for primary amines. Anal Chem. 1987;59:1096–101. [Google Scholar]
- Deeba S, Corcoles E, Hanna B, Pareskevas P, Aziz O, Boutelle M, Darzi A. Use of rapid sampling microdialysis for intraoperative monitoring of bowel ischemia. Dis Colon Rectum. 2008;51:1408–13. doi: 10.1007/s10350-008-9375-4. [DOI] [PubMed] [Google Scholar]
- Del Arco A, Mora F. Effects of endogenous glutamate on extracellular concentrations of gaba, dopamine, and dopamine metabolites in the prefrontal cortex of the freely moving rat: Involvement of nmda and ampa/ka receptors. Neurochem Res. 1999;24:1027–35. doi: 10.1023/a:1021056826829. [DOI] [PubMed] [Google Scholar]
- Huynh BH, Fogarty BA, Lunte SM, Martin RS. On-line coupling of microdialysis sampling with microchip-based capillary electrophoresis. Anal Chem. 2004;76:6440–7. doi: 10.1021/ac049365i. [DOI] [PubMed] [Google Scholar]
- Lada MW, Kennedy RT. Quantitative in vivo monitoring of primary amines in rat caudate nucleus using microdialysis coupled by a flow-gated interface to capillary electrophoresis with laser-induced fluorescence detection. Anal Chem. 1996;68:2790–7. doi: 10.1021/ac960178x. [DOI] [PubMed] [Google Scholar]
- Lada MW, Vickroy TW, Kennedy RT. High temporal resolution monitoring of glutamate and aspartate in vivo using microdialysis on-line with capillary electrophoresis with laser-induced fluorescence detection. Anal Chem. 1997;69:4560–5. doi: 10.1021/ac970518u. [DOI] [PubMed] [Google Scholar]
- Li L, Boedicker JQ, Ismagilov RF. Using a multijunction microfluidic device to inject substrate into an array of preformed plugs without cross-contamination: Comparing theory and experiments. Anal Chem. 2007;79:2756–61. doi: 10.1021/ac062179n. [DOI] [PMC free article] [PubMed] [Google Scholar]
- McDonald JC, Whitesides GM. Poly(dimethylsiloxane) as a material for fabricating microfluidic devices. Acc Chem Res. 2002;35:491–9. doi: 10.1021/ar010110q. [DOI] [PubMed] [Google Scholar]
- Nickell J, Pomerleau F, Allen J, Gerhardt GA. Age-related changes in the dynamics of potassium-evoked l-glutamate release in the striatum of fischer 344 rats. J Neural Transm. 2005;112:87–96. doi: 10.1007/s00702-004-0151-x. [DOI] [PubMed] [Google Scholar]
- Parrot S, Sauvinet V, Riban V, Depaulis A, Renaud B, Denoroy L. High temporal resolution for in vivo monitoring of neurotransmitters in awake epileptic rats using brain microdialysis and capillary electrophoresis with laser-induced fluorescence detection. J Neurosci Methods. 2004;140:29–38. doi: 10.1016/j.jneumeth.2004.03.025. [DOI] [PubMed] [Google Scholar]
- Parsons LH, Justice JB. Extracellular concentration and in vivo recovery of dopamine in the nucleus accumbens using microdialysis. J Neurochem. 1992;58:212–8. doi: 10.1111/j.1471-4159.1992.tb09298.x. [DOI] [PubMed] [Google Scholar]
- Paxinos G, Watson C. The rat brain in stereotaxic coordinates. Academic Press; 1998. [DOI] [PubMed] [Google Scholar]
- Roman GT, Wang M, Shultz KN, Jennings C, Kennedy RT. Sampling and electrophoretic analysis of segmented flow streams using virtual walls in a microfluidic device. Anal Chem. 2008;80:8231–8. doi: 10.1021/ac801317t. [DOI] [PMC free article] [PubMed] [Google Scholar]
- Rossell S, Gonzalez LE, Hernandez L. One-second time resolution brain microdialysis in fully awake rats: Protocol for the collection, separation and sorting of nanoliter dialysate volumes. J Chromatogr B. 2003;784:385–93. doi: 10.1016/s1570-0232(02)00826-7. [DOI] [PubMed] [Google Scholar]
- Segovia G, Del Arco A, Mora F. Endogenous glutamate increases extracellular concentrations of dopamine, gaba, and taurine through nmda and ampa/kainate receptors in striatum of the freely moving rat: A microdialysis study. J Neurochem. 1997;69:1476–83. doi: 10.1046/j.1471-4159.1997.69041476.x. [DOI] [PubMed] [Google Scholar]
- Semba J, Kito S, Toru M. Characterization of extracellular amino acids in striatum of freely moving rats by in vivo microdialysis. J Neural Transm Gen Set. 1995;100:39–52. doi: 10.1007/BF01276864. [DOI] [PubMed] [Google Scholar]
- Smith A, Watson CJ, Frantz KJ, Eppler B, Kennedy RT, Peris J. Differential increase in taurine levels by low-dose ethanol in the dorsal and ventral striatum revealed by microdialysis with on-line capillary electrophoresis. Alcoholism: Clin Exp Res. 2004:1028–38. doi: 10.1097/01.alc.0000131979.78003.34. [DOI] [PubMed] [Google Scholar]
- Song H, Ismagilov RF. Millisecond kinetics on a microfluidic chip using nanoliters of reagents. J Am Chem Soc. 2003;125:14613–9. doi: 10.1021/ja0354566. [DOI] [PMC free article] [PubMed] [Google Scholar]
- Stenken JA, Topp EM, Southard MZ, Lunte CE. Examination of microdialysis sampling in a well-characterized hydrodynamic system. Anal Chem. 1993;65:2324–8. doi: 10.1021/ac00065a026. [DOI] [PubMed] [Google Scholar]
- Tucci S, Rada P, Sepulveda MJ, Hernandez L. Glutamate measured by 6-s resolution brain microdialysis: Capillary electrophoretic and laser-induced fluorescence detection application. J Chromatogr B Biomed Sci Appl. 1997;694:343–9. doi: 10.1016/s0378-4347(96)00488-4. [DOI] [PubMed] [Google Scholar]
- Venton BJ, Robinson TE, Kennedy RT. Transient changes in nucleus accumbens amino acid concentrations correlate with individual responsivity to the predator fox odor 2,5-dihydro-2,4,5-trimethylthiazoline. J Neurochem. 2006;96:236–46. doi: 10.1111/j.1471-4159.2005.03549.x. [DOI] [PubMed] [Google Scholar]
- Wang M, Roman GT, Perry ML, Kennedy RT. Microfluidic chip for high efficiency electrophoretic analysis of segmented flow from a microdialysis probe and in vivo chemical monitoring. Anal Chem. 2009;81:9072–8. doi: 10.1021/ac901731v. [DOI] [PMC free article] [PubMed] [Google Scholar]
- Wang M, Roman GT, Schultz K, Jennings C, Kennedy RT. Improved temporal resolution for in vivo microdialysis by using segmented flow. Anal Chem. 2008;80:5607–15. doi: 10.1021/ac800622s. [DOI] [PMC free article] [PubMed] [Google Scholar]
- Watson CJ, Venton BJ, Kennedy RT. In vivo measurements of neurotransmitters by microdialysis sampling. Anal Chem. 2006;78:1391–9. doi: 10.1021/ac0693722. [DOI] [PubMed] [Google Scholar]
- Weiss DJ, Lunte CE, Lunte SM. In vivo microdialysis as a tool for monitoring pharmacokinetics. TrAC Trends in Anal Chem. 2000;19:606–16. [Google Scholar]
- Zhao B, Moore JS, Beebe DJ. Surface-directed liquid flow inside microchannels. Science. 2001;291:1023–6. doi: 10.1126/science.291.5506.1023. [DOI] [PubMed] [Google Scholar]
- Zhou J, Heckert DM, Zuo H, Lunte CE, Lunte SM. On-line coupling of in vivo microdialysis with capillary electrophoresis/electrochemistry. Anal Chim Acta. 1999;379:307–17. [Google Scholar]


