Abstract
Methylmalonic acidemia is a lethal inborn error of metabolism that causes mitochondrial impairment, multi-organ dysfunction and a shortened lifespan. Previous transmission electron microscope studies of thin sections from normal (Mut+/+) and diseased (Mut −/−) tissue found that the mitochondria appear to occupy a progressively larger volume of mutant cells with age, becoming megamitochondria. To assess changes in shape and volume of mitochondria resulting from the mutation, we carried out ion-abrasion–scanning electron microscopy (IA–SEM), a method for 3D imaging that involves the iterative use of a focused gallium ion beam to abrade the surface of the specimen, and a scanning electron beam to image the newly exposed surface. Using IA–SEM, we show that mitochondria are more convoluted and have a broader distribution of sizes in the mutant tissue. Compared to normal cells, mitochondria from mutant cells have a larger surface-area-to-volume ratio, which can be attributed to their convoluted shape and not to their elongation or reduced volume. The 3D imaging approach and image analysis described here could therefore be useful as a diagnostic tool for the evaluation of disease progression in aberrant cells at resolutions higher than that currently achieved using confocal light microscopy.
Keywords: Scanning Electron Microscopy, Focused Ion Beam, Ion Abrasion, Mitochondria, Methylmalonic Acidemia, Diagnostic Imaging
1. Introduction
Methylmalonic acidemia (MMA) is an autosomal recessive inborn error of metabolism caused by an inability of the 5′deoxycobalamin-dependent enzyme methylmalonyl-CoA mutase (MUT) to convert methylmalonyl-CoA to succinyl-CoA [1]. Patients suffer frequent metabolic decompensation, which causes an accumulation of methylmalonic acid in blood and tissues [1]. Multiple organs in the patients are compromised including the liver, kidney, pancreas and basal ganglia [2]. Patients have a shortened lifespan and require liver or kidney transplantation for survival [3]. Previous studies using (diseased) tissues from Mut −/− mice and the native liver from a patient with methylmalonic acidemia have demonstrated that morphological changes are present in mitochondria in the hepatocytes, proximal tubular renal epithelium and the pancreas, but not in other high energy tissues, such as the heart or skeletal muscle [4].
Analysis of the ultrastructural origins of the diseased phenotype using 2D transmission electron microscope (TEM) imaging revealed systemic, widespread mitochondrial enlargement into “megamitochondria” as the disease progressed in older mice, though the amount of liver mitochondria in the Mut −/− tissue was similar, as measured by mitochondrial DNA levels [5; 4]. The functional consequences of such changes in liver mitochondria manifest as widespread respiratory chain dysfunction and diminished reducing ability [4]. Lipid bodies also appeared to proliferate and enlarge in Mut −/− mouse liver [4]. These conclusions were derived from the inspection of many 2D images. A three-dimensional reconstruction of tissue would allow a quantitative comparison of mitochondrial and lipid droplet morphology and elucidate the early steps, and possible mechanism, of megamitochondria formation in selected cell types in this disorder. To extend the insights derived from 2D TEM imaging, we have used ion-abrasion–scanning electron microscopy (IA–SEM) [6–13], a newly emerging imaging technology, to compare the 3D architectures of mitochondria from normal and mutant tissue. In this automated approach for 3D imaging, a gallium ion beam iteratively abrades material off the surface of a macroscopic specimen such as plastic-embedded cells or tissues (typically in steps of ~15 nm to 50 nm), and an electron beam generates an image of the newly revealed face to produce a stack of 2D images.
The use of IA–SEM helps fill an important gap in imaging between light microscopy (~1 μm resolution) and higher resolution techniques such as transmission electron microscopy (~1 nm resolution or better) by providing 3D maps of whole organelles, cells and tissues at an intermediate resolution (~20–40 nm). Thus, while light microscopic methods now allow imaging beyond the diffraction limit, the visualization is limited to fluorescently tagged species at resolutions in the very best cases of ~15–100 nm in the imaging plane and ~100 nm along the optical axis [14]. With TEM, imaging is typically limited to sections with thicknesses in the range of ~50 to ~500 nm. The structural information in each section can be obtained either as a 2D projection image, or as a 3D volume using electron tomography. Thus, to reconstruct 3D images of large mammalian cells whose thicknesses typically exceed 10 microns, samples must be sectioned into a series of thin sections, and imaged in such a way that the 2D or 3D images from each section can be aligned in a stack to obtain the 3D image of the cell. This is a feasible approach, but can be time-consuming and tedious in practice, and subject to artifacts arising from loss of material between successive sections, and missing wedge distortion, when serial tomographic reconstructions are employed[15]. Alternative approaches such as X-ray tomography are at early stages of development, but remain at significantly lower resolutions that what can be achieved by either IA–SEM or TEM [16].
Here, we have used IA–SEM to carry out a quantitative analysis of comparative mitochondrial morphologies obtained from the liver of 4-day-old, healthy, control and 4-day-old, diseased, Mut −/− mice. Under these conditions, hepatocytes in the diseased mice are captured at a stage when structural changes to the mitochondria begin to appear, but before completion of conversion to megamitochondria. The technical focus of this work is to develop and evaluate quantitative tools to analyze 3D volumetric data in IA–SEM as they relate to describing subcellular changes in diseased cells and tissues.
2. Methods
2.1 Western blotting
Animal studies were reviewed and approved by the National Human Genome Research Institute Animal User Committee. The mutase-deficient, diseased mice, called Mut −/−, were produced as described [4]. Tissue samples were homogenized with a 2-ml Tenbroeck tissue grinder (Wheaton, Millville, NJ) in T-PER (Pierce Biotechnology, Rockford, IL) tissue protein extraction buffer in the presence of Halt (Pierce Biotechnology) protease inhibitor cocktail. Sixty micrograms of clarified extract were used in Western analysis and probed with affinity-purified, rabbit polyclonal antisera raised against the murine methylmalonyl-CoA mutase enzyme [17]. Complex III Core II was used as a loading control and was also detected by immunoblotting [mouse monoclonal anti-OxPhos Complex III (ubiquinol-cytochrome c oxidoreductase) Core II antibody, Invitrogen SKU# A-11143]. The anti-mutase antibody was used at a dilution of 1:750 and the anti-Complex III Core II antibody was used at a dilution of 1:2000. Horseradish peroxidase (HRP)-conjugated antirabbit IgG (NA934; GE Healthcare Life Sciences, Piscataway, NJ) or rabbit antigoat IgG (sc-2768; Santa Cruz Biotechnology) was used as the secondary antibody and was visualized with chemiluminescence detection (Pierce Biotechnology).
2.2 Preparation of plastic-embedded liver tissue
Fresh liver tissue from a control and from a Mut −/− littermate were obtained on their fourth day of life and fixed in 2 % glutaraldehyde in 0.1 M cacodylate buffer (pH 7.4) overnight at 4° C. The tissues were washed with cacodylate buffer and postfixed with 2% OsO4 for two hours. The tissue was washed again with 0.1 M cacodylate buffer, serially dehydrated in ethanol and embedded in EMBed 812 resin (Electron Microscopy Sciences, Hatfield, PA, USA).
2.3 Tomography procedures
Thin sections, ~70 –80 nm thick, were obtained by utilizing the Leica ultracut-UCT ultramicrotome (Leica, Deerfield, IL, USA) and placed onto 200 mesh copper grids. 10 nm gold was applied to the grids and excess was washed off. The grids were loaded into a Gatan High-Tilt holder and placed into a FEI Tecnai T12 electron microscope operated at 120 kV with a LaB6 filament. Images were collected on a Gatan 4k CCD with a binning factor of 2. Tomograms were acquired automatically using Inspect3D (FEI) with a nominal magnification of 21,000, a sampling of 10.8 Å/pixel, a dose of ~1000 e−/Å2, an underfocus of 2.5 μm, tilt extrema of 66° or 70°, and a tilt increment of 2°. Single-axis tilt series were aligned and tomograms generated using IMOD [18].
2.4 Ion-abrasion–SEM procedures
The resin-embedded specimen block was trimmed to a 1 mm2 pyramidal face with a razor blade. Ultrathin sections were prepared using a microtome and surveyed in a TEM to identify regions suitable for imaging. The top of the block was then removed and attached to a SEM stub using silver paint. The stub and specimen were then sputter-coated with gold to reduce specimen charging. The specimen was loaded into a Nova 200 Nanolab DualBeam™ SEM/FIB (FEI, Hillsdale, OR). A ~0.5 μm thick layer of platinum was deposited on a region of interest using a gas injector system and the ion beam was set to 30 kV and 0.5 nA. In front of the region, a trench was created using the ion beam at a 7 nA current. The sample was again sputter-coated to ensure conductance and reduce charging on the exposed surface. The exposed face was polished using the ion beam at 5 nA. Conditions used for data collection were 3kV for the electron beam at a 0.27 nA current, an extraction voltage of −50 V for the Everhart-Thornley detector, and an effective magnification of 10383× (3 nm/pixel), corresponding to a horizontal field width of 12.3 μm (4096×3036 pixels). 2D image stacks were collected using the ‘slice-and-view’ imaging module (FEI) with a nominal sectioning thickness of 40 nm.
2.5 Image processing and analysis
SEM image stacks were iteratively and automatically aligned using the IMOD tiltxcorr program and a customized script. The contrast was inverted solely for purposes of visualization to facilitate comparison to TEM images, and denoised using anisotropic diffusion based methods implemented in IMOD. SEM images were 12.3 long and 10.6 μm wide. After images were aligned, the volume was trimmed to create a volume that contained only data, not background grey values, with dimensions of ~12 × 8 × 4 μm in each case. To produce Fig. 2, the volume was non-isotropically binned by 4 to produce a 12 nm pixel size and the z dimension of 40 nm was interpolated to 12 nm. The mitochondria and lipid bodies were segmented manually with the Amira brush tool on the original stack (Amira, Visage Imaging, Andover, MA). The individual mitochondrial and lipid body volumes and the mitochondrial surface area were measured using Amira. To make the comparisons shown in panels B, C, E and F more meaningful, the numbers of mitochondria in control and Mut −/− cells were scaled to the 3D volumes of the respective stacks (see legend to Figure 3). The Gaussian curvature for each mitochondrion was calculated using the Segmentation and Registration Toolkit from Insight (www.itk.org), as follows. The surfaces were extracted from the segmentation and resampled into isotropic 21.9 nm voxels. The morphological closing of the volume was performed using a binary structured element with a radius of 4 voxels. 100 iterations of the level-set–based, curvature-flow smoothing filter were then applied to further remove small features with high curvature [19]. The Gaussian curvature was computed for the isosurfaces contained in the volumes using a recursive derivative of Gaussian filters with a sigma of 40 nm, a method previously described [20]. The curvature values were then extracted at each voxel on the smoothed contour representing the mitochondria.
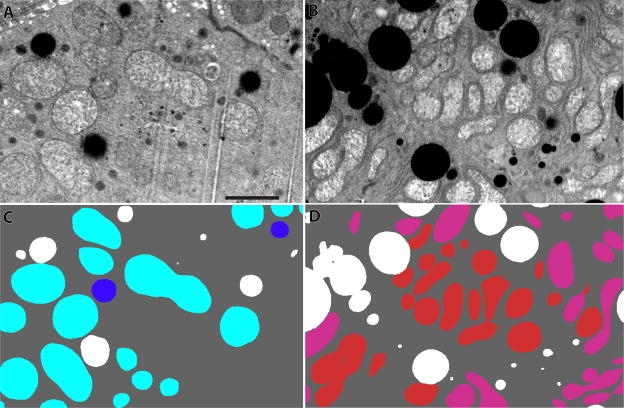
Figure 2.
Backscattered SEM images of murine liver cells. (A) A backscattered image of a portion of a control murine liver cell showing the density distribution. The dark objects are lipid bodies. (B) A backscattered image of a Mut −/− murine liver. (C) A segmentation of panel A with lipid in white, whole mitochondria in blue and partial mitochondria (those that run off the edges of the reconstructed volume) in aqua. (D) A segmentation of panel B with lipid again in white, whole mitochondria in red and partial mitochondria in pink. Mut −/− liver tissue has more and more contorted mitochondria. The scale bar is 2 μm.
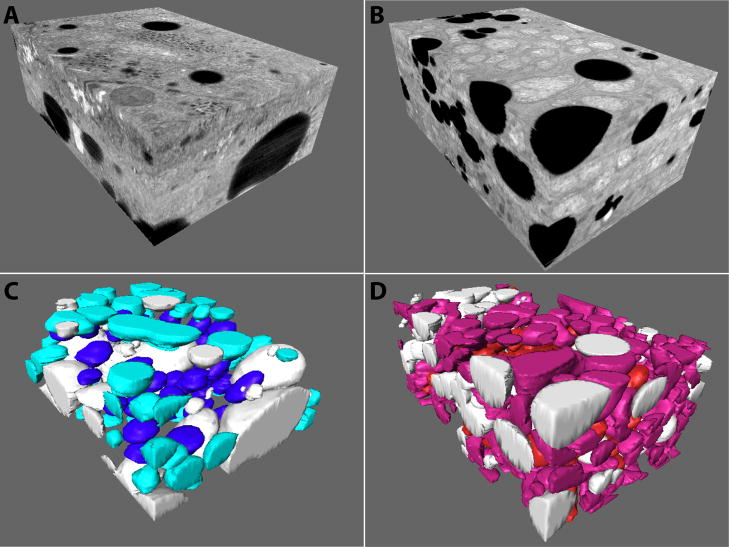
Figure 3.
3D views of the two IA–SEM reconstruction volumes of murine liver cell portions. (A) The 3D volume from a portion of the control tissue. (B) The 3D volume from the Mut −/− tissue. (C, D) Segmented representation of the control and Mut −/− tissues. Partially represented control and Mut −/− mitochondria are respectively shown in lighter colors (aqua and pink), while whole control and Mut −/− mitochondria are shown in blue and red, respectively. The volumes have dimensions of 11.3 × 8.1 × 3.9 μm (354 μm3) and 11.8 × 7.5 × 4.9 μm (435 μm3) for the control and Mut −/− tissues, respectively
3. Results
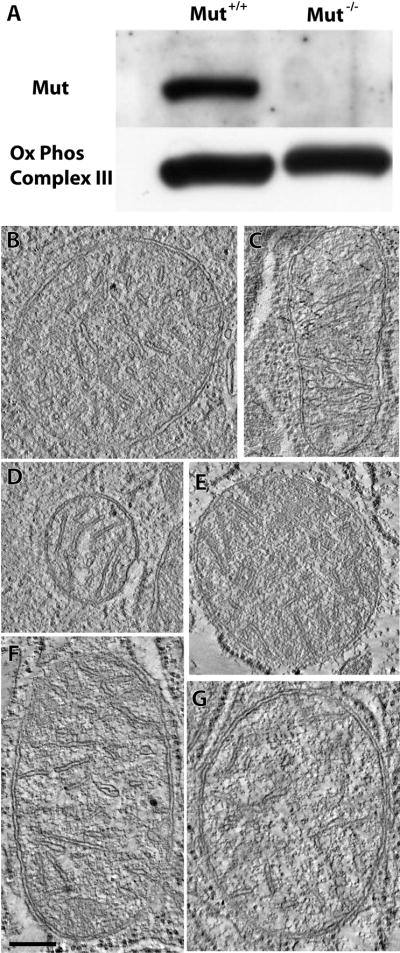
To ascertain whether there were gross changes in mitochondrial mass between the Mut −/− and control samples, Mut and mitochondrial enzyme levels were assessed by Western blotting (Figure 1A). These experiments show that although the mutase-deficient mice lacked a detectable amount of mutase, as expected, the amount of a marker for mitochondrial mass, i.e., oxidative phosphorylation enzyme Q-cytochrome c oxidoreductase (complex III) core II, was similar (p=0.11). This result, in combination with mitochondrial DNA similarities[4], shows that bulk mitochondrial protein and DNA mass are similar in the Mut −/− and control tissues, laying the foundation for the more quantitative comparative analyses we carried out.
Figure 1.
A Western blot of mitochondrial mass and tomograms of individual mitochondria. (A) While mutase levels were undetectable in the Mut −/− tissue, levels of a marker of mitochondrial mass, oxidative phosphorylation complex III core II, were similar in control and Mut −/− mouse liver tissue. (B, C and D) A 2.2 nm thick tomographic slice through three different mitochondria from the control sample. (E, F and G) A 2.2 nm tomographic slice through three different mitochondria from the Mut −/− sample. The scale bar is 250 nm.
Initially, we used electron tomography of thick sections to get an initial impression of morphological differences between control (Figures 1B–D) and Mut −/− (Figures 1E–G) mitochondria. In both cases, the general appearance of mitochondrial cross-sections and cristae is comparable, indicating that differences if any, would only be apparent in 3D images of a larger volume. In contrast, IA–SEM imaging of the tissue specimens revealed measurable differences. Inspection of single SEM slices through the stack suggested that mitochondria occupy a greater region of the sampled Mut −/− cells than of the sampled control cells (Figure 2). This difference is further underscored in the segmented representation of 3D images of the cells (Figure 3), which reveal higher mitochondrial density and greater contortion in the Mut −/− tissue (see also Supplementary Movies 1–4). Because the reconstructions are of a portion of liver tissue cells, some of the mitochondria run off the edges and are imaged only partially. These partially represented control and Mut −/− mitochondria are respectively colored aqua and pink in Figure 3, while the whole mitochondria are respectively colored blue and red. To eliminate any bias from the use of partial mitochondria, the conclusions we present here are derived only from analysis of whole mitochondria. We note, however, that because of the large numbers of mitochondria included in our analysis, the same trends and variations were also observed when only the partial mitochondria were included in the analysis, or when both whole and partial mitochondria were considered together.
Mitochondria in the reconstructed Mut −/− liver tissue volume are more numerous and, in total sum, more voluminous. Based on consideration of 80 whole and 113 partial mitochondria in the Mut −/− tissue, and 40 whole and 57 partial mitochondria in the control tissue, we find that the relative volume occupied by mitochondria is ~68% higher in Mut −/− tissue (23% versus 14% of the reconstructed volume occupied by mitochondria, for Mut −/− and control tissue, respectively), as measured by the segmentation of volumes corresponding to mitochondria. As evident in single slices, lipid bodies are present in both control and Mut −/− tissue, but in contrast to the difference in mitochondrial volumes, differences in lipid are less than 5% in volume (20% versus 18% for control and Mut −/− tissue, respectively).
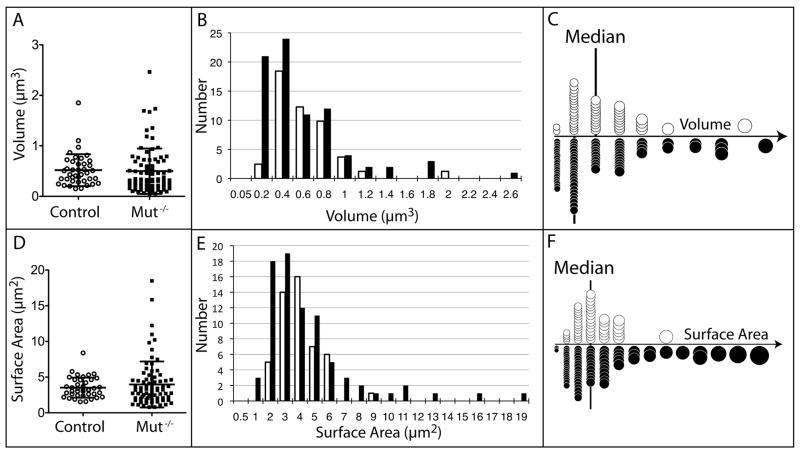
The Mut −/− mitochondria are more numerous and occupy a larger total volume and also display greater variation in volume and in surface area (Table 1). The volume and surface area distributions of both control and Mut −/− mitochondria are non-normal and have a positive skew. Because the distributions are not normal, a two-tailed Mann-Whitney test was used to compare the median mitochondrial volumes and surface areas, and we established that the distributions are not statistically different (Figure 4). The disproportionately higher surface area of mitochondria in Mut −/− tissue (cf. Figures 4C and 4F) suggested that they may be more convoluted in shape, and we assessed this in further detail by comparing median surface area to volume ratios.
Table 1.
| Mitochondrial Volume (μm2) | Mitochondrial Surface Area (μm2) | ||||||
|---|---|---|---|---|---|---|---|
| Whole Control | Whole Mut −/− | Patial Control | Patial Mut −/− | Whole Control | Whole Mut −/− | ||
| Number of mitochondria | 40 | 80 | 57 | 133 | Number of mitochondria | 40 | 80 |
| Minimum | 0.1515 | 0.05027 | 0.03608 | 0.005028 | Minimum | 1.54 | 0.79 |
| Median | 0.4466 | 0.3303 | 0.2765 | 0.2383 | Median | 3.235 | 3.075 |
| Maximum | 1.85 | 2.464 | 2.539 | 3.398 | Maximum | 8.39 | 18.49 |
| Mean | 0.5181 | 0.4985 | 0.498 | 04608 | Mean | 3.525 | 3.967 |
| Standard Deviation | 0.316 | 0.4494 | 0.5136 | 0.5239 | Std Deviation | 1.411 | 3.224 |
| Normal distribution? | No | No | No | No | Normal Distribution? | No | No |
| Sum of Mito. Volumes | 20.72 | 39.88 | 28.39 | 61.29 | Sum of Mito Surface Areas | 141 | 317.4 |
| Comparisons of Medians | Comparisons of Medians | ||||||
| Two-tailed Mann-Whitney Test | Whole Control vs Whole Mut −/− | Partial Control vs Partial Mut −/− | Two-tailed Mann-Whitney Test | Whole Control vs Whole Mut −/− | |||
| Are medians sig. different? | No | No | Are medians sig. different? | No | |||
| P value | 0.0988 | 0.2803 | P value | 0.4692 | |||
| Mann-Whitney U | 1303 | 3415 | Mann-Whitney U | 1470 | |||
Figure 4.
Plots of the volumes and surface areas of individual, whole mitochondria. (A) Column scatter plot of volumes. Control data points are black, empty circles, while Mut −/− data points are black, filled squares. The mean and standard deviation are marked with black lines. (B) Histogram of volumes, with control values in the unfilled bar and Mut −/− values in the black, filled bars. (C) Graphic of panel B with mitochondria scaled as spheres. The median is marked with a vertical line. Unfilled circles are control mitochondrial values, while black, filled circles are Mut −/− mitochondrial values. (D) Column scatter plot of surface areas. The mean and standard deviation are marked with black lines. (E) Histogram of surface areas. (F) Graphic of panel E with mitochondria scaled as spheres. The median is marked with a vertical line.
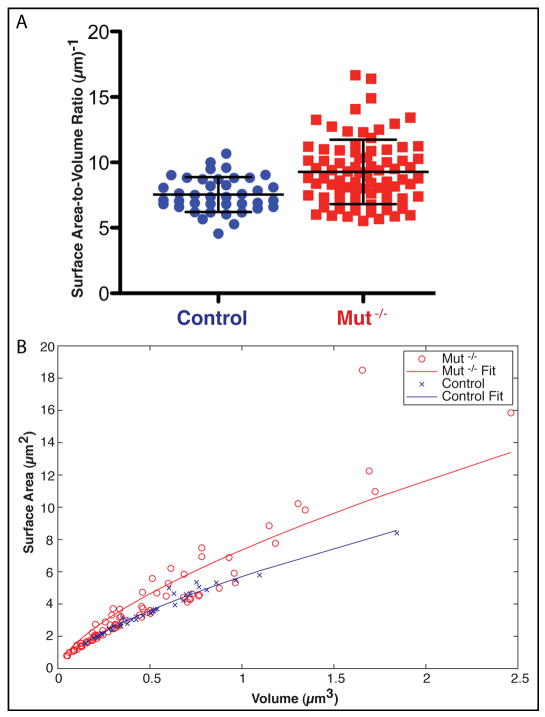
As summarized in Table 2, the mean surface-area-to-volume ratios of Mut −/− mitochondria are 23% higher than in control mitochondria, a significant difference according to a two-tailed Mann-Whitney test (Figure 5A). The increased surface-area-to-volume ratio in Mut −/− mitochondria is not due to the numerous, small, Mut −/− mitochondria, which might have skewed the results. To establish this point quantitatively, we show that the surface area relative to volume of the control mitochondria lie along a line SurfaceArea = m * Volume2/3, with m = 5.7 (R2 = 0.996) (Figure 5B). In contrast, the Mut −/− mitochondria fall into two groups. Most of the Mut −/− mitochondria lie along the line fit to the control mitochondrial ratios, but 32% of the Mut −/− mitochondria (hereafter called abnormal) have enlarged surface areas throughout the range of volumes. A line was fit for all the Mut −/− points with m = 7.4 (R2 = 0.94).
Table 2.
| Mitochondrial Surface Area to Volume Ratio (μm−1) | Percent Positive Gaussian Curvature | ||||
|---|---|---|---|---|---|
| Control SA-V ratio | Mut −/− SA-V ratio | Control | Mut −/− | ||
| Number of values | 40 | 80 | Number of values | 40 | 80 |
| Minimum | 4.555 | 5.519 | Minimum | 77.3% | 54.1% |
| Median | 7.354 | 8.837 | Median | 91.2% | 87.4% |
| Maximum | 10.68 | 16.67 | Maximum | 100.0% | 100.0% |
| Mean | 7.54 | 9.273 | Mean | 90.7% | 83.1% |
| Standard Deviation | 1.336 | 2.464 | Std. Deviation | 66% | 14.1% |
| Normal distribution? | Yes | No | Normal distribution? | Yes | No |
| Comparisons of Medians | Comparisons of Medians | ||||
| Two-tailed Mann-Whitney Test | Control vs Mut −/− SA-V ratio | Two-tailed Mann-Whitney Test | Control vs Mut −/− Curvature | ||
| Are medians sig. different? | Yes | Are medians sig. different? | Yes | ||
| P value | 0.0002 | P value | 0.0203 | ||
| Mann-Whitney U | 919.5 | Mann-Whitney U | 1183 | ||
Figure 5.
Surface-area-to-volume ratios of the individual, whole mitochondria. (A) Surface-area-to-volume ratio column scatter plot, with delineated mean and standard deviation of the control and Mut −/− mitochondria. (B) Surface area plotted against volume. The lines are fit to the data, as explained in the text. Control data points are in blue, while Mut −/− data points are in red.
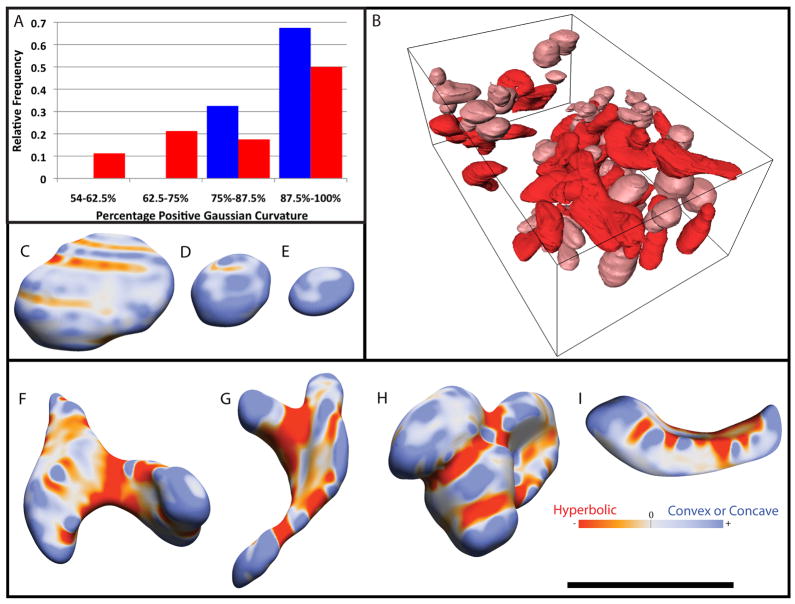
An interesting result that emerges from the 3D visualization is that the abnormal Mut −/− mitochondria are clearly more convoluted and display greater curvature variation across the surface. To compare the geometric deformities of Mut −/− mitochondria to the mostly spheroidal control ones, the Gaussian curvature along the whole surface of each mitochondrion was measured. Gaussian curvature is positive for concave or convex regions and negative for hyperbolic regions. A spheroid only has positive curvature. Upon visual inspection of the surfaces, concave regions appeared to be relatively rare while negative curvature seemed more common in Mut −/− surfaces. A metric was therefore chosen to differentiate the two types of surfaces. The curvature at each point was categorized and the percent positive Gaussian curvature (PPGC) was output. The percentage of the curvature that was positive, i.e., that displayed convex or concave curvature, was tabulated in Table 2 and displayed as a histogram in Fig. 6A. The median value of the PPGC was 91.2% and 87.4% for control and Mut −/− mitochondria, respectively. The median values were significantly different according to a two-tailed Mann-Whitney test. Fig. 6A shows that the Mut −/− mitochondrial curvature appears to be bimodal, with most Mut −/− mitochondria being similar to control ones, yet many (32%) having more hyperbolic curvature. Those mitochondria with a PPGC less than 75% are defined as abnormal, because the lowest PPGC seen in control mitochondria is 75% in this study. In order to view the general shape of normal and abnormal mitochondria, Figure 6B shows Mut −/− tissue with abnormal, whole, mitochondria colored red and normal, whole mitochondria colored pink. Figure 5B and Figure 6A can be compared, for instance, in that the twelve Mut −/− mitochondria with the largest surface area in relation to volume (the points in Fig. 5B that lie along the upper part of the Mut −/− fit) also all had high amounts of hyperbolic curvature, with their PPGC less than 69%. Thus, Mut −/− mitochondria with unusually high surface areas at any given volume also have more hyperbolic curvature. This is illustrated in Figures 6C–I using color-coding to reflect curvature. While control mitochondria (Figures 6C–E) and normal Mut −/− mitochondria are mostly shaped like oblate spheroids with convex Gaussian curvature, abnormal Mut −/− mitochondria (Figures 6F–I) are largely distorted, with substantially more hyperbolic curvature. Control mitochondria in Figures 6C–E have a PPGC of 77%, 96% and 100%, respectively, while abnormal Mut −/− mitochondria in Figures 6F–I have a PPGC of 55%, 58%, 66% and 70%, respectively. The volume of the normal, whole Mut −/− mitochondria comprise only ~ 45% of the total whole mitochondrial population, and the relative proportion of the sample volume occupied by these “normal” mitochondria is less (only ~70%) than the relative proportion occupied by “normal” mitochondria in the control tissue sample. This is because the average size of the normal, whole, Mut −/− mitochondria is smaller (only ~65%) than whole control mitochondria.
Figure 6.
Curvature of the individual, whole mitochondria. (A) Measurement of curvature displayed as a histogram of percent positive (non-hyperbolic) Gaussian curvature. Control mitochondrial values are in blue and Mut −/− mitochondrial values are in red. (B) A 3D view of all eighty, whole Mut −/− mitochondria with normal shaped mitochondria in pink and abnormal shaped mitochondria in red. (C–E) Control mitochondrial shapes. The color bar shows that red is hyperbolic Gaussian curvature and blue is either concave or convex curvature. (F–I) Mut −/− mitochondrial shapes. The black scale bar is 2 μm.
4. Discussion
Our results show that though individual mitochondria from 4-day-old, Mut −/− mouse liver had similar median volumes, surface areas and matrix marker protein mass as compared to control tissue, they are more numerous and therefore occupy a greater proportion of cellular volume and displayed a broader distribution of sizes. The similar amounts of the mitochondrial matrix marker, together with the increased volume, suggest that protein mass does not scale with volume, possibly because the volume increase originates from changes in concentration and amount of metabolic intermediates, and not from a proportional enlargement of mitochondria. 32% of the mitochondria possessed a higher surface-area-to-volume ratio and more hyperbolic curvature than control mitochondria and accounted for 55% of the mitochondrial volume fraction. Examination of individual volumes showed that mitochondria with unusually high surface area at any volume also had more hyperbolic curvature. In addition, no excessive lipid accumulation was found in the 4-day-old, Mut −/− mouse liver compared to control tissue.
An increase in mitochondrial surface area does not imply an increase in hyperbolic curvature – for example, a mitochondrion with a tubular shape (i.e. a lengthened ellipsoid) could have a greater surface area than an ellipsoidal one, but it would not have any hyperbolic curvature. On the other hand, if the tube were branched, it would have hyperbolic curvature at the branch points. One possible origin of the observed increase in both hyperbolic curvature and surface area (with respect to volume) could be an increase in mitochondrial fusion or a failure to complete mitochondrial fission, because the plane of contact would have hyperbolic curvature. Megamitochondria are believed to form not by simple osmotic swelling, but perhaps by increased fusion, decreased fission or hypertrophy [5]. Mitochondria normally undergo periodic fusion and fission. Mitochondria in COS7 and INS1 cells undergo fusion every ~5–20 minutes, followed by fission ~100 seconds later [21]. The presence of large, hyperbolic Mut −/− mitochondria in our study, however, is accompanied by an increase in small mitochondria, which one might speculate is the product of increased fission. An explanation for the increase in small and large mitochondria might therefore be due to a perturbation of normal mitochondrial fission and fusion behavior.
The work we have presented here demonstrates the use of IA–SEM to provide quantitative assessments of 3D morphological differences of subcellular organelles in tissue at nanoscale resolution. This type of analysis could thus potentially form the basis of a diagnostic tool to evaluate disease progression using metrics that report on quantitative differences between control and diseased cells at resolutions substantially higher than that achieved using confocal light microscopy.
Supplementary Material
Acknowledgments
This research was supported by the Center for Cancer Research, which is the Intramural Research Program of the National Cancer Institute, NIH.
Appendix A. Supplementary Material
Supplementary data associated with this article includes Supp. Movie 1 and Supp. Movie 2, which are orthoslice movies of the control and Mut −/− volumes, respectively, and Supp. Movie 3 and Supp. Movie 4, which are movies of the segmented mitochondria from the control and Mut −/− volumes, respectively.
Footnotes
Publisher's Disclaimer: This is a PDF file of an unedited manuscript that has been accepted for publication. As a service to our customers we are providing this early version of the manuscript. The manuscript will undergo copyediting, typesetting, and review of the resulting proof before it is published in its final citable form. Please note that during the production process errors may be discovered which could affect the content, and all legal disclaimers that apply to the journal pertain.
References
- 1.Fenton WA, Gravel RA, Rosenblatt DS. Disorders of Propionate and Methylmalonate Metabolism. In: Scriver CR, et al., editors. The Metabolic and Molecular Bases for Inhertited Disease. McGraw-Hill, Inc; New York: 2001. pp. 2165–2192. [Google Scholar]
- 2.Horster F, Baumgartner MR, Viardot C, Suormala T, Burgard P, Fowler B, Hoffmann GF, Garbade SF, Kolker S, Baumgartner ER. Long-term outcome in methylmalonic acidurias is influenced by the underlying defect (mut0, mut-, cblA, cblB) Pediatr Res. 2007;62:225–30. doi: 10.1203/PDR.0b013e3180a0325f. [DOI] [PubMed] [Google Scholar]
- 3.Leonard JV, Walter JH, McKiernan PJ. The management of organic acidaemias: the role of transplantation. J Inherit Metab Dis. 2001;24:309–11. doi: 10.1023/a:1010395724012. [DOI] [PubMed] [Google Scholar]
- 4.Chandler RJ, Zerfas PM, Shanske S, Sloan J, Hoffmann V, DiMauro S, Venditti CP. Mitochondrial dysfunction in mut methylmalonic acidemia. FASEB J. 2009;23:1252–61. doi: 10.1096/fj.08-121848. [DOI] [PMC free article] [PubMed] [Google Scholar]
- 5.Wakabayashi T. Megamitochondria formation - physiology and pathology. J Cell Mol Med. 2002;6:497–538. doi: 10.1111/j.1582-4934.2002.tb00452.x. [DOI] [PMC free article] [PubMed] [Google Scholar]
- 6.Subramaniam S. Bridging the imaging gap: visualizing subcellular architecture with electron tomography. Curr Opin Microbiol. 2005;8:316–22. doi: 10.1016/j.mib.2005.04.012. [DOI] [PMC free article] [PubMed] [Google Scholar]
- 7.Heymann JA, Hayles M, Gestmann I, Giannuzzi LA, Lich B, Subramaniam S. Site-specific 3D imaging of cells and tissues with a dual beam microscope. J Struct Biol. 2006;155:63–73. doi: 10.1016/j.jsb.2006.03.006. [DOI] [PMC free article] [PubMed] [Google Scholar]
- 8.Drobne D, Milani M, Leser V, Tatti F, Zrimec A, Znidarsic N, Kostanjsek R, Strus J. Imaging of intracellular spherical lamellar structures and tissue gross morphology by a focused ion beam/scanning electron microscope (FIB/SEM) Ultramicroscopy. 2008;108:663–70. doi: 10.1016/j.ultramic.2007.10.010. [DOI] [PubMed] [Google Scholar]
- 9.Knott G, Marchman H, Wall D, Lich B. Serial section scanning electron microscopy of adult brain tissue using focused ion beam milling. J Neurosci. 2008;28:2959–64. doi: 10.1523/JNEUROSCI.3189-07.2008. [DOI] [PMC free article] [PubMed] [Google Scholar]
- 10.Bennett AE, Narayan K, Shi D, Hartnell LM, Gousset K, He H, Lowekamp BC, Yoo TS, Bliss D, Freed EO, Subramaniam S. Ion-abrasion scanning electron microscopy reveals surface-connected tubular conduits in HIV-infected macrophages. PLoS Pathog. 2009;5:e1000591. doi: 10.1371/journal.ppat.1000591. [DOI] [PMC free article] [PubMed] [Google Scholar]
- 11.De Winter DA, Schneijdenberg CT, Lebbink MN, Lich B, Verkleij AJ, Drury MR, Humbel BM. Tomography of insulating biological and geological materials using focused ion beam (FIB) sectioning and low-kV BSE imaging. J Microsc. 2009;233:372–83. doi: 10.1111/j.1365-2818.2009.03139.x. [DOI] [PubMed] [Google Scholar]
- 12.Heymann JA, Shi D, Kim S, Bliss D, Milne JL, Subramaniam S. 3D imaging of mammalian cells with ion-abrasion scanning electron microscopy. J Struct Biol. 2009;166:1–7. doi: 10.1016/j.jsb.2008.11.005. [DOI] [PMC free article] [PubMed] [Google Scholar]
- 13.Hildebrand M, Kim S, Shi D, Scott K, Subramaniam S. 3D imaging of diatoms with ion-abrasion scanning electron microscopy. J Struct Biol. 2009;166:316–28. doi: 10.1016/j.jsb.2009.02.014. [DOI] [PMC free article] [PubMed] [Google Scholar]
- 14.Huang B, Jones SA, Brandenburg B, Zhuang X. Whole-cell 3D STORM reveals interactions between cellular structures with nanometer-scale resolution. Nat Methods. 2008;5:1047–52. doi: 10.1038/nmeth.1274. [DOI] [PMC free article] [PubMed] [Google Scholar]
- 15.Noske AB, Costin AJ, Morgan GP, Marsh BJ. Expedited approaches to whole cell electron tomography and organelle mark-up in situ in high-pressure frozen pancreatic islets. J Struct Biol. 2008;161:298–313. doi: 10.1016/j.jsb.2007.09.015. [DOI] [PMC free article] [PubMed] [Google Scholar]
- 16.Parkinson DY, McDermott G, Etkin LD, Le Gros MA, Larabell CA. Quantitative 3-D imaging of eukaryotic cells using soft X-ray tomography. J Struct Biol. 2008;162:380–6. doi: 10.1016/j.jsb.2008.02.003. [DOI] [PMC free article] [PubMed] [Google Scholar]
- 17.Chandler RJ, Tsai MS, Dorko K, Sloan J, Korson M, Freeman R, Strom S, Venditti CP. Adenoviral-mediated correction of methylmalonyl-CoA mutase deficiency in murine fibroblasts and human hepatocytes. BMC Med Genet. 2007;8:24. doi: 10.1186/1471-2350-8-24. [DOI] [PMC free article] [PubMed] [Google Scholar]
- 18.Kremer JR, Mastronarde DN, McIntosh JR. Computer visualization of three-dimensional image data using IMOD. J Struct Biol. 1996;116:71–6. doi: 10.1006/jsbi.1996.0013. [DOI] [PubMed] [Google Scholar]
- 19.Sethian JA. Level set methods and fast marching methods. Cambridge University Press; 1999. Image Enhancement and Noise Removal; p. 118. [Google Scholar]
- 20.Kindlmann G, Whitaker R, Tasdizen T, Moller T. Curvature-Based Transfer Functions for Direct Volume Rendering: Methods and Applications. Proceedings of the 14th IEEE Visualization 2003 (VIS’03); IEEE Computer Society; 2003. [Google Scholar]
- 21.Twig G, Elorza A, Molina AJ, Mohamed H, Wikstrom JD, Walzer G, Stiles L, Haigh SE, Katz S, Las G, Alroy J, Wu M, Py BF, Yuan J, Deeney JT, Corkey BE, Shirihai OS. Fission and selective fusion govern mitochondrial segregation and elimination by autophagy. EMBO J. 2008;27:433–46. doi: 10.1038/sj.emboj.7601963. [DOI] [PMC free article] [PubMed] [Google Scholar]
Associated Data
This section collects any data citations, data availability statements, or supplementary materials included in this article.


