Abstract
This paper describes a novel experiment on nitroxide radical spin labels using a multiarm EPR W-band bridge with a loop-gap resonator (LGR). We demonstrate EPR spectroscopy of spin labels by linear sweep of the microwave frequency across the spectrum. The high bandwidth of the LGR, about 1 GHz between 3 dB points of the microwave resonance, makes this new experiment possible. A frequency-tunable yttrium iron garnet (YIG) oscillator provides sweep rates as high as 1.8 × 10⁵ GHz/s, which corresponds to 6.3 kT/s in magnetic field-sweep units over a 44 MHz range. Two experimental domains were identified. In the first, linear frequency sweep rates were relatively slow, and pure absorption and pure dispersion spectra were obtained. This appears to be a practical mode of operation at the present level of technological development. The main advantage is the elimination of sinusoidal magnetic field modulation. In the second mode, the frequency is swept rapidly across a portion of the spectrum, and then the frequency sweep is stopped for a readout period; FID signals from a swept line oscillate at a frequency that is the difference between the spectral position of the line in frequency units and the readout position. If there is more than one line, oscillations are superimposed. The sweep rates using the YIG oscillator were too slow, and the portion of the spectrum too narrow to achieve the full EPR equivalent of Fourier transform (FT) NMR. The paper discusses technical advances required to reach this goal. The hypothesis that trapezoidal frequency sweep is an enabling technology for FT EPR is supported by this study.
1. Introduction and methods
1.1. Overview
In continuous wave (CW) EPR spectroscopy, it is customary to hold the microwave frequency constant and sweep the applied magnetic field through the EPR spectrum. One could, in principle, hold the magnetic field constant and sweep the microwave frequency. However, this is seldom done because the microwave components, and, particularly, the microwave resonator in which the sample is placed, are narrow band. The bandwidth of a matched resonator Δf is given by the expression Δf = fo/Q, where fo is the microwave resonant frequency and Q is the quality factor of the resonator. Thus, the bandwidth can be increased by increasing the resonant frequency and also by decreasing the Q-value. We have developed a W-band (94 GHz) loop-gap resonator (LGR) that has a Q-value of about 100 [1]. Use of this resonator results in a 3 dB bandwidth of about 1 GHz, which makes microwave frequency sweeps feasible. So-called “frequency agile” EPR spectroscopy at W-band is the subject of this paper.
Rapid passage effects in EPR are well known. They arise from the sweep of the nominally static magnetic field through resonance while applying a sinusoidal magnetic field modulation of sufficiently high frequency and amplitude in the presence of sufficiently high incident microwave power. Weger has classified the various types of effects that can be observed [2]. A single sweep of the magnetic field through an EPR spectrum, if sufficiently rapid, can be expected to tilt the magnetizations of all lines in the spectrum such that the magnetization of each line has a component transverse to the applied field in the rotating frame. With the applied magnetic field, static after the completion of the single sweep, these magnetizations can be expected to precess at different rates as free induction decay (FID) occurs in the familiar manner of FT NMR. However, the possibility of developing a robust EPR analog to FT NMR using magnetic field sweep is remote because of the technical difficulty in producing a sufficiently rapid sweep and the complications arising from induced eddy currents in metallic components of the microwave resonator. In this paper, we show results of analogous experiments where the microwave frequency rather than the magnetic field is swept. The gyromagnetic ratio of the free electron, 2.8 MHz/G, can be used to compare field and frequency sweeps. Eddy currents in the sample resonator are avoided and sweeps of frequency can be much more rapid than sweeps of field.
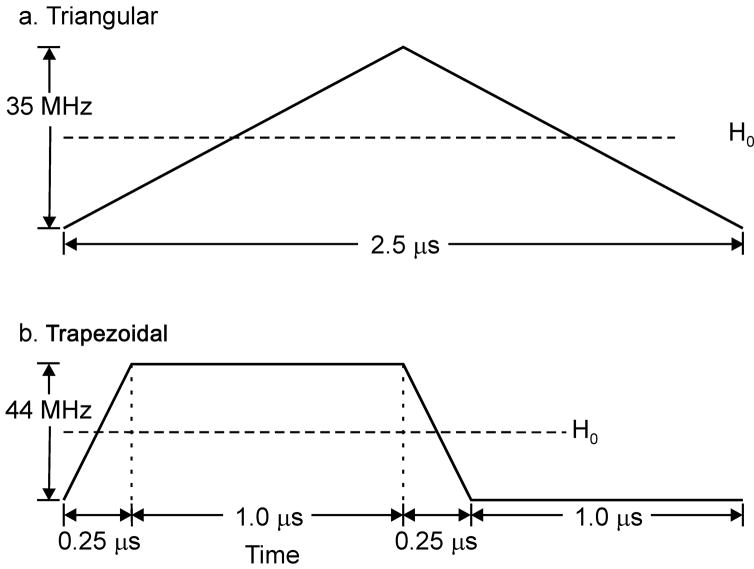
We have previously described replacement of the customary 100 kHz magnetic field modulation by sinusoidal modulation of the microwave frequency [3]. In the present work, the microwave frequency is swept in either a triangular manner or a trapezoidal manner across a substantial portion of the EPR spectrum (see Fig. 1). Rapid sweeps were obtained with the apparatus of Fig. 2, where the output of this circuit is further mixed with a Q-band source to arrive at 94 GHz. Frequency deviations can be as great as 1 GHz at low repetition rates or as great as 40 MHz at a repetition rate of 2 MHz, with various intermediate combinations also allowed. The frequency sweep rates and maximum deviations are addressed in detail in section 1.4.
Figure 1.
Frequency-sweep waveforms: (a) Example display of one of the triangular frequency-sweep waveforms used. (b) The trapezoidal waveform used for the data acquisition in Figs. 7 and 8. The H0 lines show the position of the EPR line center in the frequency-sweep range.
Figure 2.
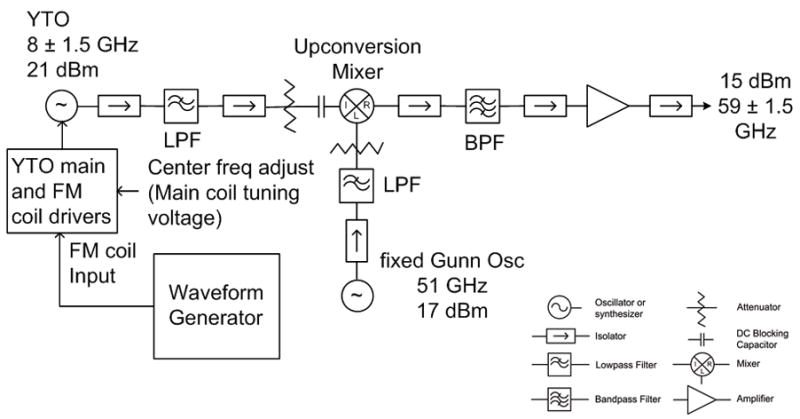
V-band source: YIG-tuned oscillator (YTO) translated by a fixed frequency Gunn diode oscillator (Gunn Osc). LPFs isolate the mixer from oscillator harmonics. The BPF passes the upper sideband from the mixer.
The method was applied to nitroxide spin labels in aqueous solution. The spectra are pure absorption in character if the sweep is sufficiently slow, but exhibit wiggles at more rapid sweeps. This class of experiments was previously explored in proton high-resolution NMR spectroscopy at much lower radio frequencies and longer relaxation times, where it was known as “correlation spectroscopy [4].” As technology improved, NMR correlation spectroscopy was replaced by pulse methods followed by Fourier transformation to produce spectra. In EPR, correlation spectroscopy was first reported by Stoner et al. using the so-called “trityl” radical, which has unusually long relaxation times [5]. They used magnetic field sweep across the single-line spectrum. The working hypothesis presented here is that microwave frequency sweep across the spectrum is an optimum experimental approach for many EPR experiments.
1.2. W-band bridge
The W-band bridge used in the experiments described here is shown in Fig. 3. This bridge was developed at the National Biomedical EPR Center and previously utilized in somewhat modified configurations in sinusoidal microwave frequency modulation (FM) and saturation recovery (SR) experiments [3,6]. The bridge incorporates multiple frequency translations to generate coherent W-band frequencies from a time-locked synthesizer array, but only the arms used in the experiments described here are shown in Fig. 3. The outputs of the two synthesizers—nominally, 2 and 3 GHz—are upconverted by mixing with the output of a 33 GHz Gunn diode oscillator [7] in the Q-band upconversion mixers to produce 35 and 36 GHz. The synthesizers have a common time base and are thermally stabilized so that they are coherent over the length of the experiment. The 35 GHz Q-band output is then upconverted by mixing with the output of a tunable V-band Gunn diode oscillator—nominally, 59 GHz—in the W-band upconversion mixer. The W-band arm output is directed toward the sample resonator through a high-directivity directional coupler (the “resonator coupler”).
Figure 3.
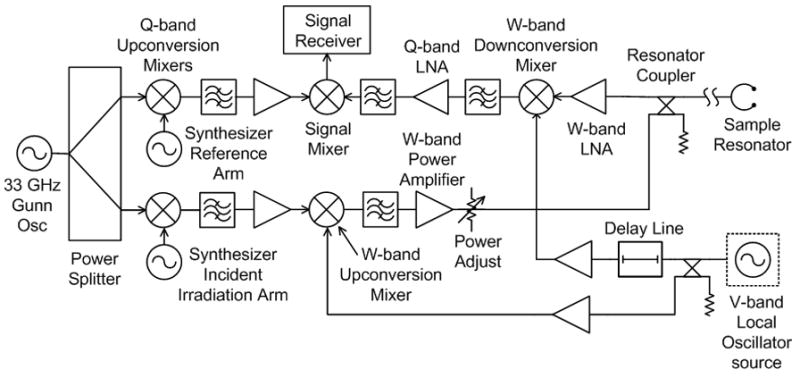
Frequency-swept W-band EPR bridge functional schematic. See Fig. 2 for components key. Nominally, the incident irradiation arm synthesizer is set to 2 GHz, and the reference arm synthesizer is set to 3 GHz. 33 GHz is upconverted to 35 GHz and then to 59 GHz. The EPR signal at 94 GHz is downconverted to 35 GHz and then to 1 GHz at the signal mixer output.
The microwave power reflected from the sample resonator in the vicinity of resonance can be determined from the reflection coefficient Γ:
| (1) |
where β is the coupling factor, Qu is the unloaded quality factor of the sample resonator (with sample; unloaded refers to “loading by the transmission line”), ωo is the resonant frequency, and Δω is the frequency deviation from resonance. In a conventional EPR experiment, Δω is nominally set to zero and maintained by an automatic frequency control (AFC) circuit. In a swept frequency experiment, Δω is swept from some nominal negative value, through resonance, to some nominal positive value. The direct implication is a frequency dependent offset to the baseline of a spectrum. The increase in the reflection coefficient can be appreciable at the extremes of a frequency sweep. For example, if a sample resonator with sample has Qu = 200 and a return loss of 35 dB (|Γ| = 0.0178) at a resonant frequency of 94 GHz, the return loss of the real part of the reflection coefficient at a 20 MHz offset from resonance is 34.1 dB while the return loss of the imaginary part of reflection coefficient is 27.4 dB. Baseline correction is implemented by subtracting the off-EPR resonance signal from the on-EPR resonance signal, as addressed later in this paper.
The EPR signal from the sample resonator is amplified in a W-band low-noise amplifier (LNA) and downconverted to 35 GHz in the W-band downconversion mixer by mixing with the same V-band source output that was utilized in upconversion. This approach ensures frequency coherent downconversion. Path length equalization between the W-band upconversion arm and the downconversion arm is accomplished with a delay line in the V-band local oscillator (LO) circuit. The EPR signal at Q-band is amplified in a Q-band LNA, downconverted to 1 GHz in the signal mixer (by mixing with 36 GHz), and sent to the signal receiver.
The EPR signal receiver is shown in Fig. 4. The EPR signal at 1 GHz is amplified and downconverted to baseband by mixing with the output of a 1 GHz synthesizer in the synthesizer array. The phase of the 1 GHz synthesizer, which also shares the same time base with the other synthesizers, is adjusted by the user to set absorption or dispersion. Following Eq. (1), maximum Γ corresponds to dispersion, and minimum Γ to absorption. The baseband EPR signal is amplified, filtered, and applied to the analog-to-digital (A/D) converter and averager card (Acqiris Agilent model AP240-Avgr). Further processing is completed in the computer. The A/D-averager is triggered by the generator that produces the waveform utilized in frequency-sweep experiments.
Figure 4.
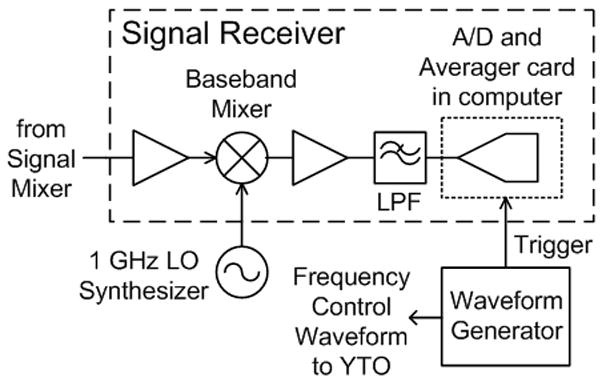
Signal receiver detail. The 1 GHz LO synthesizer phase is adjusted for absorption or dispersion. The waveform generator synchronizes data collection with the frequency sweep waveform.
1.3. V-band source
Frequency-sweep EPR experiments have been enabled by the development of a V-band frequency agile source. The source, detailed in Fig. 2, incorporates a YIG (yttrium-iron-garnet) tuned oscillator (YTO) and a fixed frequency Gunn diode oscillator. The YTO (Microlambda Wireless, Fremont, CA; model No. MLXS-1678RF) has exceptional frequency linearity relative to the varactor-tuned Gunn diode oscillator previously used in FM experiments [3]. The YTO output is upconverted to V-band by mixing with the 51 GHz Gunn diode oscillator output, filtered for the upper sideband, and amplified to a level sufficient to drive the W-band mixers in the W-band bridge. The isolators ensure that the oscillators, mixer, and amplifier are terminated in well-matched impedances. The low-pass filters ensure that oscillator harmonics are not injected into the mixer. The bandpass filter passes only the upper sideband from the mixer, the desired nominal frequency of 59 GHz. The YTO is utilized for nominal frequency adjustment in the bridge as well as for frequency sweeps. The 51 GHz Gunn diode oscillator is a scaled fixed-tuned version of a Q-band oscillator developed in this laboratory [8,9]. The Gunn diode (model No. MG1022-16) is from MDT, now Microsemi Corporation (Lowell, MA).
This V-band source has significantly reduced phase noise (over 20 dB) relative to the varactor-tuned oscillator previously reported [3,6]. The phase noise of the YTO is specified to be −130 dBc/Hz at 100 kHz offset. The phase noise of the Gunn diode oscillator is estimated to be −120 dBc/Hz at 100 kHz offset. This conservative estimate was obtained by scaling the phase noise performance of a 35 GHz Gunn diode oscillator to 51 GHz, and by accounting for skin effect, surface roughness effects of the stabilizing resonator, and increased Gunn diode noise factor at the higher operating frequency. Thus, the Gunn diode oscillator phase noise sets the phase noise floor.
In frequency-sweep EPR experiments, the output of the waveform generator (Fig. 4) is applied to driver electronics that control the microwave frequency of the YTO. This frequency control is described in the next section.
1.4. YTO as a frequency-agile source
The YTO is a frequency-tunable source utilized in modern microwave instrumentation such as phase-locked loop (PLL) synthesizers. It consists of a low-noise transistor oscillator circuit that utilizes a YIG sphere as the resonator and a magnetic circuit in which the YIG resonator is immersed. The oscillator is followed by a buffer amplifier. Frequency tuning is accomplished by changing the magnetic field in which the YIG resonator is immersed.
There are two main types of YTOs: electromagnet and permanent magnet. In the electromagnet YTO, there are two coils: one for the main magnetic field of the YIG resonator (the main coil) and one for rapid frequency tuning, sweeping, and modulation (the FM coil). The main coil, which has high inductance, establishes the magnetic field of the YIG resonator. It can tune the YTO over several GHz, 10 GHz or more, but slowly. The magnetic circuit cutoff frequency (about 5 kHz) fundamentally limits the frequency tuning rate. Furthermore, the electronic circuit that energizes this coil (the driver) is usually heavily filtered and, hence, of narrow bandwidth. Otherwise, circuit noise would frequency-modulate the YTO, and the phase noise performance would degrade. The frequency-sweep tuning rate can be as high as 100 MHz/ms. The tuning characteristic is fairly linear, typically less than 0.1% deviation from linear [10], and performs well within a PLL architecture. However, the residual nonlinearity and the hysteresis of the YTO magnetic circuit fundamentally limit the linearity of the free-running YTO tuning characteristic.
The FM coil has a lower inductance, which results in a higher frequency sweep rate and a significantly lower peak frequency deviation relative to the main coil. The FM coil is very small, quite close to the YIG resonator, and essentially in an air region of the magnetic circuit. Typical peak frequency deviation and highest FM rate are on the order of 40 MHz and 2 MHz, respectively. Residual nonlinearity in the magnetic circuit is usually minimal and not specified.
The second type of YTO is the permanent magnet YTO (PMYTO). The main coil magnetic circuit is replaced by a permanent magnet that sets the nominal microwave frequency of the YTO. Some models retain a main coil to provide some tuning range, a few GHz at most. Fixed-frequency models eliminate this coil. The FM coil is retained and can be modified to increase frequency deviation, but at the expense of frequency sweep rate.
It is interesting to compare frequency sweeps across a portion of an EPR spectrum using the FM coil of a YTO with large amplitude magnetization field sweeps using the field modulation coil that is mounted on an EPR cavity (see Ref. [5]). The YIG resonant frequency is fo(MHz) ≈ 2.8Ho(G), the gyromagnetic ratio of the electron, where Ho is the magnetic field intensity in the air gap that contains the YIG resonator in the YTO magnetic circuit. The field modulation coil is physically large and often driven on the order of 1 A to establish 10 G at the sample. The FM coil on the other hand is very small and quite close to the YIG resonator. A typical YTO FM coil frequency sensitivity is on the order of 400 kHz/mA, which scales to approximately 140 G peak for 1 A peak—more than an order of magnitude greater than for the EPR field-modulation coil. In addition, a deficiency of the method of large amplitude field sweeps is that variation of field-modulation homogeneity across the sample leads to spectral blurring. In contrast, the microwave frequency is strictly uniform across the sample. Although the RF amplitude can vary, spectral blurring does not result. Furthermore, high bandwidth electronic driver circuits and thermal management with coils in the 100 mA range are more readily achieved than in the 1 A range. Hence, frequency sweeps with a YTO have significant practical advantages over field sweeps with a modulation coil.
2. Results
2.1. EPR field-swept spectra
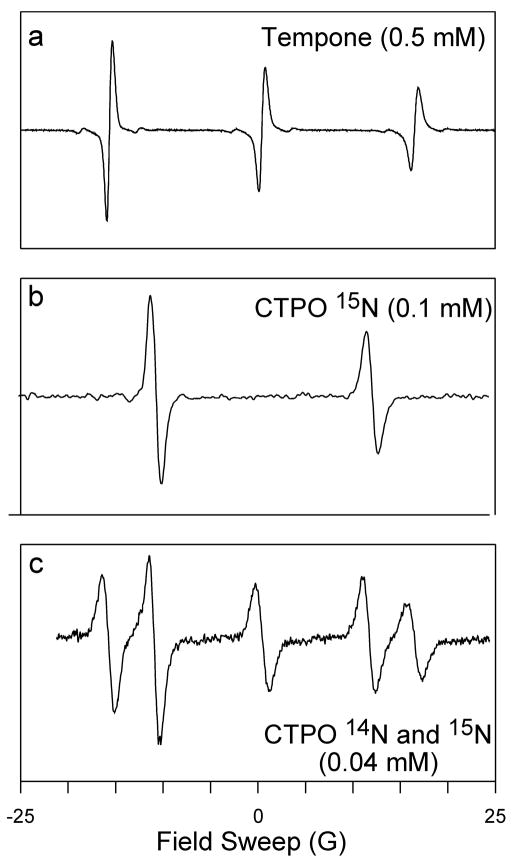
Figure 5 shows conventional field modulation W-band EPR spectra of the three samples used for the data reported here: 2,2,6,6,-tetramethyl-4-piperidone-1-oxyl (TEMPONE), 15N 3-carbamoyl-2,2,5,5-tetra-methyl-3-pyrroline-1-yloxyl (CTPO), and a 50%-50% mixture of 14N and 15N CTPO. All samples were aqueous, and all experiments were carried out at room temperature. All spectra in this paper were obtained using degassed samples [6] and 1 kHz magnetic field modulation to allow penetration of the field modulation into the solid Ag LGR that was used in these experiments [1]. The power level at the resonator was −10 dBm for these spectra. The receiver time constant was 50 ms for a and b, and 100 ms for c. Scan times were 0.69, 0.30, and 1.43 min for a, b, and c, respectively. Spectra a and c are single 50 G scans, and spectrum b is an average of 16 scans of 50 G.
Figure 5.
W-band room temperature spectra of aqueous samples used in this study. Detailed information on sample preparation and resonator configuration are given in Refs. [3,6].
For frequency-sweep experiments on single isotope samples, the low field line was observed because of its greater intensity except as noted. It was centered on the frequency-swept ramp. For the 14N-15N CTPO mixture, the center of the ramp was set midway between the two low field peaks. Natural abundance 13C peaks from rotating methyl groups are evident on either side of the low field EPR lines but are less apparent for other lines. Motional narrowing of anisotropic interactions is less complete at W-band for the high field lines of these small molecules, resulting in lines of greater width and reduced intensity. At X-band, it is difficult to distinguish high and low field signal heights. The spectra of Fig. 5 allow an estimate of the rotational correlation time, although that is not our purpose here.
2.2. Triangular frequency-swept experiment
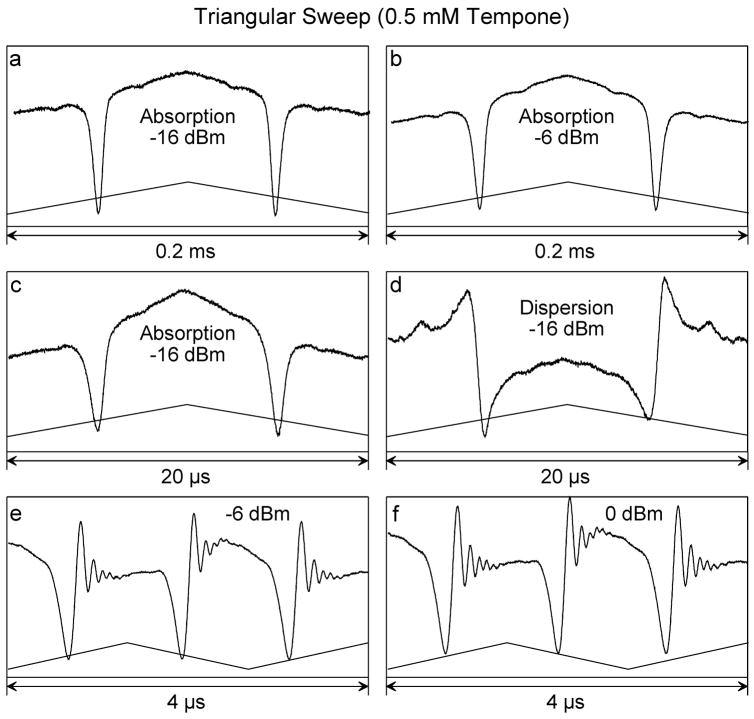
Figure 6 shows W-band frequency-sweep results with triangular waveforms. Results of a full wave sweep (up and back again) are shown in Figs. 6a–d and of a 1.5 wave sweep (up, back, and up again) in Figs. 6e and f. Full-cycle sweep rates of 5 kHz with 35 MHz deviation were used for Figs. 6a and b, of 50 kHz with 32 MHz deviation for Figs. 6c and d, and of 400 kHz with 25 MHz deviation for Figs. 6e and f. All data of Fig. 6 are the result of acquiring frequency-swept data on resonance that are subtracted from an equal number of 20 G offset acquisitions for improved baseline stability.
Figure 6.
Representative triangular-sweep spectral responses for 0.5 mM TEMPONE. Sweep profiles are indicated at the bottom of each display. Figures 6a and b used 5 kHz waveforms of 35 MHz frequency deviation centered on the low field line. Figures 6c and d used 50 kHz waveforms of 32 MHz deviation centered on the high field line, and Figs. 6e and f used 400 kHz waveforms of 25 MHz deviation centered on the low field line.
The experimental design is based on two ideas: elimination of the frequency-dependent reflection coefficient of the LGR as well as other components of the microwave circuit by subtraction of signals found on and off the magnetic resonance condition, and cancellation of the swept V-band frequency at the first downconversion mixer. Dispersion or absorption is selected by adjusting the phase of the 1 GHz local oscillator (Fig. 4). For this to be successful, the length of the V-band delay (Fig. 3) must be precisely set to preserve mode purity across the frequency sweep. The W-band EPR signal feeds through the LNA and then mixes with the frequency-swept V-band reference to arrive first at a stationary Q-band frequency. Further downconversion leads to a 1 GHz signal, which is detected.
Briefly, if the reference and signal incident on the W-band downconversion mixer are designated Arefcosωreft and Bsigcosωsigt, and A ≫ B, the output of the mixer is Bcos(ωsig − ωref)t. There is also a mixer product at cos(ωsig + ωref)t that is assumed to be filtered out. Here, the reference is the frequency-swept V-band signal, ArefcosωVt, and the signal is Bsig[(ωW(t)]cos[(ωQ + ωV)t + ϕsig{(ωW(t)}]. The mixer output is Bsig{ωW(t)cos[ωQt + ϕsig[ωW(t)]}, assuming that there is no differential phase shift between the V-band paths that feed the W-band upconversion and downconversion mixers (accomplished by the delay line in Fig. 3). The Bsig and ϕsig terms are functions of the instantaneous value of the W-band frequency during the frequency sweep. They could alternatively be expressed in terms of the complex value of the EPR signal and the resonator reflection coefficient. Since a rotating frame can be defined at Q-band, and also 1 GHz, absorption and dispersion can be detected.
Figures 6a and b show the absorption signal, with the only difference being that Fig. 6a was obtained at an incident power of −16 dBm and Fig. 6b at an incident power of −6 dBm. The linewidths are symmetrical and apparently little-changed comparing the data at the two incident powers. These are pure absorption spectra obtained by frequency sweep that are equivalent to the low frequency spectra seen by Stoner et al. [5] for the trityl radical at a very low microwave frequency of 250 MHz using magnetic field sweep.
Baseline subtraction was used to process the data of Fig. 6. A matched frequency-sweep data set was acquired about every second by stepping the current in the field modulation coils that surrounded the resonator. On- and off-resonance data sets were subtracted for baseline correction. A step of about 20 G was the maximum value that could be achieved with the hardware at hand.
There are a number of points to be made comparing Figs. 6a–f:
Figures 6a and b show imperfect baseline correction, with the signal-to-baseline ratio independent of incident power. Lineshapes were independent of power.
Figures 6c and d show the high field line of the spectrum rather than the low-field region usually observed in this study. The quality of absorption and dispersion spectra seem about the same. The lines show incipient FID effects, although the effects are small. Such effects could be seen more clearly on the high-field narrower line (data not shown).
The “early FID onset” regime seen in Figs. c and d does not seem to be advantageous because of apparent line broadening.
Figures 6e and f show wiggles that persist for about five or six cycles, about 0.6 μs. The oscillatory frequency seems to be increasing as the decay progresses. There is some indication that they persist into the beginning of the return of the triangular sweep.
Figures 6e and f were obtained at −6 dBm and 0 dBm, respectively. No significant difference in signal shapes were discerned. Figures 6a and b were obtained at −16 dBm and −6 dBm, respectively, and showed no significant difference in signal shapes. It is concluded that the shape of the response is insensitive to the microwave power over the range of incident powers used in this experiment (25 μW to 1 mW).
2.3. Trapezoidal frequency-sweep experiments
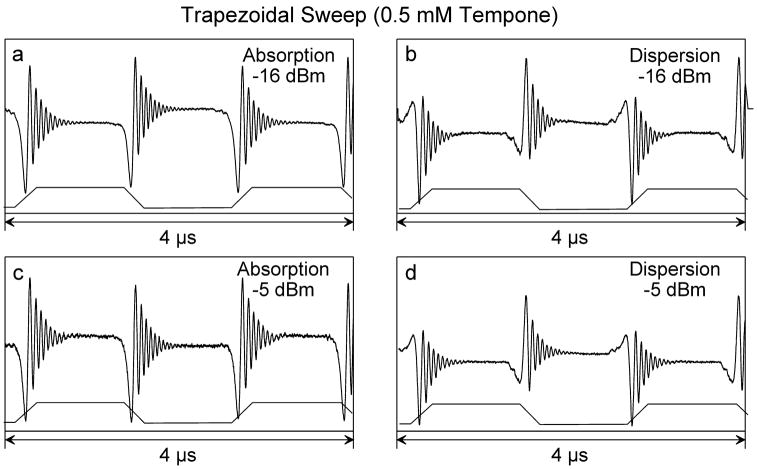
Figure 7 shows selected trapezoidal frequency-sweep experiments using 0.5 mM TEMPONE. The frequency-sweep waveform is shown in Fig. 1b and indicated qualitatively in each experiment of Fig. 7. The data indicate no spectral dependence of FID shapes on power.
Figure 7.
Representative trapezoidal sweep responses for 0.5 mM TEMPONE obtained from using the waveform shown in Fig. 1b centered on the low field line. Sweep rates are 0.176 MHz/ns (equivalent to 3.8 kT/s). Figures 7a and c as shown are double-baseline corrected as described in the text.
Comparing Figs. 6 and 7, the maximum sweep rate is 7 times greater using the trapezoid, while a 1 μs plateau is about right for observation of the T2 decay. The use of a trapezoidal sweep permits independent selection of the desired ramp sweep parameters and the desired plateau, which is not possible when using a triangular sweep. Furthermore, a rotating frame can be defined in the coordinate system of the precession of the spins during the plateau time. Precession of the magnetization is at a constant frequency in this coordinate system.
It is interesting to note that the pure absorption responses in Figs. 6 and 7 have the same initial sense both with ramp-up and ramp-down, whereas the dispersion signals have opposite responses.
An additional baseline correction strategy was introduced for the trapezoidal sweep spectra of Figs. 7a and c. After the data were collected, the main magnetic field was shifted by 50 G and the acquisition sequence repeated in its entirety to obtain a reliable baseline reference. The spectra of Figs. 7a and c were produced by subtraction of the baseline data from the EPR signal data. The improvement is notable, leading to the conclusion that the 20 G offset used to provide baseline improvement as the data are collected is inadequate.
2.4. CTPO frequency-sweep experiments
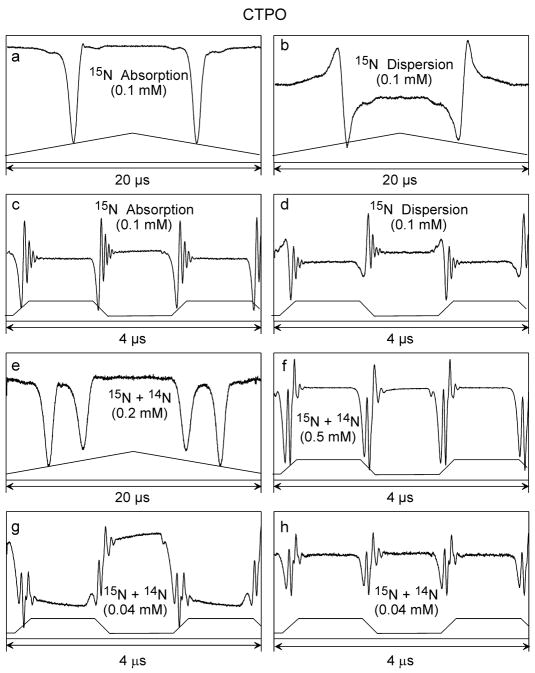
Results of the experiments on CTPO samples are shown in Fig. 8. Figures 8a and b were obtained at −10 dBm incident power, 50 kHz triangular sweep, and 44.7 MHz deviation on the 15N isotope. They can be compared with Figs. 6c and d from TEMPONE, noting that the latter displays were obtained using a 32 MHz deviation. It is apparent in both the frequency-swept experiments and the EPR spectra of Fig. 5 that the CTPO linewidths are somewhat greater. This molecule exhibits exquisite spectral resolution at X-band that shows evidence of internal molecular motions [11]. At W-band, this resolution is not observed.
Figure 8.
Representative swept-frequency responses for the CTPO samples. Figures 8a and b used 50 kHz triangular waveforms of 44.7 MHz deviation centered on the low field line. Figure 8e used 50 kHz triangular waveforms of 45.3 MHz deviation centered between the two low field lines of 14N + 15N CTPO. Figures 8c, d, f, g, and h used the trapezoidal waveform of 36.7 MHz deviation centered on the low field or between the two low field lines of the 14N + 15N CTPO. Sweep rates are 0.147 MHz/ns (equivalent to 3.2 kT/s). Figures 8c and h are double-baseline corrected.
Figures 8c and d show results from the 15N isotope using a trapezoidal 400 kHz sweep. The ramp was 0.25 μs duration and 36.7 MHz deviation. These displays can be compared with Figures 7c and d, which were at 44 MHz deviation. Here, the decay of the envelope of wiggles for CTPO is more rapid, indicating a shorter T2.
The EPR spectrum of a mixture of 14N- and 15N-CTPO is shown in Fig. 5c. Experiments reported here were designed to apply the methods established in the previous sections to sweeps of the microwave frequency across the two low field lines, one from each isotope. It was expected that the composite FIDs would allow determination of the spectral separation of these lines.
Figure 8e, with a 50 kHz triangular sweep at −10 dBm, looks very much like the pure absorption that would give rise to the derivative-like lineshape of Fig. 5c if field modulation were to be employed. Figure 8f clearly shows a more complicated decay arising from superposition of the magnetizations of both isotopes.
Figures 8g and h show absorption spectra from a low concentration sample (0.04 mM). The reference baseline strategy discussed above was applied to the data of Fig. 8g to produce 8h. It is apparent that the resolution is improved compared with Fig. 8f.
3. Discussion
3.1. Frequency-sweep rate
Prospects for enhancement of peak frequency deviation and frequency sweep rates in a YTO are primarily limited by the FM coil circuit inductance (turns, current, and magnetic field strength tradeoffs). Coils could be redesigned to increase frequency deviation, but then the frequency sweep rate would decrease. The coil driver-circuit bandwidth could be increased, but then the phase-noise performance degrades. One possible approach is to use multiple YTOs with each FM coil designed to reach just the desired peak frequency deviation in order to preserve frequency sweep rate. Likewise, the coil driver circuit could be designed to the peak deviation and frequency sweep rate. In short, engineering tradeoffs within YTO custom designs are possible, but a fundamental increase in high-speed frequency agility performance is not anticipated.
Other frequency-agile microwave sources exist. The varactor-tuned oscillator, for example, utilizes a variable capacitance diode to change the resonant frequency of the oscillator. The frequency-tuning characteristic is highly nonlinear and would necessitate frequency-correction measures (linearizer circuit) to achieve linear frequency sweeps. We utilized a varactor-tuned oscillator in W-band FM and SR EPR experiments [3,6]. The varactor can be modulated at a high rate, often 100 MHz. However, it suffers from frequency-tuning nonlinearity.
The V-band source reported here is superior to a varactor-tuned oscillator in this application. The YTO frequency-tuning characteristic is far more linear than that of the varactor-tuned oscillator. The Q of a varactor-tuned oscillator must be low (on the order of tens) if the varactor diode is to change the oscillator frequency significantly. This low Q degrades phase-noise performance of the oscillator. On the other hand, in the frequency-translation approach in Fig. 2, the frequency agility is now performed by the lower frequency YTO. The 51 GHz Gunn diode oscillator used to translate the 8 GHz (nominal) YTO is a fixed frequency source, with a much lower phase noise relative to a varactor-tuned Gunn diode oscillator. A key feature of the YTO is that the Q of its oscillator circuit is fairly independent of the microwave frequency. The combination of low phase-noise performance of modern YTOs and the low phase noise of the fixed-frequency Gunn diode oscillator results in a low phase-noise frequency-agile V-band source.
Recent advances in digitally based synthesized sources are promising. Arbitrary waveform generators (AWGs) numerically store a programmed waveform in memory and play it back through a D/A converter, often in a continuous loop. The AWG is especially useful for generating rapid frequency sweeps. Commercially available AWGs have reached 500 MHz with a linear frequency tuning speed of 3 MHz/ns. Software can be utilized to account for system nonlinearities through waveform predistortion.
AWGs currently have high performance and have bright prospects for higher performance as digital circuit technology continues to evolve. Higher frequency units with lower spurious content (via software correction) are expected. Software support and user interfaces continue to improve and become commercially available. AWGs clearly have a higher frequency accuracy relative to YTOs.
3.2. Slow wide-range frequency sweep
It is apparent that relatively slow sweep of the microwave frequency across the full nitroxide spectrum coupled with magnetic field offsets that are large enough to achieve baseline stability by subtraction is within reach. The pure absorption spectrum can be obtained with good sensitivity, which is a long sought goal. The YIG-based, frequency-sweep technology used in this paper appears adequate. It is possible that the same goal could be reached by combining a slow sweep of the magnetic field, coupled, as with frequency sweep, with sufficiently large magnetic field offsets to achieve baseline stability by subtraction. It is felt that it would be useful to explore this alternative technology, although homogeneity of the swept magnetic field over the sample, as well as induced eddy current and the accompanying Lorentz forces, may present difficult problems.
We have found that a combination of magnetic field and microwave frequency variation is necessary to achieve flat baselines in frequency-agile experiments. In the work presented here, variation of the resonator microwave reflection coefficient with frequency was a dominant problem, even though the bandwidth of the resonator was very high. It was found necessary to step the magnetic field off-resonance in order to measure the variation of the resonator reflection coefficient with microwave frequency, which then was subtracted from the on-resonance data. Other combinations of magnetic field and microwave frequency variation include sweep of the magnetic field while using sinusoidal frequency modulation [3] and sweep of the microwave frequency while using magnetic field modulation. Since the W-band LGR used here is made from solid silver with no modulation slots, we are limited to rather slow rates of magnetic field variation in order to minimize induced eddy currents and associated Lorentz forces.
3.3. Baseline correction
Baseline issues are significant because the reflected power from the resonator is larger with frequency sweeps than it is in a conventional EPR experiment where the frequency is set at the lowest reflection coefficient point of the sample resonator. Techniques employed for baseline improvement were described in section 2.2. A potential improvement in this technique would be to smooth the off-EPR line data set before subtracting it from the on-line data set. The off-line data sets typically showed no high frequency content other than noise; hence, smoothing reduces the high frequency noise that would otherwise be superimposed onto the on-line data and consequently improves the EPR signal quality.
Another potential improvement would be to implement a larger field modulation increment. The 20 G increment utilized with the modulation coils in these experiments was insufficient to shift off of the EPR line completely. The 50 G increment with the sweep coils of the magnet was utilized in some of the experiments as an additional technique to improve the baseline. We speculate that a larger field modulation increment may render the additional field shift with the magnet sweep coils unnecessary. Removal of the second off-line data collection would allow a larger fraction of on-line data collection time or reduced total collection time. More rapid on/off cycling may also improve the baseline. Another approach is to apply linear or quadratic detrending on the swept frequency spectra. These aspects require further investigation.
Automatic frequency control (AFC) was not utilized in the experiments reported here. If the time constant of the AFC system were set to be much longer than the frequency-sweep waveform period, the AFC would be expected to improve long-term stability. It is expected that the AFC loop gain would be reduced because of the large frequency deviation due to the frequency sweeps.
We have observed that the sample resonator match changes as the experiment progresses, probably due to small temperature changes. Remote automatic matching of the sample resonator would improve long-term baseline stability and allow longer averaging periods.
Balanced path lengths within the bridge in frequency-swept experiments are essential to preserving the phase setting of the bridge for absorption or dispersion. Otherwise, the relative phase of the EPR signal and the reference signal would change as a function of frequency within the frequency sweep, which would generate a changing absorption/dispersion admixture during the sweep.
3.4. High df/dt FT EPR spectroscopy, where f is the microwave frequency
Experiments described here at the highest microwave frequency-sweep rates where FID signals are observed are new in the context of EPR spectroscopy, but have been done before in NMR [4]. Twenty-fold higher sweep rates are available using AWG technology than can be achieved using YIG technology.
The magnetization tip angle, ϕ, in radians, can be estimated by defining an equivalent pulse duration, τ:
| (2) |
| (3) |
Here, H1 in the numerator is derived from the half-width of the Rabi transition probability [12,13], which contains, in the denominator a term of the form [(γH1)2 + (Δω)2], where Δω is the difference between the EPR line center and the irradiating frequency. We have:
| (4) |
Assuming that 1 W is available, that the resonator efficiency parameter, Λ, for the W-band LGR is 10 GW−1/2 as given by Sidabras et al. [1], and that the sweep rate is 3 MHz/ns,
| (5) |
which is close to a π/2 equivalent pulse. It seems within reach to tip the magnetizations of the entire spectrum of a nitroxide radical spin label in less than a tenth of a microsecond using less than a watt of microwave power. Measurements in the motionally narrowed regime as well as the very slow rotational diffusion regime will be possible. At intermediate rotational correlation times, “selection” of subsets of molecules at spectral locations where spectral diffusion is slow may be possible. Because FID rates are determined by the phase-memory time, separation of spectral components with differing phase-memory times may become a principal application of the methodology introduced here. As in NMR correlation spectroscopy, one could also apply the methodology to restricted spectral regions.
A distinguishing characteristic of the work described here is the use of a trapezoidal RF sweep waveform as shown in Fig. 1b. It consists of two characteristic time periods: the sweep period of 250 ns duration and the readout period of 1000 duration. The 44 Hz ramp was centered on the EPR transition of interest, and, thus, a free precession rate of 22 MHz is observed during the readout time (i.e., a period of 45 ns). This is the rate of precession in a rotating frame defined by the readout frequency, which is the W-band microwave frequency during readout. This frequency is translated first to a fixed frequency at Q-band and then to a fixed frequency at L-band, where detection to baseband occurs and 22 MHz oscillations are seen (Fig. 7). In the work of Refs. [4,5] the frequency or field continued to be swept during readout, and solutions of Bloch equations in this more complicated environment were required. The use of a trapezoidal RF sweep waveform with a readout time is analogous to FT NMR where a reference frequency incident on the detector establishes a rotating frame in which FID is observed. If the sweep is across multiple lines, FIDs are superimposed in both FT NMR and, in future work using an AWG, our experiment. Interpretation would be by FT in both cases, yielding frequencies that determine spectral positions of each line. The envelope would determine lineshapes.
In the experiment of Fig. 7, 125 ns was required to sweep from the irradiated line spectral frequency to the readout frequency, and during this time, the free precession rate increased from 0 to 22 MHz. The waveform during this period could, in principle, be modeled following the methodology of Refs. [4,5]. In this scenario, there would be no experimental dead time.
Introduction of trapezoidal frequency sweep with separate ramp and readout times appears to provide for EPR spectroscopy many of the benefits that pulse FT methodology provided for NMR spectroscopy. It also overcomes the enormous technical difficulties in formation of a microwave pulse that is sufficiently intense that the entire EPR spectrum is uniformly irradiated.
Acknowledgments
This work was supported by grants EB002052, EB001980, and EB001417 from the National Institutes of Health.
Footnotes
Publisher's Disclaimer: This is a PDF file of an unedited manuscript that has been accepted for publication. As a service to our customers we are providing this early version of the manuscript. The manuscript will undergo copyediting, typesetting, and review of the resulting proof before it is published in its final citable form. Please note that during the production process errors may be discovered which could affect the content, and all legal disclaimers that apply to the journal pertain.
References
- 1.Sidabras JW, Mett RR, Froncisz W, Camenisch TG, Anderson JR, Hyde JS. Multipurpose EPR loop-gap resonator and cylindrical TE011 cavity for aqueous samples at 94 GHz. Rev Sci Instrum. 2007;78:034701. doi: 10.1063/1.2709746. [DOI] [PubMed] [Google Scholar]
- 2.Weger M. Passage effects in paramagnetic resonance experiments. Bell System Tech J. 1960;39:1013–1112. [Google Scholar]
- 3.Hyde JS, Froncisz W, Sidabras JW, Camenisch TG, Anderson JR, Strangeway RA. Microwave frequency modulation in CW EPR at W-band using a loop-gap resonator. J Magn Reson. 2007;185:259–263. doi: 10.1016/j.jmr.2007.01.002. [DOI] [PubMed] [Google Scholar]
- 4.Dadok J, Sprecher RF. Correlation NMR spectroscopy. J Magn Reson. 1974;13:243–248. [Google Scholar]
- 5.Stoner JW, Szymanski D, Eaton SS, Quine RW, Rinard GA, Eaton GR. Direct-detected rapid-scan EPR at 250 MHz. J Magn Reson. 2004;170:127–135. doi: 10.1016/j.jmr.2004.06.008. [DOI] [PubMed] [Google Scholar]
- 6.Froncisz W, Camenisch TG, Ratke JJ, Anderson JR, Subczynski WK, Strangeway RA, Sidabras JW, Hyde JS. Saturation recovery EPR and ELDOR at W-band for spin labels. J Magn Reson. 2008;193:297–304. doi: 10.1016/j.jmr.2008.05.008. [DOI] [PMC free article] [PubMed] [Google Scholar]
- 7.Camenisch TG, Ratke JJ, Strangeway RA, Hyde JS. A versatile Q-band electron paramagnetic resonance spectrometer. IEEE (Electro/Information Technology Conference, 2004, EIT 2004); 2008. pp. 66–81. [Google Scholar]
- 8.Strangeway RA, Ishii TK, Hyde JS. Design and fabrication of a 35 GHz, 100 mW low phase noise Gunn diode oscillator. Microwave J. 1988:107–111. [Google Scholar]
- 9.Strangeway RA, Ishii TK, Hyde JS. Low-phase-noise Gunn diode oscillator design. IEEE Trans Microwave Theory Tech. 1988;36:792–794. [Google Scholar]
- 10.Bahl I, Bhartia P. Microwave Solid State Circuit Design. John Wiley & Songs; New York: 1988. [Google Scholar]
- 11.Hyde JS, Subczynski WK. Simulation of ESR spectra of the oxygen-sensitive spin-label probe CTPO. J Magn Reson. 1984;56:125–130. [Google Scholar]
- 12.Rabi II. Space quantization in a gyrating magnetic field. Phys Rev. 1937;51:652–654. [Google Scholar]
- 13.Hyde JS. Saturation of the magnetic resonance absorption in dilute inhomogeneously broadened systems. Phys Rev. 1960;119:1492–1495. [Google Scholar]


