Abstract
The endoribonuclease RNase E of Escherichia coli is an essential enzyme that plays a major role in all aspects of RNA metabolism. In contrast, its paralog, RNase G, seems to have more limited functions. It is involved in the maturation of the 5′ terminus of 16S rRNA, the processing of a few tRNAs, and the initiation of decay of a limited number of mRNAs but is not required for cell viability and cannot substitute for RNase E under normal physiological conditions. Here we show that neither the native nor N-terminal extended form of RNase G can restore the growth defect associated with either the rne-1 or rneΔ1018 alleles even when expressed at very high protein levels. In contrast, two distinct spontaneously derived single amino acid substitutions within the predicted RNase H domain of RNase G, generating the rng-219 and rng-248 alleles, result in complementation of the growth defect associated with various RNase E mutants, suggesting that this region of the two proteins may help distinguish their in vivo biological activities. Analysis of rneΔ1018/rng-219 and rneΔ1018/rng-248 double mutants has provided interesting insights into the distinct roles of RNase E and RNase G in mRNA decay and tRNA processing.
Keywords: mRNA decay, tRNA processing, rRNA maturation, chimeric proteins, cell viability
INTRODUCTION
Endoribonuclease E (RNase E) of Escherichia coli, encoded by the rne gene, is essential for cell viability and plays a major role in mRNA decay (Kuwano et al. 1977; Arraiano et al. 1988), rRNA maturation (Apirion and Lasser 1978; Li et al. 1999; Wachi et al. 1999), tRNA processing (Ray and Apirion 1981; Li and Deutscher 2002; Ow and Kushner 2002), and a variety of other aspects of RNA metabolism (Lundberg and Altman 1995; Lin-Chao et al. 1999; Masse et al. 2003). In contrast, RNase G, a protein that is 34% identical to the amino-terminal catalytic region of RNase E (amino acids 1–489) (Okada et al. 1994; Wachi et al. 1997), is not required for cell viability, is present in low abundance, and under normal physiological conditions cannot complement RNase E mutations (Wachi et al. 1997; Lee et al. 2002; Ow et al. 2003).
While both enzymes employ a 5′-end-dependent mechanism for degrading RNA molecules (Mackie 1998; Tock et al. 2000), in vivo they appear to have significantly different substrate specificities. For example, RNase E is required for the processing of many tRNA precursors (Li and Deutscher 2002; Ow and Kushner 2002), but in vivo most of these molecules are not effective substrates for RNase G (Ow et al. 2003; Deana and Belasco 2004). Furthermore, although both proteins are involved in generating the mature 5′ terminus of the 16S rRNA, they cleave the precursor at distinct sites (Li et al. 1999; Wachi et al. 1999).
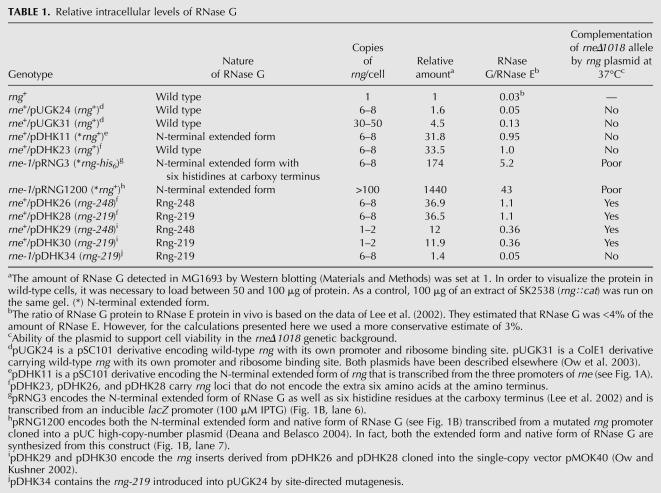
One of the important distinctions between the two ribonucleases is that there is ∼25-fold more RNase E than RNase G in E. coli on a molecule/molecule basis (Lee et al. 2002). Thus, it may not be surprising that increased expression (4.5-fold) (see Table 1) of the native RNase G protein, achieved by changing the copy number of the rng locus, did not lead to complementation of RNase E mutants (Wachi et al. 1997; Ow et al. 2003; Deana and Belasco 2004). However, much higher level expression (174–1440-fold) (see Table 1) of two different extended forms of RNase G did result in weak growth in various rne mutants (Lee et al. 2002; Deana and Belasco 2004; Tamura et al. 2006).
TABLE 1.
Relative intracellular levels of RNase G
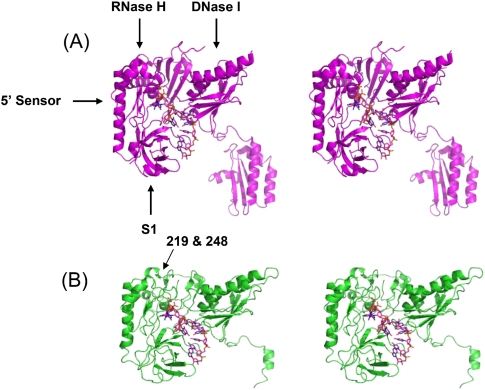
Although this approach represented a way to obtain limited complementation of the growth deficiency associated with the loss of RNase E activity, we wanted to investigate if RNase G could stably complement the absence of RNase E if it were expressed at intracellular levels that were comparable to how much RNase E was present (on a molecule/molecule basis) in wild-type cells. This experiment was of particular interest, since the computer-generated model for RNase G presented here predicts that the protein has a three-dimensional (3D) structure that is remarkably similar to that of RNase E (Fig. 4, see below). However, as described below a >30-fold increase in the intracellular level of either the native or the N-terminal extended form of RNase G, which led to protein levels comparable to those of RNase E in wild-type cells, did not complement either the rne-1 or rneΔ1018 allele. In contrast, spontaneously arising single amino acid substitutions within the predicted RNase H domain of RNase G (rng-219 and rng-248) led to proteins that complemented the growth defect associated with rne mutations when expressed at levels that were less than or equal to how much RNase E is present in wild-type E. coli. However, rne deletion mutants growing in the presence of either altered RNase G protein still exhibited significant defects in the decay of some mRNAs and the processing of tRNA precursors, while 9S rRNA maturation took place at almost wild-type levels.
FIGURE 4.
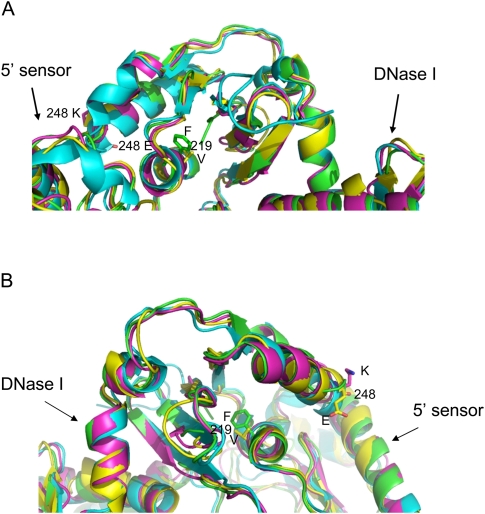
Stereo views of the crystal structure of the catalytic domain of E. coli RNase E and the predicted structure of its homolog RNase G. (A) The 3D ribbon structure of the catalytic domain of RNase E is based on the coordinates published by Callaghan et al. (2005). (B) The predicted structure of E. coli RNase G bound to RNA as described in Materials and Methods. The RNA is shown in stick representation. Figures are prepared in PyMOL. The S1, 5′ sensor, RNase H, and DNase I subdomains are indicated as well as the approximate locations of the rng-219 and rng-248 alleles.
RESULTS
Overexpression of either the wild-type (489 amino acids) or the extended form (495 amino acids) of RNase G does not complement rne mutants
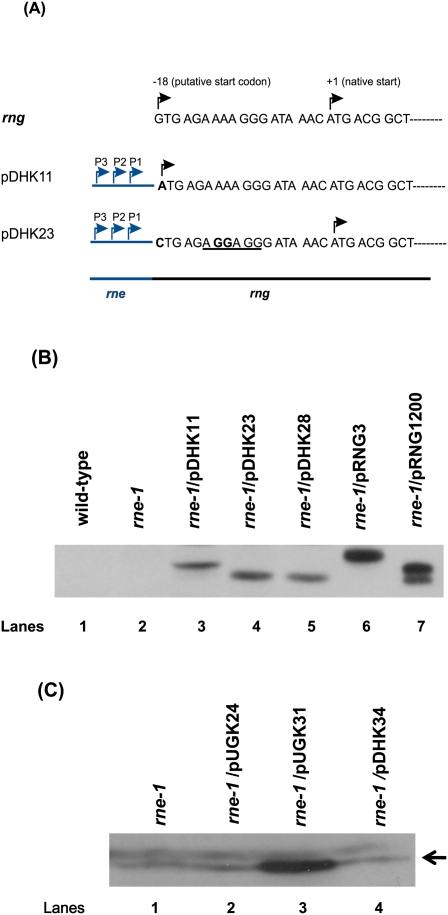
In order to obtain levels of RNase G that were comparable to RNase E without using an inducible promoter, we replaced the rng regulatory region with the three promoters and ribosome binding site derived from RNase E (Ow et al. 2002). To ensure that only the native form of RNase G (489 amino acids) was synthesized, we changed the potential upstream translation start codon (GUG) to CUG, and a canonical ribosome binding site was inserted 7 nucleotides (nt) upstream of the AUG start codon (Fig. 1A, pDHK23). In addition, in order to try and reproduce the results of Lee et al. (2002) and Deana and Belasco (2004), we changed the upstream GUG codon to AUG to promote translation of the extended form of RNase G (495 amino acids) (Fig. 1A, pDHK11). Both plasmids led to at least a ∼30-fold increase in the level of the RNase G protein (Fig. 1B, lanes 3,4; Table 1). The protein produced by pDHK11 had a higher molecular weight, as expected (Fig. 1B, lane 3).
FIGURE 1.
(A) Diagrammatic representation of the rng constructs in pDHK11 and pDHK23. The chromosomal rng sequence is shown at the top. The native translation start, identified by sequencing of the protein purified from E. coli (Briant et al. 2003) is shown as +1. The translation start site employed by Lee et al. (2002) and Deana and Belasco (2004) is indicated as −18. The upstream regulatory region of RNase E (shown to the left in blue), including its three promoters, as identified by Ow et al. (2002), was used to express rng in both pDHK11 and pDHK23. In pDHK11, the GTG translation start codon was changed to ATG and the RNase E ribosome binding site was inserted to increase translation efficiency. In pDHK23, the upstream GTG codon was changed to CTG to block potential translation initiation and a canonical ribosome binding site (underlined) was inserted 7 nt upstream of the RNase G native translation start codon (ATG). Altered nucleotides are shown in boldface. Rightward black arrows indicate translation start codons for the two constructs. Rightward blue arrows indicate the transcription start sites associated with the three RNase E promoters. (B) Western blot analysis of RNase G in various strains using 40 μg (lanes 1–5), 20 μg (lane 6), or 2 μg (lane 7) of total cell protein. Lane 1, MG1693; lane 2, SK6610; lane 3, SK3475; lane 4, SK3500; lane 5, SK3540; lane 6, SK5065; and lane 7, SK5067. pDHK11, pRNG3, and pRNG1200 encode an RNase G protein that contains an extra six amino acids at the amino terminus (Fig. 1A). Based on the construction of pRNG1200 (Deana and Belasco 2004), both the native and extended form of the protein will be synthesized (lane 7). pRNG3 (Lee et al. 2002) encodes the extended form of RNase G along with six histidine residues at the carboxy terminus (lane 6). (C) Western blot analysis of RNase G in various strains using 100 μg of total cell protein. Lane 1, SK6610; lane 2, SK2585; lane 3, SK2594; and lane 4, SK3559. The leftward arrow indicates RNase G. The relative quantities (RQ) of RNase G shown in Figure 1B,C are reported in Table 1.
It has previously been shown that approximately one temperature-resistant revertant of SK6610 (rne-1 recA56) was obtained for every 108 cells plated (Perwez et al. 2008). These colonies grew when restreaked at 44°C and were shown to contain intragenic second-site suppressor mutations (Perwez et al. 2008). In contrast, the presence of either pDHK11 or pDHK23 in SK6610 led to a >200-fold increase in the frequency of temperature-resistant survivors in a similar experiment. However, these isolates did not grow when restreaked directly at 44°C, showing that there was not stable complementation of the growth defect.
To further confirm that neither pDHK11 (Kmr) nor pDHK23 (Kmr) could stably complement the loss of RNase E activity, we attempted to use these plasmids to displace a plasmid carrying the wild-type rne gene [pSBK1 (rne+ Cmr)] from an rneΔ1018 deletion strain (SK9714) (Ow et al. 2000), since all three plasmids carried the same origin of DNA replication (pSC101). However, after growing Kmr transformants obtained with either pDHK11 or pDHK23 for more than 200 generations in the absence of Cm selection, no Kmr Cms transformants were detected among the many thousands of colonies tested (data not shown).
Two independent single amino acid changes in RNase G lead to stable complementation of RNase E mutants
In order to isolate spontaneously arising RNase G mutants that could complement a complete rne deletion (rneΔ1018) (Ow et al. 2000), we took advantage of the fact that a rneΔ610 truncation allele supports cell viability in the rneΔ1018 genetic background at 37°C but not at 44°C (Ow et al. 2000). Thus, in an rneΔ1018 strain carrying both the rneΔ610 (Cmr) and mutant rng+ (Kmr) alleles on separate plasmids with identical origins of DNA replication, plasmid incompatibility should lead to Kmr Cms survivors at 44°C that contained only mutated rng genes that could support cell viability.
Accordingly, we transformed a rneΔ1018∷bla/pMOK15(rneΔ610) Cmr strain (SK9957) with pDHK23 (rng+ Kmr) (Fig. 1A) (both pMOK15 and pDHK23 contain the same pSC101 origin of DNA replication) and selected for Kmr Cmr transformants at 37°C. These transformants were then grown for several hundred generations at 44°C in the presence of only Km. Subsequently, when 1000 individual colonies were tested, ∼150 were Kmr and Cms. Significantly, these temperature-resistant survivors grew when restreaked at 44°C. In addition, plasmid DNA isolated from six independent isolates displaced pSBK1 (rne+) from an rneΔ1018 deletion strain (SK9714) at either 30°C or 37°C and complemented the temperature-sensitive growth associated with the rne-1 allele in SK6610 (rne-1 recA56) at 44°C.
Sequencing of the rng insert, including the rne promoter region, from six independent plasmid isolates identified two distinct mutations in pDHK23. Two of the plasmids (one of which was named pDHK28) had a G→T transversion mutation in the rng coding sequence at the first base pair of the codon for amino acid 219, resulting in a Val to Phe substitution (rng-219). Four plasmids (one of which was named pDHK26) had a G→A transition at the first base pair of the codon for amino acid 248, causing a Glu to Lys substitution (rng-248). In the RNase E protein, the amino acids at these two corresponding positions are Ala and Leu, respectively.
To confirm that the observed complementation resulted from these specific amino acid substitutions, we generated pDHK32 (rng-219) and pDHK33 (rng-248) using site-directed mutagenesis of pDHK23. Both of these plasmids behaved identically to the original plasmids (pDHK26) and (pDHK28) with regard to their ability to complement both the rne-1 and rneΔ1018 alleles and to restore normal 16S rRNA processing in an rng∷cat genetic background (data not shown).
Complementation of the growth defect associated with RNase E-deficient strains is dependent on the intracellular level of the Rng-219 and Rng-248 proteins
Although we did not obtain complementation of rne mutants by overexpressing either the wild-type or N-terminal extended form of RNase G, we wanted to rule out that the growth observed in an rneΔ1018 strain carrying either the rng-219 or the rng-248 allele did not simply result from a further increase in the expression of the mutant RNase G proteins compared with what was obtained with pDHK23 (rng+). Western blot analysis demonstrated that cells carrying pDHK23 (rng+), pDHK26 (rng-248), or pDHK28 (rng-219) produced comparable levels of RNase G protein (Fig. 1B, lanes 4,5; Table 1).
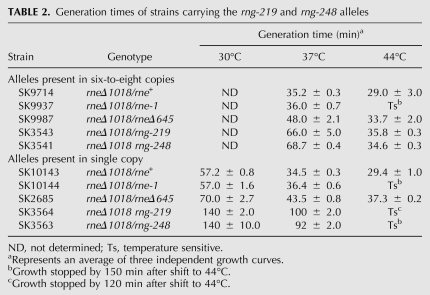
We next compared the growth properties of strains carrying the rng-219 or rng-248 alleles on either six-to-eight copy (pDHK26 and pDHK28) or single-copy (pDHK29 and pDHK30) number plasmids (Table 2). As a control in these experiments, a strain with the rneΔ645 allele was included because this truncated RNase E protein supports cell viability at 30°C, 37°C, and 44°C (Ow and Kushner 2002). Although strains containing six-to-eight copies of either the rng-248 (SK3541) or rng-219 (SK3543) mutations grew significantly slower at 37°C than strains carrying either the rne+, rne-1, or the rneΔ645 alleles, the generation times of the rne+, rneΔ645, rng-219, and rng-248 strains were comparable at 44°C (Table 2). Even though all these strains contained an rng+ allele on the chromosome, it should be noted that comparable complementation and generation times were obtained when pDHK28 was introduced into an rneΔ1018 rng∷cat double mutant (data not shown).
TABLE 2.
Generation times of strains carrying the rng-219 and rng-248 alleles
With the rng-219 and rng-248 alleles on single-copy plasmids, Western blot analysis showed 3.1-fold less RNase G protein compared with respective plasmids present in six-to-eight copies/cell (Table 1). Under these conditions, the rng-219 and rng-248 alleles still supported cell viability in the rneΔ1018 genetic background at 30°C and 37°C, but the mutants had significantly longer generation times compared with strains carrying the rne+, rne-1, and rneΔ645 alleles (Table 2). In addition, the rng-219 and rng-248 strains ceased growing after shift to 44°C (Table 2). In fact, the rng-219 strain displayed a more rapid cessation of growth than either the rne-1 or rng-248 strains (data not shown).
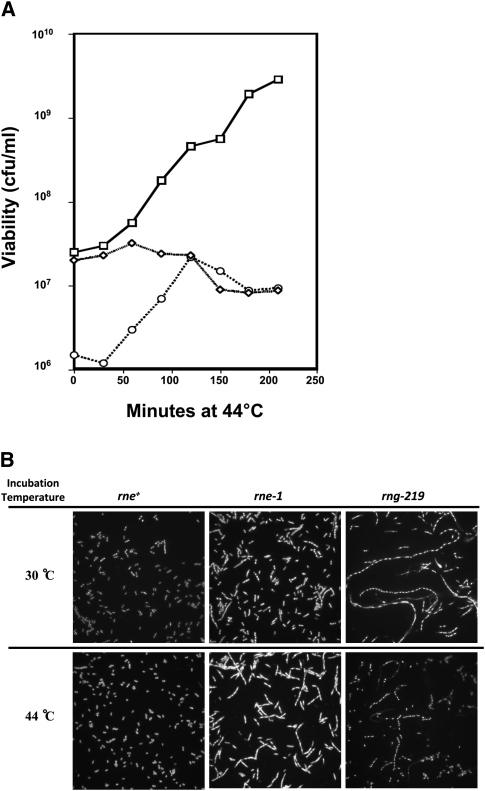
Analysis of cell viability showed reproducible differences between the rneΔ1018/rne-1 and rneΔ1018/rng-219 strains (Fig. 2A). In cultures of the rneΔ1018/rng-219 mutant grown at 30°C less than 20% of the cells formed viable colonies at 30°C compared with rne-1 and wild-type strains (Fig. 2A). In fact, when observed under the light microscope, these cultures contained many extremely long multinucleated cells (Fig. 2B). Furthermore, there was actually a 10-fold increase in cell viability in the rneΔ1018/rng-219 strain for the first 120 min after the temperature shift (Fig. 2A), accompanied by a significant decrease in the number of elongated cells (Fig. 2B). In contrast, cell viability of the rneΔ1018/rne-1 strain remained largely unchanged after shift to 44°C followed by a gradual decrease after 60 min. It should be noted that elongated cells appeared in the rne-1 strain as had previously be noted by Tamura et al. (2006), but the rng-219 cells appeared smaller in diameter and were more extensively elongated (Fig. 2B).
FIGURE 2.
Measurement of cell viability and cellular morphology in strains carrying single copies of the rne+ (SK10143), rne-1 (SK10144), and rng-219 (SK3564) alleles in an rneΔ1018 deletion background. (A) Cell viability of rne+ (□), rne-1 (⋄), and rng-219 (○) was determined as described in Materials and Methods. (B) The 30°C cultures were harvested at mid-log phase (1 × 10⁸ cells/mL), while the 44°C cultures were harvested 2 h after the temperature shift. Slides were prepared as described in Materials and Methods.
To provide further support for the hypothesis that the complementation of the rne deletion was dependent on the cellular level of the mutant RNase G proteins, we introduced the rng-219 and rng-248 alleles into the rng gene (expressed from its own promoter and ribosome binding site) carried on the six-to-eight copy number plasmid pUGK24 (Ow et al. 2003) via site-directed mutagenesis, generating pDHK34 and pDHK35, respectively. Based on Western blot analysis, comparable levels of RNase G were observed with pUGK24 and pDHK34 (Fig. 1C), but these levels represented an approximately sevenfold less RNase G protein compared with the expression from pDHK29 or pDHK30 (Table 1). Furthermore, unlike what was observed with the plasmids pDHK29 and pDHK30, neither pDHK34 nor pDHK35 displaced pSBK1 (rne+) from SK9714 at either 30°C or 37°C (Table 1) nor complemented an rne-1 mutant at 44°C (data not shown).
pRNG3 and pRNG1200 produce significantly more RNase G protein than either pDHK28 (rng-219) or pDHK26 (rng-248) but support very poor growth in the rne-1 genetic background
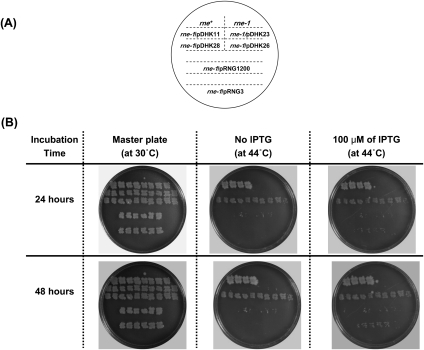
The results described above differed from those of Lee et al. (2002) and Deana and Belasco (2004), who observed growth of RNase E mutants after overexpression of a modified form of RNase G. Accordingly, we transformed pRNG3, which expresses an amino-terminal extended form of RNase G that also has six additional histidines at the carboxy terminus from a lacZ promoter in a plasmid with a pSC101 origin of DNA replication (Lee et al. 2002), pRNG1200, which expresses an amino-terminal extended form of RNase G from a modified RNase G promoter in a pUC plasmid (Deana and Belasco 2004), pDHK11 (rng extended form), pDHK23 (rng wild-type), pDHK28 (rng-219), and pDHK26 (rng-248) into the same genetic background (SK6610, rne-1 recA56) in order to compare their ability to support growth at 44°C (Fig. 3).
FIGURE 3.
Comparison of the growth properties of an rne-1 strain carrying various rng plasmids. Individual colonies of the various strains as indicated in A were patched onto a Luria agar master plate and grown overnight at 30°C (B). Replicas were made and incubated for either 24 or 48 h at 44°C (B).
As shown in Figure 3B, after 24 h at 44°C there was no growth in the rne-1 control or rne-1 transformants carrying either pDHK11 or pDHK23. In strains carrying either rng-219 (pDHK28) or rng-248 (pDHK26) allele uniform growth was obtained (Fig. 3B). In contrast, very spotty growth was observed with both pRNG1200 and pRNG3 in the presence of 100 μM IPTG. After 48 h at 44°C some additional spotty growth was observed with pRNG3, but it was still much less than obtained with either pDHK28 (rng-219) or pDHK26 (rng-248) (Fig. 3B). No further improvement was observed with pRNG1200 after 48 h (Fig. 3B).
Western analysis of RNase G protein levels in the various strains showed that the rne-1/pDHK11, rne-1/pDHK23, and rne-1/pDHK28 strains had comparable levels of RNase G protein (Fig. 1B; Table 1). In contrast, the total amount of protein loaded from rne-1/pRNG3 (in the presence of 100 μM IPTG) and the rne-1/pRNG1200 strains had to be reduced two- and 20-fold, respectively, to avoid overloading the gel (Fig. 1B). Taken together, the data in Figure 1B and Table 1 indicated that there was 174- and 1440-fold more RNase G, respectively, in the pRNG3- and pRNG1200-containing strains compared with the level of protein found in a wild-type cell.
Both amino acid changes are located within the predicted RNase H domain of RNase G
The solution of the crystal structure of the catalytic region of RNase E identified five distinguishable subdomains within the catalytic portion of the protein (5′ sensor, S1 RNA binding region, RNase H and DNase I domains and a Zn-link) (Callaghan et al. 2005). Based on the overall 34.1% sequence identity between RNase G and RNase E proteins within the catalytic region, we used Geno 3D (http://geno3d-pbil-ibcp.fr), an online homology modeling program (Combet et al. 2002) to predict the 3D structure for RNase G (Fig. 4B). This analysis showed that RNase G can be folded, with a high degree of certainty, into the same five distinctive subdomains as RNase E (Fig. 4A). Of the five subdomains, the predicted catalytic site contained within the DNase I domain was the most structurally conserved region (45.5% sequence identity), while the RNase H region showed the most divergence (26.6% sequence identity) (Fig. 4A,B). Interestingly, both the rng-219 and rng-248 mutations occurred in the predicted RNase H domain. Detailed analysis of the mutationally altered RNase H domains showed very subtle changes in the side chains extending from two distinct α-helices associated with the RNase H domain in the two RNase G mutants (Fig. 5A,B). Since the mutations lie close to the 5′ sensor domain, it is possible that they lead to a modification of its activity.
FIGURE 5.
Expanded view of the RNase H subdomain of the RNase E, RNase G, Rng-219, and Rng-248 proteins. The structures were prepared as described in Materials and Methods and are viewed in PyMOL. The adjacent 5′ sensor and DNase I subdomains are indicated. (A) Top view. (B) Bottom view. Cyan, RNase E; yellow, model of RNase G; green, model of Rng-219; and magenta, model of Rng-248.
Domain swaps between RNase E and RNase G generate proteins that do not complement RNase E deficiency
Based on the high degree of predicted structural similarity between RNase E and RNase G (Fig. 4), we hypothesized that a domain swapping approach, as successfully used with poly(A) polymerase and tRNA nucleotidyltransferase (Betat et al. 2004), might help distinguish important features of these two paralogs. To test this idea directly, we made three chimeric constructs: amino acids 213–281 of the RNase H domain in RNase G were replaced with the same region derived from RNase E; amino acids 1–280 of RNase G were replaced by the S1 binding region, 5′ sensor region and the entire RNase H domain from RNase E; and amino acids 280–489 of RNase G were replaced with the DNase I domain and Zn-link from RNase E (amino acids 280–418). While all three chimeric proteins were expressed at levels comparable to those observed with pDHK26 and pDHK28 (data not shown), none of them complemented either the rne-1 or rneΔ1018 alleles, improved the maturation of 5S rRNA, or converted the 16.3S rRNA precursor observed in an rng∷cat mutant into its mature 16S form (data not shown).
The Rng-219 and Rng-248 proteins effectively restore 9S rRNA processing at 44°C
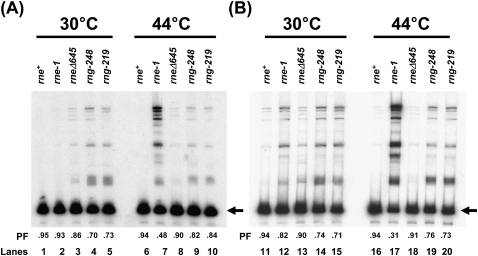
RNase E was initially discovered based on its role in the maturation of the 9S rRNA precursor into a functional 5S rRNA (Apirion and Lasser 1978). Subsequent analysis of this reaction showed that while rne-1 mutants were quite defective in 9S rRNA maturation (Ow et al. 2000), truncated RNase E proteins cleaved this substrate quite efficiently (Lopez et al. 1999; Ow et al. 2000). Furthermore, increased levels of wild-type RNase G partially restored 9S rRNA maturation in an rne-1 mutant at 44°C (Ow et al. 2003). We observed that in strains carrying the various rne and rng alleles in six-to-eight copies/cell, the processed fractions ([PFs], defined as the fraction of mature 5S rRNA relative to all 5S rRNA containing species) of 5S rRNA at 30°C were nearly identical in the wild-type, rne-1, and rneΔ645 strains (Fig. 6A, lanes 1–3) in agreement with previous results (Ow and Kushner 2002). However, the PF was reduced to ∼0.70 in the rng-219 and rng-248 mutants (Fig. 6A, lanes 4,5). Upon shift to 44°C, the PF in the rne-1 strain decreased to 0.48 (Fig. 6A, lane 7), while the PF in the rng-248 and rng-219 alleles increased to 0.82 and 0.84 (Fig. 6A, lanes 9,10), respectively.
FIGURE 6.
Analysis of 9S rRNA processing. Equivalent amounts (5 μg) of total steady-state RNA extracted from cultures that either had been grown at 30°C or had been shifted to 44°C for 120 min, as described in Materials and Methods, were separated in a 6% polyacrylamide/7 M urea gel and electroblotted onto a Biotrans+ membrane. The membrane was probed with 32P-end–labeled oligonucleotide complementary to the mature 5S rRNA (PB5S; Babitzke and Kushner 1991). The left arrows indicate the mature 5S rRNA. (A) rne and rng alleles present in six-to-eight copies/cell. SK9714 (rne+), SK9937 (rne-1), SK9987 (rneΔ645), SK3541 (rng-248), and SK3543 (rng-219). (B) rne and rng alleles present in single copy/cell. SK10143 (rne+), SK10144 (rne-1), SK2685 (rneΔ645), SK3563 (rng-248), and SK3564 (rng-219). PF denotes the processed fraction, which is defined as the amount of mature 5S rRNA divided by the total amount of the 5S rRNA (processed and unprocessed).
When the experiment was performed with strains carrying either the rng-219 or rng-248 alleles in single copy, 9S rRNA maturation in the two rng mutants was comparable at both 30°C and 44°C (Fig. 6B, lanes 14,15,19,20), even though the cells ceased growing at the elevated temperature. Interestingly, the PFs of the two rng mutants were more than twofold higher compared with what was observed with the rne-1 strain at 44°C (Fig. 6B, lanes 17,19,20). In all cases, the pattern of processing intermediates obtained in the rne-1, rng-219 and rng-248 strains was nearly identical (Fig. 6A,B) and generally agreed with the results of Lee et al. (2002).
The absence of RNase E differentially affects the decay of specific mRNAs
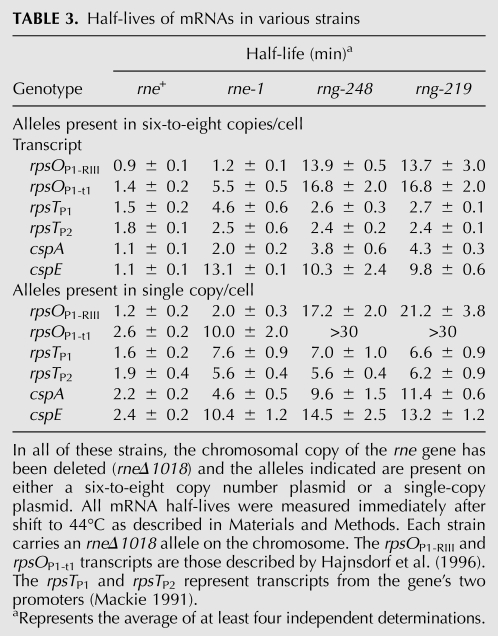
Although experiments using various rne alleles (i.e., rne-1, rne-131, rneΔ610, and rneΔ645) have shown that the decay of specific mRNAs is initiated by RNase E (Mackie 1991; Hajnsdorf and Regnier 1999; Ow et al. 2000; Celesnik et al. 2007), recent work has suggested that both RNase G and RNase Z can also participate in the decay of selected transcripts (Umitsuki et al. 2001; Wachi et al. 2001; Kaga et al. 2002; Lee et al. 2002; Ow et al. 2003; Perwez and Kushner 2006). In addition, rne-1 strains retain a significant amount of residual RNase E activity at 44oC (Mohanty and Kushner 2008). Thus, the rneΔ1018/rng-219 and rneΔ1018/rng-248 strains provided a means to test if the initiation of endonucleolytic decay of specific mRNAs was absolutely dependent on the presence of RNase E. For our analysis, we determined the half-lives of four mRNAs previously demonstrated to decay in an RNase E-dependent fashion (rpsO, rpsT, cspA, and cspE) (Mackie 1991; Hajnsdorf et al. 1994; Perwez and Kushner 2006; Hankins et al. 2007). In agreement with previously published results (Ow et al. 2000, 2003), the half-lives of all four transcripts were significantly longer in the rneΔ1018/rne-1 strain when the rne-1 allele was present in either six-to-eight copies/cell or single copy/cell (Table 3).
TABLE 3.
Half-lives of mRNAs in various strains
Strikingly different results were obtained for the four mRNAs in strains carrying the rng-219 and rng-248 alleles in six-to-eight copies/cell. The half-lives of the rpsO and cspA transcripts increased dramatically between two- and 12-fold compared with the rne-1 strain and were directly correlated to the amount of altered RNase G protein present in the cell (Table 3). These results showed that both the rpsO and cspA transcripts were highly dependent on RNase E for their decay and were not efficiently cleaved by either mutant RNase G protein. However, in the rneΔ1018/rng-219 and rneΔ1018/rng-248 mutants numerous decay intermediates of cspA were present that were not observed in the rneΔ1018/rne-1 strain (data not shown). It should be noted that the half-life of the cspA mRNA obtained here in wild-type E. coli (1–2 min) (Table 3) was significantly longer than has been reported previously (Goldenberg et al. 1996; Hankins et al. 2007).
In contrast with what was observed with rpsO and cspA, the rpsT and cspE mRNAs had comparable half-lives in the rne-1, rng-219, and rng-248 strains when the alleles were present either in single copy/cell or six-to-eight copies/cell (Table 3). For example, the half-life of the rpsTP1 transcript in the rneΔ1018/rng-219 and rneΔ1018/rng-248 strains was 2.6 and 2.7 min, respectively, when the alleles were present in either six-to-eight copies/cell compared with 8.9 min, which was observed in an rne-1 rng∷cat double mutant (Ow et al. 2003). This result indicated that both mutant RNase G proteins were able to substitute, relatively effectively, for RNase E at least in the initiation of the decay of the full-length mRNA. This idea was supported by the presence of major new rpsT decay intermediates in the rng-219 and rng-248 strains that were not present in either wild-type or rne-1 strains (data not shown). Even when the rng-219 and rng-248 alleles were present in single copy, the rpsTP1 transcript half-life (between 6 and 7 min) (Table 3) was still shorter than that observed in the rne-1 rng∷cat double mutant (Ow et al. 2003).
The maturation of tRNACys, tRNAHis, and tRNAPro but not tRNAAsn is completely dependent on RNase E
RNase E is critical for the initial processing of many tRNA precursors in E. coli (Ray and Apirion 1981; Li and Deutscher 2002; Ow and Kushner 2002). In fact, the essential function of RNase E was suggested to involve its role in the initiation of tRNA maturation (Li and Deutscher 2002; Ow and Kushner 2002; Perwez et al. 2008), although Deana and Belasco (2004) have challenged this hypothesis. However, all the published experiments examining the role of RNase E in tRNA maturation have been carried out using strains that either contained some RNase E activity (rneΔ610, rneΔ645, or rne under the control of a lac promoter) or retained residual activity at the nonpermissive temperature (rne-1 and rne-3071) (Mohanty and Kushner 2008). Since the rneΔ1018/rng-219 and rneΔ1018/rng-248 mutants contained no RNase E activity, we compared the processing of four selected tRNA species (tRNAHis, tRNAPro, tRNACys, and tRNAAsn). As an internal control we included the rneΔ645 allele, since this truncated RNase E protein supports cell viability at both 30°C and 44°C (Ow and Kushner 2002). tRNAHis, tRNACys, and tRNAPro were chosen because their maturation is highly dependent on RNase E (Li and Deutscher 2002; Ow and Kushner 2002). In contrast, tRNAAsn was included because each of its four precursors appeared to be processed relatively efficiently in rne-1 mutants (Ow and Kushner 2002).
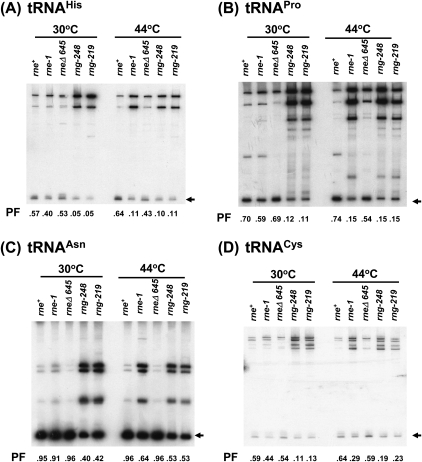
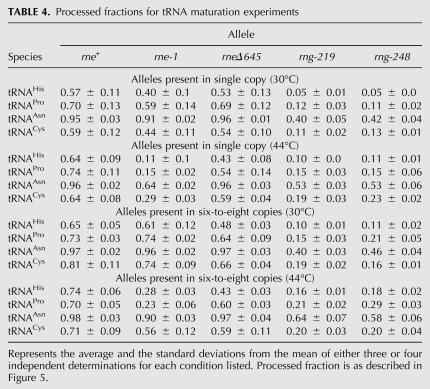
tRNA maturation was first tested with rne+, rne-1, rneΔ645, rng-219, and rng-248 alleles present on a single-copy plasmid in a rneΔ1018 deletion strain (Fig. 7A–D). The efficiency of tRNA maturation was quantified by determining the PF of mature tRNA relative to the total amount of processed and unprocessed species. Interestingly, at 30°C, a condition where all the strains were viable, the PF values of all four tRNA species were two- to 10-fold lower in the rng-219 and rng-248 mutants than in the rne+, rneΔ645, and rne-1 strains (Fig. 7A–D; Table 4). This observation may help explain the much slower growth rates observed in these strains at 30°C (Table 2). Furthermore, the processing of tRNAHis, tRNACys, and tRNAPro, as expected, was more dramatically affected than that of tRNAAsn. For example, compared to the wild-type control, the PF of tRNAHis (0.05) decreased over 10-fold in the rng-219 and rng-248 strains at 30°C (Fig. 7A; Table 4) compared with only an approximately twofold reduction for tRNAAsn (Fig. 7C; Table 4).
FIGURE 7.
Analysis of tRNA maturation in rneΔ1018/rng-219 and rneΔ1018/rng-248 mutants when the rng alleles were present in single copy. Steady-state RNA (5 μg/lane) isolated from cultures grown either at 30°C or after shift to 44°C was analyzed as described in Materials and Methods. PF denotes the processed fraction, which is defined as the amount of a given mature tRNA divided by the total amount of tRNA transcribed. The numbers represent the average of three to four independent determinations. The standard deviations from the mean are presented in Table 4. Arrows in the right margins indicate the position of each mature tRNA. RNA levels were normalized as described in Materials and Methods.
TABLE 4.
Processed fractions for tRNA maturation experiments
In experiments carried out after a 2-h shift to 44°C, the PF values of all four tRNAs decreased significantly in the rne-1 strain compared with the wild-type and rneΔ645 controls (Fig. 7A–D; Table 4). In contrast, the PF values for all four tRNA species increased 1.3–2.2-fold in the rng-219 and rng-248 strains compared with what was observed at 30°C but were still less than or equal to those obtained with the rne-1 allele (Fig. 7A–D; Table 4).
When the experiments were repeated with each allele present in six-to-eight copies/cell, the efficiency of tRNA maturation in the rne-1, rng-219, and rng-248 strains improved 1.2–2.0-fold for all four tRNA species at 30°C and 44°C compared with what was observed when the alleles were present in single copy (Fig. 7; Table 4). However, in all cases except for tRNAPro, the PF values in the rng-219 and rng-248 strains at 44°C were significantly less than in the rne-1 strain (Table 4, cf. 0.56 for tRNACys in the rne-1 strain and 0.20 in either rng mutant), even though under these conditions the rng-219 and rng-248 strains were viable, while the rne-1 mutant was not.
DISCUSSION
The results reported here demonstrate that even when intracellular RNase G levels were increased ∼30-fold by employing pDHK23 (Table 1; Fig. 1), the native protein did not support cell viability at 44°C in an rne-1 genetic background (Fig. 3). Furthermore, not withstanding previous reports that six extra amino acids at the amino terminus of RNase G (a situation that does not occur in vivo) (Briant et al. 2003) led to complementation of RNase E mutants (Lee et al. 2002; Deana and Belasco 2004), this modified protein did not effectively complement the rne-1 allele at 44°C in the MG1693 genetic background (Fig. 3).
Furthermore, the data from Figures 1B and 3 and Table 1 clearly distinguish the results described here and the experiments of Lee et al. (2002) and Deana and Belasco (2004). First, both pRNG3 (Lee et al. 2002) and pRNG1200 (Deana and Belasco 2004) led to the synthesis of between five- and 39-fold more RNase G protein, respectively, than was observed with either pDHK23 (rng+) or pDHK28 (rng-219) (Fig. 1B; Table 1), resulting in intracellular levels of wild-type RNase G that were five- to 43-fold higher than normal physiological levels of RNase E (Table 1). Yet even under these conditions, the N-terminal extended form of RNase G only weakly supported cell growth of an rne-1 strain at 44°C compared with the Rng-219 and Rng-248 proteins (Fig. 3). In contrast, when the N-terminal extended form of RNase G was expressed at levels comparable to either Rng-219 or Rng-248 (Table 1), no growth at 44°C was observed (Fig. 3).
Since DNA sequencing of the pRNG3 and pRNG1200 plasmids did not reveal any rng mutations (data not shown), it appears that the weak cell growth observed with pRNG3 and pRNG1200 at 44°C (Fig. 3) arose primarily from the very high levels of RNase G, which led to the survival of enough cells to form very small colonies. We hypothesize that if there is enough RNase G in a cell lacking RNase E, a small fraction of cells can survive as a result of inefficient processing by RNase G of whatever RNA species may be essential for cell survival. In contrast, the complementation of the rneΔ1018 and rne-1 alleles observed with the rng-219- and rng-248-encoded RNase G occurred over a range of mutant protein concentrations that were less than or equal to the normal physiological level of RNase E on a molecule/molecule basis (Table 1), suggesting a functional alteration in the activity of the two mutant RNase G proteins.
While it was surprising that subtle changes in the predicted RNase H domain of RNase G—a region with the least apparent 3D similarity to RNase E (Figs. 4, 5)—led to proteins that complemented the loss of RNase E, this result indicates that at least some of the biological differences between the two enzymes are related to this domain. These mutants suggest a possible important role for the RNase H subdomain in the activity of both proteins. In fact, we have recently isolated temperature-sensitive rne mutations that map in the RNase H domain (J Reyes-Darius, T Perwcz, and SR Kushner, in prep.). Whether the RNase H domain is critical for initial binding of various RNA molecules or is involved in promoting phosphodiester bond cleavages remains to be determined.
Although the experiments reported here do not provide a definitive explanation for the differences in the catalytic activities of RNase E and RNase G, the ability of the altered Rng proteins to support cell viability in an rne deletion strain at protein levels less than or comparable to those observed for RNase E (Table 1) in wild-type cells did provide an opportunity to critically examine the role of RNase E in 9S rRNA processing, mRNA decay, and tRNA maturation.
For example, since the half-life of the rpsO transcript increased dramatically in the complete absence of RNase E (Table 3) and no decay intermediates were observed (data not shown), it would appear that this mRNA is normally not a substrate for RNase Z (Perwez and Kushner 2006), RNase LS (Otsuka and Yonesaki 2005), or RNase G. Although there might be some concern that the Rng-219 and Rng-248 proteins could have a dominant negative phenotype, as has been observed with certain RNase E mutants (Briegel et al. 2006), their ability to support cell viability in an rneΔ1018 rng∷cat double mutant (data not shown) suggests that this is not the case. The results with both the rpsO and cspA mRNAs also indicate that the Rne-1 protein retains a significant amount of residual activity at the nonpermissive temperature, a conclusion also supported by the analysis of tRNA processing by Mohanty and Kushner (2008).
In contrast, the half-lives of the rpsT (rpsTP1 and rpsTP2) and cspE transcripts did not change significantly among the rneΔ1018/rne-1, rneΔ1018/rng-219, and rneΔ1018/rng-248 strains under any condition tested (Table 3), supporting previous results that other ribonucleases such as RNase G and RNase Z can initiate the decay of these transcripts (Ow et al. 2003; Perwez and Kushner 2006). Furthermore, the change in the decay pattern of the rpsT transcripts in the rneΔ1018/rng-219 and rneΔ1019/rng-248 strains (data not shown) demonstrated that the altered RNase G proteins probably cleaved the transcripts at locations different from those recognized by RNase E. In fact, in vitro studies show that RNase E and RNase G show little, if any, overlap in their cleavage specificity of the rpsTP1 transcript (D-H Chung and SR Kushner, in prep.). Thus, it appears that some mRNAs (rpsO and cspA) are much more dependent on RNase E for their decay than others (rpsT and cspE) (Table 3).
The data on tRNA processing were of equal interest. While RNase E is clearly required for the initial processing of many tRNAs in vivo (Li and Deutscher 2002; Ow and Kushner 2002), it cleaves some tRNA precursors more efficiently than others (Ow and Kushner 2002). The results presented in Figure 7 and Table 4 confirm that for some tRNAs (notably tRNAHis, tRNAPro, and tRNACys) initial processing of the polycistronic transcripts containing these species appears to be absolutely dependent on RNase E under normal physiological conditions. For example, when the rng-219 and rng-248 alleles were present on single-copy plasmids, the PFs of these three tRNAs at 30°C were 0.05–0.13 (Fig. 7; Table 4). When the level of the mutant RNase G proteins was increased ∼3.2-fold (Table 1), the processed fractions only increased marginally to between 0.10 and 0.21 at the same temperature (Table 4). These data indicate that the small amount of these three tRNAs arising in the RNase E deletion mutant arose from very inefficient processing carried out by the Rng-219 and Rng-248 proteins. Thus, it appears that RNase E is absolutely required to carry out the initial processing of the polycistronic operons that contain tRNAHis, tRNACys, and tRNAPro.
Finally, it is important to note that the RNase G mutants described here support cell growth in the absence of RNase E, but the altered proteins only partially substitute for its functions in mRNA decay and only marginally, if at all, participate in tRNA processing (Figs. 5, 7; Tables 3, 4). Thus it is still not clear at this time what constitutes the essential function of RNase E. In addition, the data on tRNA processing shown in Figure 7 and Table 4 demonstrate that cells can grow, albeit slowly (Table 2), with only a very small fraction of their normal complement of functional tRNAs. Taken together, it would appear that very small changes in either the availability of a processed structural RNA or the level of a particular mRNA probably accounts for the difference between a viable or inviable cell. The current assays being used to measure differences in the levels of various RNA species may simply not be sensitive enough to identify the actual cause for the loss of cell viability in an RNase E deletion mutant.
MATERIALS AND METHODS
Bacterial strains
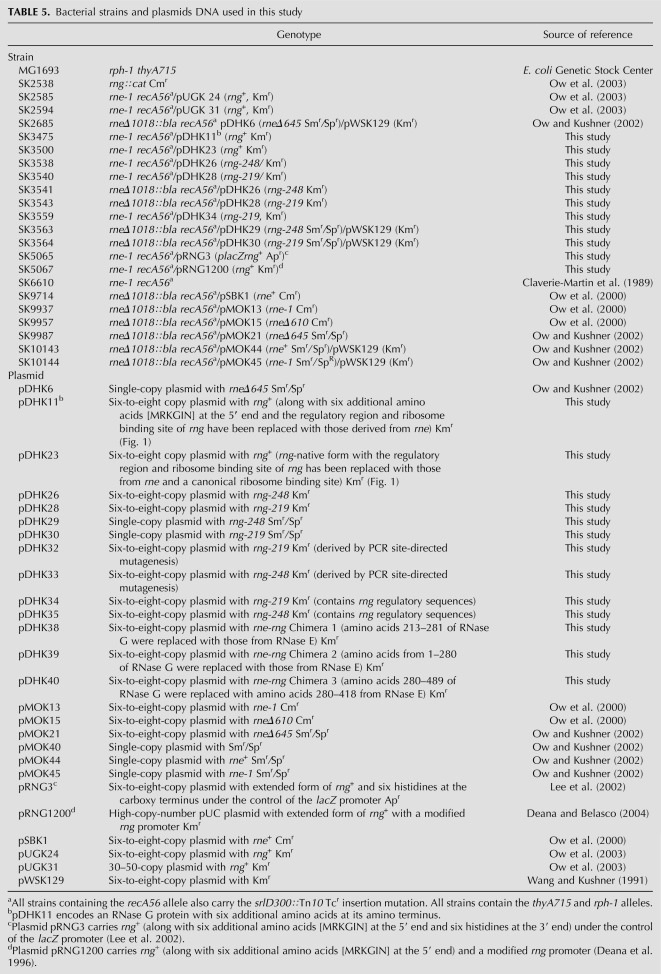
The E. coli K-12 strains used in this study were all derived from MG1693 (rph-1 thyA715) (Arraiano et al. 1988) and are listed in Table 5. Strains SK3475, SK3500, SK3538, SK3540, SK3541, SK3543, SK3559, SK3563, SK3564, SK5065, and SK5067 were constructed either by standard plasmid transformation protocols or plasmid displacement as previously described (Ow et al. 2000; Ow and Kushner 2002).
TABLE 5.
Bacterial strains and plasmids DNA used in this study
Growth and viability studies
Overnight standing cultures of various strains in Luria broth supplemented with thymine (50 μg/mL) and kanamycin (25 μg/mL), chloramphenicol (20 μg/mL), or spectinomycin (20 μg/mL), where appropriate, were diluted 1:1000 into prewarmed fresh medium and shaken at 30°C or 37°C. Cultures were monitored with a Klett-Summerson Colorimeter (no. 42 green filter). For the 44°C growth curves, cultures were initially grown with shaking at 37°C until they reached 40 Klett units (no. 42 green filter) above background and then were shifted to 44°C.
Microscopic observation of cells and nucleoids
The 30°C samples were taken from exponentially growing cultures (1 × 10⁸ cells/mL). The cultures were then shifted to 44°C. Cell densities were kept between 1 and 2 × 10⁸ cells/mL by diluting the cultures with fresh prewarmed medium. The 44°C samples were taken 2 h after the temperature shift. The cells were immobilized and stained with DAPI (4′,6-diamino-2-phenyl-indole) as previously described (Hiraga et al. 1989). After immersion oil was put on the cover slip, the cells were photographed at 100× magnification with a Hamamatsu digital camera (C-4742-95) mounted on a Zeiss fluorescence microscope equipped with Nomarski optics and Improvision Openlab software.
Oligonucleotide primers
The sequences of the various oligonucleotides used in these experiments are available upon request.
Plasmid constructions
The plasmids described below were generated using overlapping polymerase chain reaction (PCR) techniques and the high fidelity Pfu DNA polymerase (Stratagene). For the construction of pDHK11 (Fig. 1A), a 2.2-kb fusion DNA fragment was synthesized that contained the regulatory region, ribosome binding site, and ATG start codon of rne along with the rng+ sequence that included 15 base-pair (bp) encoding an additional five amino acids (RKGIN) upstream of the native RNase G translation start codon (Briant et al. 2003). The ATG from rne replaced the GTG from rng such that a total of six extra amino acids were synthesized at the amino terminus of the RNase G protein derived from pDHK11. First, an rne gene fragment (640 bp) was amplified by PCR using the primers RNE-UP and RNE-OE1 and pQLK26 plasmid DNA (Ow et al. 2000) as a template. In addition, an rng gene fragment (1579 bp) was amplified by PCR using the primers RNG-OE1 and RNG-antisense and pUGK24 plasmid DNA (Ow et al. 2003) as template. The RNE-UP and RNG-antisense primers were engineered to contain EcoRI and XbaI sites, respectively. Subsequently, overlap extension PCR with primers RNE-OE1 and RNG-OE1 was used to generate a 2.2-kb fusion DNA fragment containing the rne gene fragment (640 bp) and rng gene fragments (1579 bp). The amplified fusion DNA fragment was cloned into pWSK129 (Wang and Kushner 1991), which had been digested with EcoRI and XbaI, to generate pDHK11.
Plasmid pDHK23 (encoding the native form of RNase G) (Fig. 1A) is identical to pDHK11 except for the GTG (putative upstream start codon derived from rng) was changed to CTG to prevent translation initiation from this location, and a canonical ribosome binding site (AGGAGG) was inserted 7 nt upstream of the ATG start codon to produce the native form of RNase G (Fig. 1A). To make these changes, a 658-bp rne DNA fragment was amplified by PCR using the primers RNE-UP and RNE-upstream and pQLK26 plasmid DNA as template along with a rng gene fragment (1561 bp) that was amplified by using the primers RNG-RBS and RNG-antisense and pUGK24 plasmid DNA as template. The RNE-upstream and RNG-RBS primer sequences were used for overlapping extension PCR to generate a 2.2-kb fusion DNA fragment that was subsequently cloned into pWKS129 as described for pDHK11.
To generate pDHK31, a 2.2-kb EcoRI/NotI DNA fragment containing the complete rne-rng fusion from pDHK23 was cloned into the single-copy vector pMOK40 (Ow and Kushner 2002) that had been digested with EcoRI and NotI.
pDHK29 (rng-248 Smr/Spr) and pDHK30 (rng-219 Smr/Spr) were made by cloning the 2.2-kb EcoRI/NotI DNA fragments from pDHK26 and pDHK28, respectively, into the EcoRI/NotI sites of pMOK40 (Ow and Kushner 2002). Plasmids pDHK29, pDHK30, and pDHK31 all contained the single-copy mini-F origin of DNA replication.
Plasmid pDHK38 (containing two RNase G fragments, one from the N terminus to amino acid 213 [including the S1 and 5′ sensor regions] and one including the C-terminal rng coding sequence for amino acids 281–488 (DNase I domain and Zn-link) along with the rne coding sequences for amino acids 213–281 (RNase H domain) was constructed by employing a two-step overlap extension PCR procedure. The regulatory region for this chimeric construct was derived from RNase E as described for pDHK23. To generate the N-terminal 1.5-kb DNA fragment containing rne/rng sequences (1.3 kb) and the 206 bp from rne, a 1.3-kb rne/rng DNA fragment was amplified using primers RNE-UP and RNG-1260 down and plasmid pDHK23 as a template. In addition, a 206-bp rne DNA fragment was amplified using primers RNE-1280up and RNE-1486down and plasmid pQLK26 (Ow et al. 2000) as a template. Overlap extension PCR was then used to generate an N-terminal fragment of 1.5 kb. The C-terminal 715-bp rng fragment was amplified using the prime RNG1486up and RNG-antisense along with pUGK24 as the template. The second overlap extension PCR was performed to generate a 2.2-kb fusion DNA fragment containing the 1.5-kb rne/rng/rne DNA fragment and the downstream 715-bp rng fragment. The amplified chimeric rne/rng gene was cloned into pWSK129 (Wang and Kushner 1991) as described for pDHK11.
Plasmid pDHK39 (containing the regulatory region and first 281 amino acids of RNase E [S1, 5′ sensor and RNase H subdomains] fused to the rng coding sequence for amino acids 282–488) was constructed by first amplifying a 1.5-kb rne DNA fragment using primers RNE-UP and RNE-1486down and pQLK26 plasmid DNA as a template. In addition a 715-bp rng DNA fragment was amplified using primer RNG-1486up and RNG-antisense and pUGK24 plasmid DNA as a template. The RNE-1486down and RNA-1486up primers were used for the overlap PCR. The fusion fragment was cloned into pWSK129 as described for pDHK11
Plasmid pDHK40 (containing the regulatory region of RNase E, the first 280 amino acids of RNase G [S1, 5′ sensor and RNase H subdomains] along with amino acids 281–418 from RNase E [DNase I subdomain and Zn-link]) was constructed by first amplifying a 1.5-kb rne/rng DNA fragment using primers RNE-UP and RNG+278down and pDHK23 plasmid DNA as a template. In addition, a 450-bp rne DNA fragment was amplified using primers RNE+279up and RNE+417down and pMOK21 (rneΔ645) plasmid DNA (Ow et al. 2003) as a template. The RNE+417down primer contained a XbaI site. The fusion fragment, generated using the RNG+278down and RNE+279up primer sequences, was subsequently cloned into pWSK129 as described for pDHK11.
All the plasmid constructions were verified using a combination of DNA sequencing and Western blot analysis. Western blot analysis of RNase E/G Chimeric proteins 1 and 3 employed a polyclonal anti-RNase G antibody that was kindly provided by G. Mackie (Briant et al. 2003). RNase E/G Chimeric protein 2 was detected using a MAP antibody raised against the first 20 amino acids of RNase E (Ow et al. 2000). To determine if the RNase G proteins were biologically active, steady-state RNA was isolated from independent transformants in an rng∷cat genetic background (SK2538), and the presence or absence of the 16.3S rRNA precursor was determined as described by Wachi et al. (1999).
Site-directed mutagenesis
Overlapping PCR was used to individually introduce the two different single nucleotide changes in pDHK23. The G→T transversion at the first base pair of the codon encoding amino acid 219 and the G→A transition at the first base pair of amino acid 248 resulted in plasmids pDHK32 and pDHK33, respectively. Plasmids pDHK34 (rng-219 Kmr) and pDHK35 (rng-248 Kmr) were constructed to determine the effect of the two independent single amino acid substitutions on RNase G when the proteins were synthesized from the native rng regulatory region instead of from rne promoters. In this case, the experiment was identical to that described above for pDHK32 and pDHK33, except that pUGK24 (rng+ Kmr) (Ow et al. 2003) plasmid DNA was used as a template. Specific experimental details are available upon request. The presence of the predicted point mutations in the four plasmids was confirmed by manual plasmid DNA sequencing using fmol DNA Cycle Sequencing System Kit (Promega) as instructed by the manufacturer.
Western analysis
Western blot analysis of RNase E, RNase G, and RNase G derivatives and the RNase E/G chimeric proteins was performed as described by Ow et al. (2000) and Ow and Kushner (2002). Protein concentrations were determined by the Bio-Rad protein assay with bovine serum albumin as the standard. Protein samples (2–100 μg for RNase G) were electrophoresed in an 8% SDS–polyacrylamide gels and electrotransferred to PVDF membranes (ImmobilonTM-P; Millipore) using a Bio-Rad Mini-Protean 3 electrophoretic apparatus. The membranes were then probed with either RNase E (1:2000 dilution) or RNase G (1:10,000 dilution) antibodies using the ECL Plus Western Blotting Detection Kit (GE Healthcare) as specified by the manufacturer. The RNase G antibody was kindly provided by G. Mackie (Briant et al. 2003) and was preincubated with a 1 mg of protein extract from RNase G-deficient E. coli cells (SK2538 rng∷cat) (Ow et al. 2003) prior to use. The RNase E MAP antibody was raised against the first 20 amino acids of RNase E (Ow et al. 2000). Protein bands were quantified using a Storm 840 PhosphorImager (GE Healthcare) equipped with ImageQuant v.5.2 software (Molecular Dynamics).
Northern analysis
Total RNA extraction and mRNA Northern blot analysis were done according to the procedures described by O'Hara et al. (1995) and Burnett (1997). The steady-state RNAs used for the 5S rRNA and tRNA Northern blots were obtained from exponential cultures grown either at 30°C or after shift to 44°C for 120 min. Northern analysis of tRNAs and 5S rRNA (5 μg/lane) were done as described by Ow et al. (2000) and Ow and Kushner (2002). Probes for the 5S rRNA (“PB5S”) (Babitzke et al. 1993) and tRNAs (hisR, cysT, proM, asn) were oligonucleotides (Ow and Kushner 2002) complementary to the mature species and were 5′-end-labeled with 32P using T4 polynucleotide kinase. For quantification, the RNA samples were run on a 1.25% agarose gel and probed for 16S rRNA using the 32P-5′-end-labeled primer 16S1586 (Ow et al. 2000). mRNA half-lives were calculated using least-squares linear regression analysis.
Computer modeling of RNase G structure
The protein sequence of RNase G was compared against the PDB database by PSI-BLAST (Altschul et al. 1997). Three PDB entries, 2bx2, 2c4r, and 2c0b, were selected as homologous templates for the next step of molecular modeling. All three sequences were derived from the catalytic domain of E. coli RNase E. The sequence identity between RNase G and the catalytic domain of RNase E was 34.1%. To generate the model shown in Supplemental Figure S1, the inter/intra restraints ratio was set to 0.9. The margins in the distance restraints and angle restraints were 0.5 Å and 1.0 Å, respectively. The maximum number of distance restraints was 20,000. Three models were generated using Geno3D (http://geno3d-pbil.ibcp.fr), an online homology modeling tool (Combet et al. 2002). The model with the lowest energy is presented in Supplemental Figure S1. In this model, 0.9% of the residues occupied disallowed regions of the Ramachandran plot. The root-mean-square deviation between this model and the RNase E templates range 1.48–1.66 Å. The model of RNase G and the 3D structure of RNase E were analyzed and viewed with PyMol (http://pymol.sourceforge.net/).
ACKNOWLEDGMENTS
We thank J. Shivas for excellent technical assistance and B. Mohanty and T. Perwez for critical reading of the manuscript. pRNG3 and pRNG120 were graciously provided by Dr. S. Cohen and Dr. J.G. Belasco, respectively. This work was supported in part by a grant (GM57220) from the National Institute of General Medical Sciences to S.R.K.
Footnotes
Article published online ahead of print. Article and publication date are at http://www.rnajournal.org/cgi/doi/10.1261/rna.2104810.
REFERENCES
- Altschul SF, Madden TL, Schaffer AA, Zhang J, Zhang Z, Miller W, Lipman DJ 1997. Gapped BLAST and PSI-BLAST: A new generation of protein database search programs. Nucleic Acids Res 25: 3389–3402 [DOI] [PMC free article] [PubMed] [Google Scholar]
- Apirion D, Lasser AB 1978. A conditional lethal mutant of Escherichia coli which affects the processing of ribosomal RNA. J Biol Chem 253: 1738–1742 [PubMed] [Google Scholar]
- Arraiano CM, Yancey SD, Kushner SR 1988. Stabilization of discrete mRNA breakdown products in ams pnp rnb multiple mutants of Escherichia coli K-12. J Bacteriol 170: 4625–4633 [DOI] [PMC free article] [PubMed] [Google Scholar]
- Babitzke P, Kushner SR 1991. The Ams (altered mRNA stability) protein and ribonuclease E are encoded by the same structural gene of Escherichia coli. Proc Natl Acad Sci 88: 1–5 [DOI] [PMC free article] [PubMed] [Google Scholar]
- Babitzke P, Granger L, Olszewski J, Kushner SR 1993. Analysis of mRNA decay and rRNA processing in Escherichia coli multiple mutants carrying a deletion in RNase III. J Bacteriol 175: 229–239 [DOI] [PMC free article] [PubMed] [Google Scholar]
- Betat H, Rammelt C, Martin G, Morl M 2004. Exchange of regions between bacterial poly(A) polymerase and the CCA-adding enzyme generates altered specificities. Mol Cell 15: 389–398 [DOI] [PubMed] [Google Scholar]
- Briant DJ, Hankins JS, Cook MA, Mackie GA 2003. The quartenary structure of RNase G from Escherichia coli. Mol Microbiol 50: 1381–1390 [DOI] [PubMed] [Google Scholar]
- Briegel KJ, Baker A, Jain C 2006. Identification and analysis of Escherichia coli ribonuclease E dominant-negative mutants. Genetics 172: 7–15 [DOI] [PMC free article] [PubMed] [Google Scholar]
- Burnett WV 1997. Northern blotting of RNA denatured in glyoxal without buffer recirculation. Biotechniques 22: 668–671 [DOI] [PubMed] [Google Scholar]
- Callaghan AJ, Marcaida MJ, Stead JA, McDowall KJ, Scott WG, Luisi BF 2005. Structure of Escherichia coli RNase E catalytic domain and implications for RNA turnover. Nature 437: 1187–1191 [DOI] [PubMed] [Google Scholar]
- Celesnik H, Deana A, Belasco JG 2007. Initiation of RNA decay in Escherichia coli by 5′ pyrophosphate removal. Mol Cell 27: 79–90 [DOI] [PMC free article] [PubMed] [Google Scholar]
- Claverie-Martin F, Diaz-Torres MR, Yancey SD, Kushner SR 1989. Cloning of the altered mRNA stability (ams) gene of Escherichia coli K-12. J Bacteriol 171: 5479–5486 [DOI] [PMC free article] [PubMed] [Google Scholar]
- Combet C, Jambon M, Deleage G, Geourjan C 2002. Geno3D: Automatic comparative molecular modelling of protein. Bioinformatics 18: 213–214 [DOI] [PubMed] [Google Scholar]
- Deana A, Belasco JG 2004. The function of RNase G in Escherichia coli is constrained by its amino and carboxyl termini. Mol Microbiol 51: 1205–1217 [DOI] [PubMed] [Google Scholar]
- Deana A, Ehrlich R, Reiss C 1996. Synonymous codon selection controls in vivo turnover and amount of mRNA in Escherichia coli bla and ompA genes. J Bacteriol 178: 2718–2720 [DOI] [PMC free article] [PubMed] [Google Scholar]
- Goldenberg D, Azar I, Oppenheim AB 1996. Differential mRNA stability of the cspA gene in the cold-shock response of Escherichia coli. Mol Microbiol 19: 241–248 [DOI] [PubMed] [Google Scholar]
- Hajnsdorf E, Regnier P 1999. E. coli rpsO mRNA decay: RNase E processing at the beginning of the coding sequence stimulates poly(A)-dependent degradation of the mRNA. J Mol Biol 286: 1033–1043 [DOI] [PubMed] [Google Scholar]
- Hajnsdorf E, Steier O, Coscoy L, Teysset L, Régnier P 1994. Roles of RNase E, RNase II and PNPase in the degradation of the rpsO transcripts of Escherichia coli: Stabilizing function of RNase II and evidence for efficient degradation in an ams pnp rnb mutant. EMBO J 13: 3368–3377 [DOI] [PMC free article] [PubMed] [Google Scholar]
- Hajnsdorf E, Braun F, Haugel-Nielsen J, Le Derout J, Régnier P 1996. Multiple degradation pathways of the rpsO mRNA of Escherichia coli. RNase E interacts with the 5′ and 3′ extremities of the primary transcript. Biochimie 78: 416–424 [DOI] [PubMed] [Google Scholar]
- Hankins JS, Zappavigna C, Prud'homme-Genereux A, Mackie GA 2007. Role of RNA structure and susceptibility to RNase E in regulation of a cold shock mRNA, cspA mRNA. J Bacteriol 189: 4353–4358 [DOI] [PMC free article] [PubMed] [Google Scholar]
- Hiraga S, Niki H, Ogura T, Ichinose C, Mori H, Ezaki B, Jaffe A 1989. Chromosome partitioning in Escherichia coli: Novel mutants producing anucleate cells. J Bacteriol 171: 1496–1505 [DOI] [PMC free article] [PubMed] [Google Scholar]
- Kaga N, Umitsuki G, Nagai K, Wachi M 2002. RNase G-dependent degradation of the eno mRNA encoding a glycolysis enzyme enolase in Escherichia coli. Biosci Biotechnol Biochem 66: 2216–2220 [DOI] [PubMed] [Google Scholar]
- Kuwano M, Ono M, Endo H, Hori K, Nakamura K, Hirota Y, Ohnishi Y 1977. Gene affecting longevity of messenger RNA: A mutant of Escherichia coli with altered mRNA stability. Mol Gen Genet 154: 279–285 [DOI] [PubMed] [Google Scholar]
- Lee K, Bernstein JA, Cohen SN 2002. RNase G complementation of rne null mutation identified functional interrelationships with RNase E in Escherichia coli. Mol Microbiol 43: 1445–1456 [DOI] [PubMed] [Google Scholar]
- Li Z, Deutscher MP 2002. RNase E plays an essential role in the maturation of Escherichia coli tRNA precursors. RNA 8: 97–109 [DOI] [PMC free article] [PubMed] [Google Scholar]
- Li Z, Pandit S, Deutscher MP 1999. RNase G (CafA protein) and RNase E are both required for the 5′ maturation of 16S ribosomal RNA. EMBO J 18: 2878–2885 [DOI] [PMC free article] [PubMed] [Google Scholar]
- Lin-Chao S, Wei C-L, Lin Y-T 1999. RNase E is required for the maturation of ssrA and normal ssrA RNA peptide-tagging activity. Proc Natl Acad Sci 96: 12406–12411 [DOI] [PMC free article] [PubMed] [Google Scholar]
- Lopez PJ, Marchand I, Joyce SA, Dreyfus M 1999. The C-terminal half of RNase E, which organizes the Escherichia coli degradosome, participates in mRNA degradation but not rRNA processing in vivo. Mol Microbiol 33: 188–199 [DOI] [PubMed] [Google Scholar]
- Lundberg U, Altman S 1995. Processing of the precursor to the catalytic RNA subunit of RNase P from Escherichia coli. RNA 1: 327–334 [PMC free article] [PubMed] [Google Scholar]
- Mackie GA 1991. Specific endonucleolytic cleavage of the mRNA for ribosomal protein S20 of Escherichia coli requires the products of the ams gene in vivo and in vitro. J Bacteriol 173: 2488–2497 [DOI] [PMC free article] [PubMed] [Google Scholar]
- Mackie GA 1998. Ribonuclease E is a 5′-end-dependent endonuclease. Nature 395: 720–723 [DOI] [PubMed] [Google Scholar]
- Masse R, Escorcia FE, Gottesman S 2003. Coupled degradation of a small regulatory RNA and its mRNA targets in Escherichia coli. Genes Dev 17: 2374–2383 [DOI] [PMC free article] [PubMed] [Google Scholar]
- Mohanty BK, Kushner SR 2008. Rho-independent transcription terminators inhibit RNase P processing of the secG leuU and metT tRNA polycistronic transcripts in Escherichia coli. Nucleic Acids Res 36: 364–375 [DOI] [PMC free article] [PubMed] [Google Scholar]
- O'Hara EB, Chekanova JA, Ingle CA, Kushner ZR, Peters E, Kushner SR 1995. Polyadenylylation helps regulate mRNA decay in Escherichia coli. Proc Natl Acad Sci 92: 1807–1811 [DOI] [PMC free article] [PubMed] [Google Scholar]
- Okada Y, Wachi M, Hirata A, Suzuki K, Nagai K, Matsuhashi M 1994. Cytoplasmic axial filaments in Escherichia coli cells: Possible function in the mechanism of chromosome segregation and cell division. J Bacteriol 176: 917–922 [DOI] [PMC free article] [PubMed] [Google Scholar]
- Otsuka Y, Yonesaki T 2005. A novel endoribonuclease, RNase LS, in Escherichia coli. Genetics 169: 13–20 [DOI] [PMC free article] [PubMed] [Google Scholar]
- Ow MC, Kushner SR 2002. Initiation of tRNA maturation by RNase E is essential for cell viability in E. coli. Genes Dev 16: 1102–1115 [DOI] [PMC free article] [PubMed] [Google Scholar]
- Ow MC, Liu Q, Kushner SR 2000. Analysis of mRNA decay and rRNA processing in Escherichia coli in the absence of RNase E-based degradosome assembly. Mol Microbiol 38: 854–866 [DOI] [PubMed] [Google Scholar]
- Ow MC, Liu Q, Mohanty BK, Andrew ME, Maples VF, Kushner SR 2002. RNase E levels in Escherichia coli are controlled by a complex regulatory system that involves transcription of the rne gene from three promoters. Mol Microbiol 43: 159–171 [DOI] [PubMed] [Google Scholar]
- Ow MC, Perwez T, Kushner SR 2003. RNase G of Escherichia coli exhibits only limited functional overlap with its essential homologue, RNase E. Mol Microbiol 49: 607–622 [DOI] [PubMed] [Google Scholar]
- Perwez T, Kushner SR 2006. RNase Z in Escherichia coli plays a significant role in mRNA decay. Mol Microbiol 60: 723–737 [DOI] [PubMed] [Google Scholar]
- Perwez T, Hami D, Maples VF, Min Z, Wang BC, Kushner SR 2008. Intragenic suppressors of temperature-sensitive rne mutations lead to the dissociation of RNase E activity on mRNA and tRNA substrates in Escherichia coli. Nucleic Acids Res 36: 5306–5318 [DOI] [PMC free article] [PubMed] [Google Scholar]
- Ray BK, Apirion D 1981. Transfer RNA precursors are accumulated in Escherichia coli in the absence of RNase E. Eur J Biochem 114: 517–524 [DOI] [PubMed] [Google Scholar]
- Tamura M, Lee K, Miller CA, Moore CJ, Shirako Y, Kobayashi M, Cohen SN 2006. RNase E maintenance of proper FtsZ/FtsA ratio required for nonfilamentous growth of Escherichia coli cells but not for colony-forming ability. J Bacteriol 188: 5145–5152 [DOI] [PMC free article] [PubMed] [Google Scholar]
- Tock MR, Walsh AP, Carroll G, McDowall KJ 2000. The CafA protein required for the 5′-maturation of 16 S rRNA is a 5′-end-dependent ribonuclease that has context-dependent broad sequence specificity. J Biol Chem 275: 8726–8732 [DOI] [PubMed] [Google Scholar]
- Umitsuki G, Wachi M, Takada A, Hikichi T, Nagia K 2001. Involvement of RNase G in in vivo mRNA metabolism in Escherichia coli. Genes Cells 6: 403–410 [DOI] [PubMed] [Google Scholar]
- Wachi M, Umitsuki G, Nagai K 1997. Functional relationship between Escherichia coli RNase E and the CafA protein. Mol Gen Genet 253: 515–519 [DOI] [PubMed] [Google Scholar]
- Wachi M, Umitsuki G, Shimizu M, Takada A, Nagai K 1999. Escherichia coli cafA gene encodes a novel RNase, designated as RNase G, involved in processing of the 5′ end of 16S rRNA. Biochem Biophys Res Commun 259: 483–488 [DOI] [PubMed] [Google Scholar]
- Wachi M, Naoko K, Umitsuki G, Clarke DP, Nagai K 2001. A novel RNase G mutant that is defective in degradation of adhE mRNA but proficient in the processing of 16S rRNA precursor. Biochem Biophys Res Commun 289: 1301–1306 [DOI] [PubMed] [Google Scholar]
- Wang RF, Kushner SR 1991. Construction of versatile low-copy-number vectors for cloning, sequencing and expression in Escherichia coli. Gene 100: 195–199 [PubMed] [Google Scholar]


