Abstract
This paper introduces a three dielectric layer hybrid solvation model for treating electrostatic interactions of biomolecules in solvents using the Poisson-Boltzmann equation. In this model, an interior spherical cavity will contain the solute and some explicit solvent molecules, and an intermediate buffer layer and an exterior layer contain the bulk solvent. A special dielectric permittivity profile is used to achieve a continuous dielectric transition from the interior cavity to the exterior layer. The selection of this special profile using a harmonic interpolation allows an analytical solution of the model by generalizing the classical Kirkwood series expansion. Discrete image charges are used to speed up calculations for the electrostatic potential within the interior and buffer layer regions. Semi-analytical and least squares methods are used to construct an accurate discrete image approximation for the reaction field due to solvent with or without salt effects. In particular, the image charges obtained by the least squares method provide accurate approximations to the reaction field independent of the ionic concentration of the solvent. Numerical results are presented to validate the accuracy and effectiveness of the image charge methods.
Keywords: Image charge methods, distance-dependent dielectric permittivity, hybrid implicit/explicit model, reaction field, Poisson-Boltzmann equation, protein
1 Introduction
The study of electrostatic interactions using macroscopic continuum models [5, 11, 17, 26, 40] has been widely conducted for investigating structure, function, and properties of protein molecules in an aqueous environment. These implicit models characterize the solvent in terms of macroscopic physical quantities such as dielectric constants and Debye lengths, and thus greatly reduce the degrees of freedom in comparison with explicit atomistic solvent models. In macroscopic models, the solute molecule is usually considered as a uniform low-dielectric medium (with a dielectric constant between one and four) with a fixed charge distribution, and the solvent is treated as a homogeneous medium with a high dielectric constant, such as 80 for water. A Linearized Poisson-Boltzmann (LPB) equation is then solved to obtain the electrostatic potential of the system.
Historically, Born [8] first studied the solvation effects for an ion placed at the center of a spherical region with a low dielectric constant embedded in a high-dielectric medium, and derived the electrostatic free energy. Onsager [32] extended this study to a dipole. Both Born and Onsager models are special cases of the results of Kirkwood [25] and Tan-ford and Kirkwood [38], which represented the solute molecule as a collection of fixed charges within a spherical cavity. The LPB equation was solved analytically for spherical geometries in these early studies. More recent work has considered ellipsoids [4,13]. For an irregular boundary, numerical methods [6,24,28] such as finite difference and finite element methods in three-dimensional grids must be used. However, numerically solving the LPB equation is computationally expensive. To analytically treat biomolecules with general geometries, the hybrid implicit/explicit model using a spherical cavity has been developed [7, 31]. In addition to the biomolecule solute, such as a protein, the spherical cavity contains several layers of explicit water molecules to model the interactions between the solute and solvent molecules.
In previous work, we developed a multiple image charge approximation [9] to the Kirkwood series solution using numerical quadratures of the line image charge representation [18, 27, 29, 30] of the reaction field from pure water. The locations of resulting image charges are related to Gauss quadrature points. Although less accurate, a single image charge [19] and its improved version [1] have been widely applied in molecular dynamic and Monte Carlo simulations [21,33,41]. Employing more images improves the approximation of the Kirkwood solution, especially closer to the boundary. The method of multiple discrete images has also been extended to treat the reaction field for ionic solvents [14,15,43] in the case of low ionic strength.
Unfortunately, continuum solvation models with piecewise constant dielectric functions produce unphysical reaction fields within the spherical cavity near the boundary. This artifact strongly affects the charged solvent molecules (i.e. water) near the boundary. Inaccurate estimation of the pairwise electrostatic interaction [35] results because of improper electrostatic screening by the high-dielectric solvent. To overcome this drawback, pairwise electrostatic interactions near the interface have been modeled using a distance-dependent effective dielectric constant differing from the two homogeneous phases [16]. The simplest of these models assigns an effective dielectric constant between all pairs of charged particles as a linear function [42] of their separation distance, but this creates an inconsistency with the bulk dielectric constant for long-range interactions. Improvements along these lines are obtained by imposing sigmoidal forms [22,23,34,36] of dielectric functions, which approximate the low dielectric constant for short-range interactions and the bulk dielectric constant of solvent for the long-range interactions. These models attempt to compensate for the source of inaccuracies, which derive from the sharp interface between two dielectric constants used in the spherical hybrid solvation model [7,31].
The sharp jump in the dielectric permittivity induces a singular reaction field when an explicit charge within the cavity approaches the interface, which causes the self contribution of the electrostatic solvation energy to diverge. Simply increasing the size of the spherical cavity and the amount of explicit water within does not eliminate unphysical long range effects that propagate throughout the cavity due to the influence of the boundary. Details of how to minimize these unwanted effects within molecular dynamic simulations will be published elsewhere. However, the unphysical boundary effects can be reduced using a three-layer model [12, 35], which was originally developed by using an intermediate dielectric constant in a buffer layer. This idea can be further extended to eliminate any artificial discontinuity. In the present work, a smooth transition layer from low to high dielectric mediums is proposed to form a new three-layer dielectric model. The first inner layer defines a spherical cavity with a low dielectric constant, containing the biomolecule under study and explicit solvent molecules. The second intermediate layer defines a spherical shell as a buffer zone of solvent described by a dielectric permittivity with a radial distance dependent function. The third layer consists of the bulk solvent characterized by a high dielectric constant.
The electrostatic potential can be solved everywhere within the first two layers of the three-layer model by generalizing the Kirkwood series expansion [25] in terms of Legendre polynomials. From a computational point of view, direct summation of this series expansion is very expensive, more than the Kirkwood series [3,39]. However, this computational cost can be by-passed by using a multiple image charge method for the three-layer model. In this paper, we will present a fast and accurate method to calculate the reaction field for a single spherical cavity having a boundary layer to diminish the un-physical artifacts due to the abrupt transition between dielectric constants inside and outside the cavity. We will show that the complexity of solving this three-layer hybrid model using the method of multiple image charges is no greater than for the hybrid model with discontinuous change in dielectric at the boundary of the sphere. Specifically, compared with using exact expansions, the multiple image charge method is computationally much less expensive when used together with the order N fast multipole method [9,10].
To proceed in this direction, the first step is to develop the formulas for the image charges. Herein, two multiple image approaches are developed for the proposed three-layer model. First, a semi-analytical approach extends the approach of using numerical quadratures to line images, giving an approximation of the reaction field in an order  (h2/a2) where h is the thickness of the buffer layer and a is the inner spherical radius. Second, a least squares approach minimizing the error of the reaction field is used to optimize image charges at pre-defined image locations, which is shown to produce more accurate results than the semi-analytical approach. Specifically, the image charges obtained by the least squares method provide accurate approximations to the reaction field independent of the ionic concentration in the solvent. In contrast, the accuracy of our previously obtained image charges for the reaction field depends on the solvent’s ionic strength [14,15,43].
The rest of the paper is organized as follows: In Section 2, we introduce the three-layer hybrid solvation model for electrostatics of biomolecules in an aqueous environment, and discuss the series solution in terms of Legendre polynomials. In Sections 3 and 4, semi-analytical and least squares methods for finding multiple image charge approximations are studied. In Section 5, extension to solvents with salt effects is considered. In Section 6, numerical results are given to show the performance of the proposed image methods. In Section 7, conclusions are made.
2 Three-layer solvation model in non-ionic solvents and its series solution
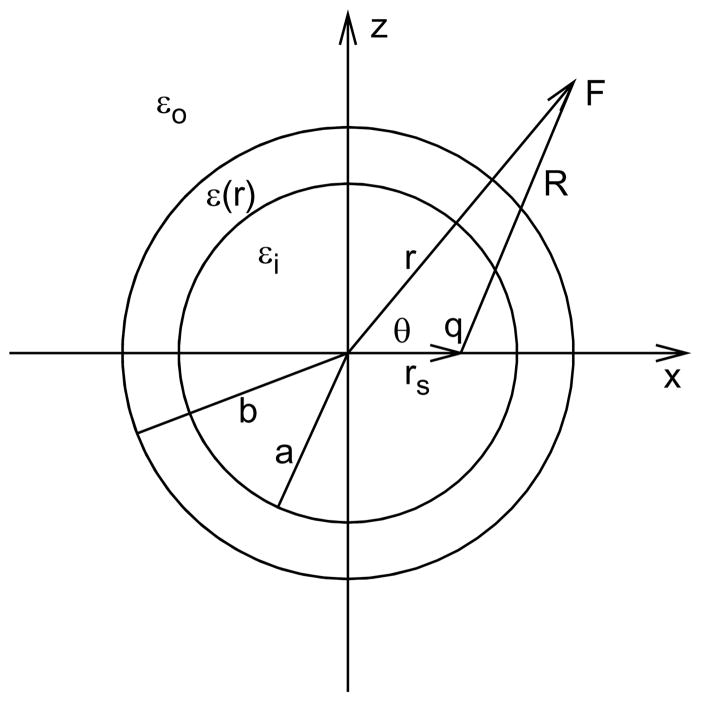
A three-layer hybrid solvation model is considered for the electrostatic interactions of biomolecules in a solvent, which partitions the solute/solvent system into three non-overlapping parts, as shown in Fig. 1. Inside the interior sphere (r ≤ a), the solute and solvent molecules are explicitly described by an array of fixed charges, and the dielectric constant εi is assumed to be the free-space permittivity or slightly greater (from 1 to 4). Outside the larger spherical cavity (r≥b), the bulk solvent is represented by a continuum medium with a high dielectric constant εo. The intermediate layer of implicit solvent between the two spherical surfaces is considered as a buffer zone [3,12] with a thickness h = b−a, and its dielectric permittivity ε(r) is assumed to be dependent on the radial distance from the origin. With this setting, the electrostatic potential Φ is given by the following Poisson equation:
| (2.1) |
| (2.2) |
| (2.3) |
where ρ1(r)= Σj qjδ(|r−rj|) is the charge distribution inside the interior cavity. Here rj is the location of charge qj, ∇ and Δ are gradient and Laplace operators, respectively.
Figure 1.
Schematic of a point charge q inside the interior sphere of the three-layer dielectric model.
Without loss of generality, using the linear superposition principle, we consider a single source charge q located on the x-axis at a distance rs from the center of the sphere (see Fig. 1); i.e., in Eqs. (2.1)–(2.3), the charge distribution ρ1(r)=qδ(|r−rs|), where rs =(rs,0,0) under a spherical coordinate system r= (r,θ,φ). Because of the azimuthal symmetry, the potential Φ(r,θ) in the exterior layer can be expressed as
| (2.4) |
where Pn(x) are Legendre polynomials of order n, and the constant coefficients An are to be determined.
On the other hand, for a field point r in the interior layer, i.e., 0≤r≤a, the potential due to the charge is the potential in free space q/(4πεi R), plus a reaction potential induced by the polarization of the dielectric medium (|r|>a):
| (2.5) |
where R is the distance between the field and source points,
By using the expansion of the reciprocal distance
| (2.6) |
the total potential inside the interior sphere can be rewritten as
| (2.7) |
In the intermediate layer with continuous dielectric constants ε(r), the potential at r is represented in the following form:
| (2.8) |
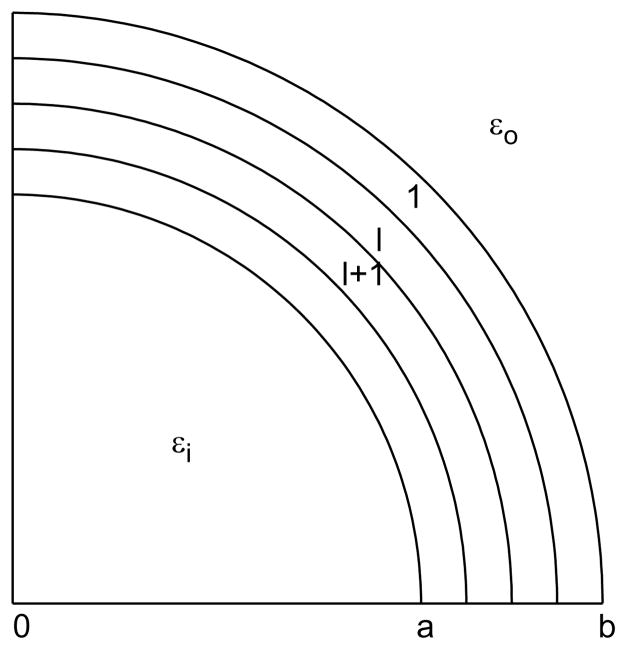
where coefficients Cn(r) and Dn(r) are continuous functions of r, which can be determined by two differential equations [37]. To obtain these equations, the buffer layer is decomposed into thin shells (Fig. 2) and at each shell the coefficients Cn, Dn, and dielectric permittivity ε(r) can be approximated by piecewise constants. Consider the l-th and (l+1)-th shells,
Figure 2.
The intermediate layer (a<r <b) is divided into several thin shells. The dielectric permittivity ε(r) in each shell can be considered as a constant.
| (2.9a) |
| (2.9b) |
By using the continuities of the potential and the flux normal to the interface
| (2.10a) |
| (2.10b) |
and the orthogonality of the Legendre polynomials, we have
| (2.11a) |
| (2.11b) |
For an infinitely thin shell, can be replaced by Cn(r+dr) and by Cn(r). The same steps can be taken for and εl, εl+1. As the function f (r+dr) can be expressed as
two coupled differential equations can then be obtained:
| (2.12a) |
| (2.12b) |
By multiplying Eq. (2.12a) by r2n+1, together with Eq. (2.12b), we obtain
| (2.13) |
By plugging Eq. (2.13) into Eq. (2.12), two second-order differential equations of Cn(r) and Dn(r) are obtained [37]
| (2.14a) |
| (2.14b) |
Based on these equations, a linear dielectric profile ε(r) = d1 +d2r is natural for making a continuous transition of the permittivity, where constants d1 and d2 can be determined by interpolating the values at interface r = a and r = b. However, the obtained functions Cn(r) and Dn(r), which can be represented by a Taylor series expansion, are inefficient for computations.
Therefore, we aim to construct a dielectric function in the layer such that all of Cn(r) and Dn(r) are linearly dependent. Note that if ε(r) satisfies in Eq. (2.2), then the potential holds
Then, by a simple transform, the potential in the layer can be expressed by
| (2.15) |
To match this result, the interpolation with two harmonic functions 1 and are used to obtain
| (2.16) |
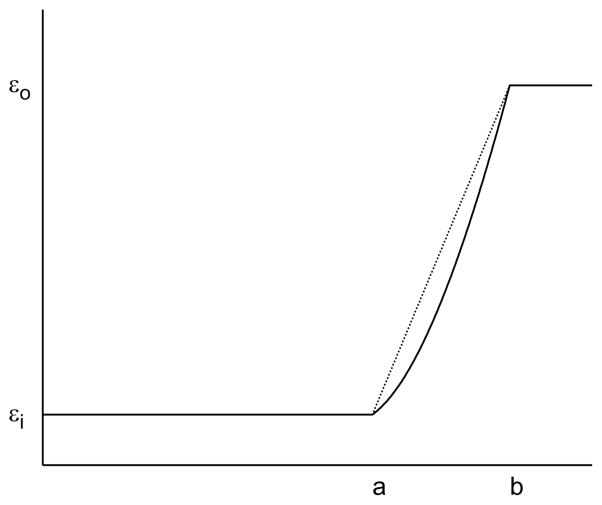
where α,β can be determined by the continuity of the dielectric permittivity at the interface (Fig. 3), say,
Figure 3.
Linear (dot line) and (solid line) dielectric profiles in the intermediate layer.
Together with Eqs. (2.5), (2.7) and (2.15), the expansion coefficients An,Bn,Cn and Dn can be determined by the continuities of the potentials and the fluxes normal to the boundaries, i.e.,
| (2.17a) |
| (2.17b) |
| (2.17c) |
| (2.17d) |
Using the orthogonality of Legendre polynomials, we can obtain An,Bn,Cn and Dn. We are only interested in the interior layer, where
| (2.18) |
and, T1 and T2 are given by
In particular, when h=0, it reproduces the Kirkwood’s result [25]:
| (2.19) |
3 Semi-analytical multiple image approximation for non-ionic solvents
We now turn to the problem of finding image charges outside the interior sphere to accurately approximate the reaction field expressed by the series expansion of the Legendre polynomials. It will be shown that with only a few image charges, rapid and accurate calculation of the reaction field can be achieved.
3.1 Line image approximation
To obtain a line image, we approximate the reaction field inside the sphere by truncating the Taylor series expansion at  (h2) in terms of the thickness h of the buffer layer as
| (3.1) |
where
and Ck for k = 1,···,4 are constants depending on a, h and γ:
By using formula (2.6), the first term in Eq. (3.1) is the contribution of an image charge at Kelvin image point ri = (ri,0,0), i.e.,
| (3.2) |
For the second term in (3.1), we have
| (3.3) |
To obtain an image formula of the third term in (3.1), we denote function
| (3.4) |
Multiplying both sides by and differentiating with respect to x, we have
| (3.5) |
Taking the integration from ri to ∞, due to f (r,x) → 0 as x → ∞, we transform the series into a line image:
| (3.6) |
Similarly, the fourth term in (3.1) can also be represented by a line image as follows. Let
| (3.7) |
| (3.8) |
Calculating the differentiation in g(r,x), we have
| (3.9) |
Multiplying g by x and taking the derivative with respect to x yields:
| (3.10) |
Again, taking the integration from x to ∞, because of
we get
| (3.11) |
with vector t = (t,0,0). With a simple calculation, we also have
| (3.12) |
We thus obtain the line image from the Kelvin point ri to infinity:
| (3.13) |
Finally, we obtain the image charge approximation to the reaction field, which consists of two Kelvin images plus two line images from the Kelvin point to the infinity, as,
| (3.14) |
where
and
3.2 Discretization of the line image charges
In order to discretize the line image charges into multiple point charges, we use a numerical quadrature rule to approximate the following integral
| (3.15) |
By changing variable with τ >0, we have,
| (3.16) |
where
| (3.17) |
We use the Gauss-Radau quadrature [9,15] which is based on Jacobi polynomials orthogonal on the interval (−1,1) with the weight function
i.e.,
| (3.18) |
where α >−1, β >−1. Take s0 = −1, α = (1 − γ)τ/2 − 1 and β = 0, and denote the Jacobi-Gauss-Radau points and weights by sm,ωm, for m = 0,1,2,···, M, which can be generated by the package ORTHPOL [20]. The integral I is then discretized as
| (3.19) |
Thus, for the line image charges, we have,
| (3.20) |
| (3.21) |
where
| (3.22) |
Therefore, multiple image charges approximation to the reaction field due to the point charge at rs is obtained:
where the derivative of the Kelvin image with respective to r can be expressed as:
| (3.23) |
4 Least squares multiple image approximation
An alternative to the semi-analytical approach is the least squares method to obtain the multiple image approximation. In this procedure, we fix the locations of all image charges as given in (3.22), and their strengths are to be determined by minimizing the least squares error with respect to the exact series solution. The advantage of this method is that the details of the functional form of an integrand does not affect the choice of the Gauss-quadrature points. Only the overall scaling properties of the function are important, but these are captured well knowing the analytical solution that was presented above (i.e. Jacobi-Gauss-Radau quadrature). Moreover, the least squares error method attempts to spread the error uniform throughout the cavity. The question we will answer, and demonstrated by numerical examples (see below) is: How will the least squares solution for the image charges compare to the semi-analytical method?
We first assume that the potential is given as follows:
| (4.1) |
The least squares method is used to find the charge strengths by minimizing the L2-error of the reaction potential induced by the discrete images,
| (4.2) |
where rn for n = 1,···, N are N field points inside the interior sphere. Our least squares procedure amounts to finding , such that
Taking the derivative with respective to ql,
we obtain a linear algebraic system with M equations:
The strengths of the image charges can then be determined by solving the linear system for each source charge inside the interior sphere. A table of image charges and their locations for discrete source points can be made for practical simulations, where the image charges at any location rs can be interpolated from the data in the table.
5 Multi-image approximation of reaction fields in ionic solvents
Extension of the three-layer model to solvents with salt effects is based on the following model,
| (5.1) |
| (5.2) |
| (5.3) |
where the Poisson equations for bulk solvents have been replaced by the Poisson-Boltzmann equations, and λ is the inverse Debye screening length.
The dielectric function ε(r) = (α+β/r)2 in the buffer layer (a ≤ r ≤ b) is still used as before. Again, only one source charge at location rs = (rs,0,0) for rs < a is considered, i.e., ρ1(r) = qδ(r − rs). Due to the azimuthal symmetry, the potential at an observation point r= (r,θ,φ) can be represented by
| (5.4) |
where in(r) and kn(r) are the first and the second kind of modified spherical Bessel functions [2] defined recursively by
| (5.5) |
and
| (5.6) |
The expansion coefficients Bn are determined by the continuity of the potentials and the fluxes normal to the boundaries (2.17a)–(2.17d), which are given by
| (5.7) |
where
| (5.8) |
| (5.9) |
Here,
| (5.10a) |
| (5.10b) |
| (5.10c) |
| (5.10d) |
and
With the analytical formula, the algorithm of using the least squares error approach to find the multiple image charges is the same as that of the case of pure water solvent. For the ionic solvent, we will show in the numerical examples that the accuracy of the image charge approximation based on the least squares approach does not depend on ionic strength, which was a limitation in our previous image method for ionic solvent using an analytical approach [15,43].
6 Numerical examples
In this section, we will numerically investigate the performance of the multiple image approximations of both semi-analytical and least squares approaches to the reaction field. Unless otherwise specified, the dielectric constants for the interior and exterior layers are set to be εi = 2 and εo = 80. Also, the single unit point charge (q = 1) is located on the x-axis inside the interior sphere at a distance rs < a from the common center of the two spheres. The radius of the interior sphere is assumed to be dimensionless, a = 1. For the least squares approach, we choose field points (r,θ,0) with uniform distribution for r =0, 0.1,···,0.8 and , and the cutoff error for calculating the exact reaction field is chosen to be 10−8, i.e.,
where the (N+1)-term and (N+2)-term are both less than this number.
6.1 Numerical results for pure water solvents
First, we compute the L2-norm relative error of both approaches with the thickness of the buffer zone set as h= b−a=0.1 and 0.01, where the error is defined by
| (6.1) |
for ΦRF(ri, θj) and Φ̂RF(ri, θj) being the reaction fields computed from the series solution and image approximation, respectively, and the points (ri, θj) chosen from [0,0.8] with a step 0.05 and [0,2π) with a step
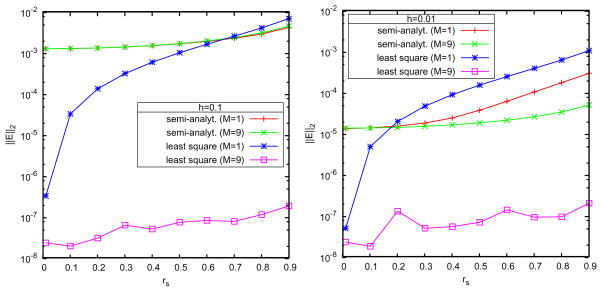
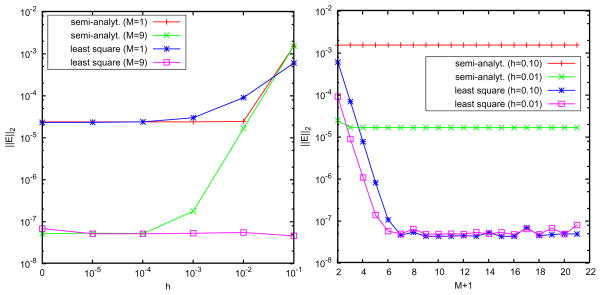
. The results are illustrated in Figs. 4 and 5. It can be seen that for relatively large h even using M+1 = 10 image charges, the semi-analytical approximation has error between 0.1% and 1%, and its performance is improved with the decrease of the thickness h according to the  (h2/a2) truncation error. In contrast, the error using the least squares approach is sharply reduced with the increase of the image number; when M = 9, it reaches a quite small magnitude around 10−5% for both h = 0.1 and 0.01 cases. These results show that the semi-analytical approach is usually acceptable in simulations, but in order to simulate a system requiring high accuracy, the least squares method should be used.
Figure 4.
Semi-analytical vs. least squares image charge methods. Accuracy of the reaction field for the source charge located rs = (rs, 0, 0) with discrete image charges number M+1 = 2 and 10 including the Kelvin image. Left: h=0.1; right: h=0.01.
Figure 5.
Semi-analytical vs. least squares image charge methods. Left: accuracy with the thickness of the buffer layer h = b − a with the source location rs = 0.4, using 2 and 10 discrete image charges; right: accuracy with the number of discrete image charges.
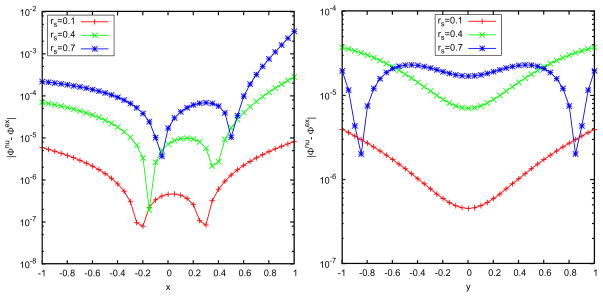
As shown in Fig. 5, we see that a small number of discrete image charges is enough to provide a high-accurate approximation to the reaction field, which shows the advantage of using the image method in comparison with directly truncating the series solution. For M =2, the error magnitude of the least squares approach has already reached 0.01%, and for M = 3, it is 0.001%. In Table 1, we list data of the positions and strengths of the image charges for different exterior dielectric constants and source locations. In Fig. 6, we plot the spatial distribution of the relative errors of the least squares image charge approximation along x- and y-axes, where two image charges are used and we can see the maximum error appears near the spherical boundary. Although the absolute deviation between the exact solution from the series expansion and the multiple image charge method based on least squares is always small, the sign of the deviations are sometimes positive or negative. Since the approximate solution is not always over-estimating or always under-estimating the exact solution, there will inevitably be places within the cavity that the two solutions will be exactly equal. When this happens the relative error is zero. The peaks (extra high accuracy) seen in Fig. 6 reflect regions where this accidental zero error situation occurs.
Table 1.
Locations and strengths of image charges by the least squares approach with a=1, h=0.1, εi = 2. The first image charge q1 is located at the Kelvin point x1, and the second image charge q2 with location x2.
| rs: source point charge location | |||||||||||
|---|---|---|---|---|---|---|---|---|---|---|---|
| εo | 0.01 | 0.1 | 0.2 | 0.3 | 0.4 | 0.5 | 0.6 | 0.7 | 0.8 | 0.9 | |
| 50 | q1 | −87.952 | −8.793 | −4.394 | −2.926 | −2.191 | −1.748 | −1.452 | −1.239 | −1.077 | −0.947 |
| x1 | 100.000 | 10.000 | 5.000 | 3.333 | 2.500 | 2.000 | 1.667 | 1.429 | 1.250 | 1.111 | |
| q2 | −24.725 | −2.479 | −1.250 | −0.845 | −0.647 | −0.533 | −0.462 | −0.417 | −0.392 | −0.387 | |
| x2 | 375.010 | 37.501 | 18.751 | 12.500 | 9.375 | 7.500 | 6.250 | 5.357 | 4.688 | 4.167 | |
| 60 | q1 | −89.364 | −8.935 | −4.465 | −2.973 | −2.226 | −1.777 | −1.476 | −1.260 | −1.096 | −0.964 |
| x1 | 100.000 | 10.000 | 5.000 | 3.333 | 2.500 | 2.000 | 1.667 | 1.429 | 1.250 | 1.111 | |
| q2 | −22.106 | −2.217 | −1.118 | −0.756 | −0.580 | −0.478 | −0.415 | −0.375 | −0.354 | −0.350 | |
| x2 | 371.846 | 37.185 | 18.592 | 12.395 | 9.296 | 7.437 | 6.197 | 5.312 | 4.648 | 4.132 | |
| 70 | q1 | −90.421 | −9.040 | −4.518 | −3.009 | −2.253 | −1.799 | −1.495 | −1.276 | −1.110 | −0.978 |
| x1 | 100.000 | 10.000 | 5.000 | 3.333 | 2.500 | 2.000 | 1.667 | 1.429 | 1.250 | 1.111 | |
| q2 | −20.122 | −2.018 | −1.018 | −0.689 | −0.529 | −0.436 | −0.379 | −0.343 | −0.324 | −0.322 | |
| x2 | 369.603 | 36.960 | 18.480 | 12.320 | 9.240 | 7.392 | 6.160 | 5.280 | 4.620 | 4.107 | |
| 80 | q1 | −91.246 | −9.123 | −4.559 | −3.037 | −2.274 | −1.816 | −1.509 | −1.289 | −1.121 | −0.988 |
| x1 | 100.000 | 10.000 | 5.000 | 3.333 | 2.500 | 2.000 | 1.667 | 1.429 | 1.250 | 1.111 | |
| q2 | −18.557 | −1.862 | −0.939 | −0.636 | −0.488 | −0.403 | −0.350 | −0.318 | −0.301 | −0.300 | |
| x2 | 367.929 | 36.792 | 18.396 | 12.264 | 9.198 | 7.359 | 6.132 | 5.256 | 4.599 | 4.088 | |
Figure 6.
Spatial distribution of the errors by using the least squares approximation with 2 discrete image charges. Left: 21 observation points on the x-axis; right: 21 observation points on the y-axis.
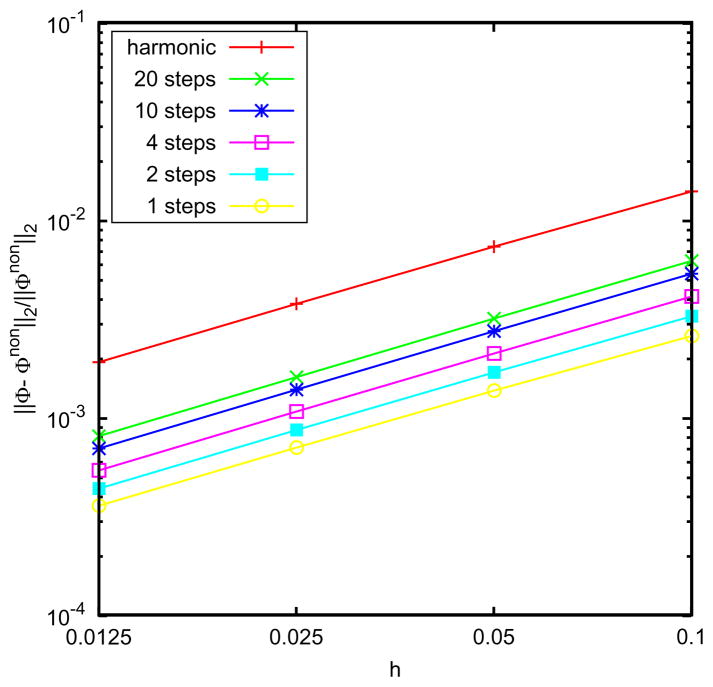
The proposed harmonic form for ε(r) shown in Fig. 3 allowed finding an analytical solution relatively easy, and its form is close to a linear interpolation. To observe how much difference there is from a model that linearly interpolates, the linear form is approximated using a certain number of uniform steps. The relative L2 errors for both the harmonic and discretized-stepped linear forms with respect to the analytical potential with no buffer zone are shown in Fig. 7. It is found that the relative errors within the inner sphere (r <a) are relatively small with respect to the original no-buffer layer model. In this sense, the exact details of the form of ε(r) seem not to matter much. On the other hand, on the scale of overall relative errors between the various models, it is clear that removing finite jumps in the dielectric constant is influential. More importantly, it is the unphysical characteristics near the boundaries that we are interested in removing. These results suggest that a continuous harmonic function has the advantage to maintain a continuous form for ε(r) within the buffer zone, which will eliminate unwanted artifacts near the boundary caused by discrete jumps, while providing similar results in the interior of the cavity as the no-buffer zone case.
Figure 7.
Relative L2 error of various models with different dielectric profiles in the buffer zone compared to the no-buffer zone model. For rs =0.4, the harmonic profile; and linear profile using n piecewise dielectric constants.
6.2 Numerical results for ionic solvents
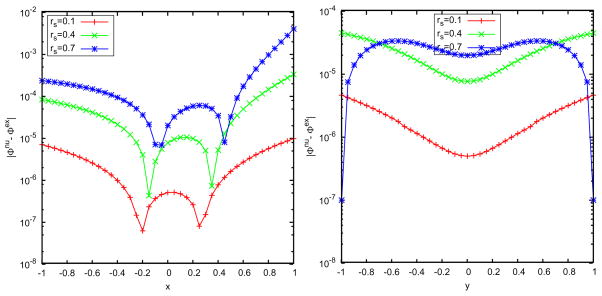
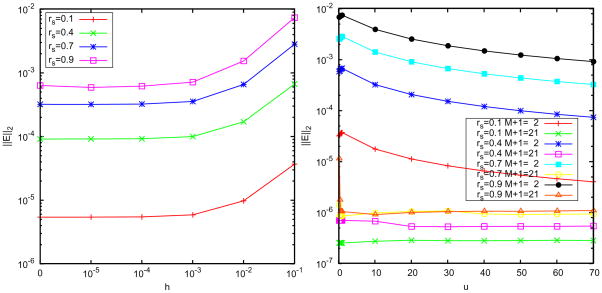
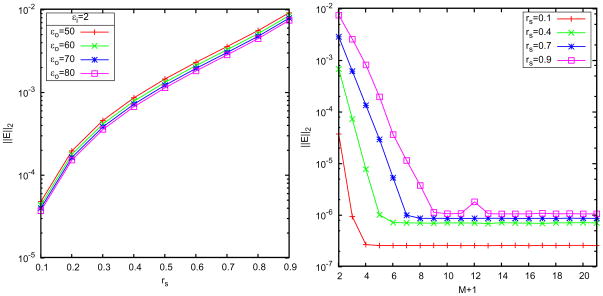
For the case of solvents with salt effects, we choose field points (r,θ,0) with uniform distribution for r=0,0.05,···,0.8 and during the least squares procedure. And the cutoff error of the exact reaction fields is chosen as 10−7. The results are illustrated in Figs. 8–10 where two image charges are used, the inverse Deybe length is fixed to equal 1 (i.e., u = λb = 1), and the buffer thickness is 0.1. Fig. 8 plots the error distribution in space along x- and y-axes and due to the same reason as in pure water, the approximate numerical potential matches the analytical potential at the spikes. Figs. 9 and 10 show the error versus the source location, the image charge number, the buffer thickness, and the ionic concentration. These results agree with those of the pure water case, and show the attractive accuracy of the least squares approach in approximating the series solution of the reaction field model. In particular, it can be seen in the right picture of Fig. 10 that the error of the multiple image charge approximation remains small for arbitrary ionic concentration, which dramatically improves our previous results on image charge approximations with the semi-analytical approaches [14, 15, 43], for two-layer dielectric model, where the accuracy of the semi-analytical image charge approximation is limited by not only the number of image charges but also by the ionic concentration. As a final note, the L2 errors we show is for a single point source. This error is the most relevant in comparing models because it is independent of system details. Nevertheless, we have not found any accumulated errors when the cavity consists of many source charges. In real applications, if anything, random error distribution works in the favor of the image method.
Figure 8.
Spatial distribution of the errors by using the least squares approximation with 2 discrete image charges for the three-layer model. Left: 21 observation points on the x-axis; right: 21 observation points on the y-axis.
Figure 10.
Error of the least squares approximation. Left: accuracy vs. the thickness of the of the buffer layer using 2 discrete image charges, right: accuracy vs. the ionic strength u.
Figure 9.
Relative error of the least squares approximation compared with the exact solution for the three-layer model. Left: accuracy vs. source charge location rs for different dielectric constants εo of bulk solvents; right: accuracy vs. the number of discrete image charges.
7 Conclusions
In this paper, we propose a three-layer dielectric solvation model for the electrostatic computation of biomolecules in solvents (with or without salt effects), where the dielectric profile within the buffer zone depends on the radial distance. The analytical solution in series form is obtained by generalizing the classical Kirkwood expansion. Two approaches for finding multiple image charges to approximate the reaction field are developed, and numerical examples are performed to validate the accuracy and effectiveness of the image charge methods. These mathematical investigations are the first step of the applicability of the three-layer model, for which a range of test and calibration, including selecting the optimal thickness of the buffer layer and a comparative study of accuracy and speed performances, are underway. Regardless of what is determined to be the optimal dielectric profile for minimizing artifacts near the boundary of the cavity, the method of multiple image charges will provide a computationally accurate and efficient representation of the reaction field. Moreover, the least squares method allows numerical solutions to be obtained with high accuracy when exact analytical forms are not possible to obtain nor easy to implement numerically.
Acknowledgments
The authors would like to thank the financial support provided by the National Institutes of Health (Grant No. 1R01GM083600-02). Z. Xu is also partially supported by the Charlotte Research Institute through a Duke Postdoctoral Fellowship. W. Cai and Z. Xu are also partially supported by the Department of Energy (Grant No. DEFG0205ER25678).
Contributor Information
Peihua Qin, Email: phqin@lsec.cc.ac.cn.
Zhenli Xu, Email: zxu7@uncc.edu.
Wei Cai, Email: wcai@uncc.edu.
Donald Jacobs, Email: djacobs1@uncc.edu.
References
- 1.Abagyan R, Totrov M. Biased probability Monte Carlo conformational searches and electrostatic calculations for peptides and proteins. J Mol Biol. 1994;235:983–1002. doi: 10.1006/jmbi.1994.1052. [DOI] [PubMed] [Google Scholar]
- 2.Abramowitz M, Stegun IA. Handbook of Mathematical Functions with Formulas, Graphs, and Mathematical Tables. Dover; New York: 1964. [Google Scholar]
- 3.Alper H, Levy RM. Dielectric and thermodynamic response of a generalized reaction field model for liquid state simulations. J Chem Phys. 1993;99:9847–9852. [Google Scholar]
- 4.Ambia-Garrido J, Pettitt BM. Free energy calculations for DNA near surfaces using an ellipsoidal geometry. Commun Comput Phys. 2008;3:1117–1131. [PMC free article] [PubMed] [Google Scholar]
- 5.Baker NA. Improving implicit solvent simulations: a Poisson-centric view. Curr Opin Struct Biol. 2005;15:137–143. doi: 10.1016/j.sbi.2005.02.001. [DOI] [PubMed] [Google Scholar]
- 6.Baker NA, Holst MJ, Wang F. Adaptive multilevel finite element solution of the Poisson-Boltzmann equation II. Refinement at solvent-accessible surfaces in biomolecular systems. J Comput Chem. 2000;21(15):1343–1352. [Google Scholar]
- 7.Belgov D, Roux B. Finite representation of an infinite bulk system - Solvent boundary potential for computer simulations. J Chem Phys. 1994;100:9050–9063. [Google Scholar]
- 8.Born M. Volumes and heats of hydration of ions. Z Phys. 1920;1:45–48. [Google Scholar]
- 9.Cai W, Deng S, Jacobs D. Extending the fast multipole method to charges inside or outside a dielectric sphere. J Comput Phys. 2007;223:846–864. doi: 10.1016/j.jcp.2007.09.001. [DOI] [PMC free article] [PubMed] [Google Scholar]
- 10.Cheng H, Greengard L, Roklin V. A fast adaptive multipole algorithm in three dimensions. J Comput Phys. 1999;155:468–498. [Google Scholar]
- 11.Cramer CJ, Truhlar DG. Implicit solvation models: Equilibria, structure, spectra and dynamics. Chem Rev. 1999;99:2161–2200. doi: 10.1021/cr960149m. [DOI] [PubMed] [Google Scholar]
- 12.Dai J, Tsukerman I, Rubinstein A, Sherman S. New computational models for electrostatics of macromolecules in solvents. IEEE Trans Magn. 2007;43:1217–1220. [Google Scholar]
- 13.Deng S. Electrostatic potential of point charges inside dielectric prolate spheroids. J Electrostat. 2008;66:549–560. doi: 10.1016/j.elstat.2008.06.003. [DOI] [PMC free article] [PubMed] [Google Scholar]
- 14.Deng S, Cai W. Discrete image approximations of ionic solvent induced reaction field to charges. Commun Comput Phys. 2007;2:1007–1026. [Google Scholar]
- 15.Deng S, Cai W. Extending the fast multipole method for charges inside a dielectric sphere in an ionic solvent: High-order image approximations for reaction fields. J Comput Phys. 2007;227:1246–1266. doi: 10.1016/j.jcp.2007.09.001. [DOI] [PMC free article] [PubMed] [Google Scholar]
- 16.Edsall JT, McKenzie HA. Water and protein. II. The location and dynamics of water in proteins and its relation to their stability and properties. Adv Biophys. 1983;16:53–183. doi: 10.1016/0065-227x(83)90008-4. [DOI] [PubMed] [Google Scholar]
- 17.Feig M, Brooks CL. III Recent advances in the development and application of implicit solvent models in biomolecule simulations. Curr Opin Struct Biol. 2004;14:217–224. doi: 10.1016/j.sbi.2004.03.009. [DOI] [PubMed] [Google Scholar]
- 18.Finkelstein AV. Electrostatic interactions of charged groups in an aqueous medium and their effect on the formation of polypeptide chain secondary structure. Mol Biol. 1977:627–634. [PubMed] [Google Scholar]
- 19.Friedman HL. Image approximation to the reaction field. Mol Phys. 1975;29:1533–1543. [Google Scholar]
- 20.Gautschi W. Algorithm 726; ORTHPOL- a package of routines for generating orthogonal polynomials and Gauss-type quadrature rules. ACM Trans Math Softw. 1994;20:21–62. [Google Scholar]
- 21.Havranek JJ, Harbury PB. Tanford-Kirkwood electrostatics for protein modeling. Proc Natl Acad Sci USA. 1999;96:11145–11150. doi: 10.1073/pnas.96.20.11145. [DOI] [PMC free article] [PubMed] [Google Scholar]
- 22.Hingerty BE, Ritchie RH, Ferrell TL, Turner JE. Dielectric effects in bio-polymers – the theory of ionic saturation revisited. Biopolymers. 1985;24:427–439. [Google Scholar]
- 23.Jha AK, Freed KF. Solvation effect on conformations of 1,2:dimethoxyethane: charge-dependent nonlinear response in implicit solvent models. J Chem Phys. 2008;128:034501. doi: 10.1063/1.2815764. [DOI] [PMC free article] [PubMed] [Google Scholar]
- 24.Juffer AH, Botta EFF, Vankeulen BAM, Vanderploeg A, Berendsen HJC. The electric-potential of a macromolecule in a solvent - a fundamental approach. J Comput Phys. 1991;97(1):144–171. [Google Scholar]
- 25.Kirkwood JG. Theory of solutions of molecules containing widely separated charges with special applications to awitterions. J Chem Phys. 1934;2:351–361. [Google Scholar]
- 26.Koehl P. Electrostatics calculations: latest methodological advances. Curr Opin Struct Biol. 2006;16:142–151. doi: 10.1016/j.sbi.2006.03.001. [DOI] [PubMed] [Google Scholar]
- 27.Lindell IV. Electrostatic image theory for the dielectric sphere. Radio Sci. 1992;27:1–8. [Google Scholar]
- 28.Lu BZ, Zhou YC, Holst MJ, McCammon JA. Recent progress in numerical methods for the Poisson-Boltzmann equation in biophysical applications. Commun Comput Phys. 2008;3:973–1009. [Google Scholar]
- 29.Neumann C. Hydrodynamische untersuchungen: Nebst einem anhange uber die probleme der elektrostatik und der magnetischen induktion. Teubner; Leipzig: 1883. pp. 279–282. [Google Scholar]
- 30.Norris WT. Charge images in a dielectric sphere. IEE Proc-Sci Meas Technol. 1995;142:142–150. [Google Scholar]
- 31.Okur A, Simmerling C. Hybrid explicit/implicit solvation methods. In: Spellmeyer D, editor. Annu Rep Comput Chem. Vol. 2. 2006. [Google Scholar]
- 32.Onsager L. Electric moments of molecules in liquids. J Am Chem Soc. 1936;58:1486. [Google Scholar]
- 33.Petraglio G. Nonperiodic boundary conditions for solvated systems. J Chem Phys. 2005;123:044103. doi: 10.1063/1.1955449. [DOI] [PubMed] [Google Scholar]
- 34.Ramstein J, Lavery R. Energetic coupling between DNA bending and base pair opening. P Natl Acad Sci USA. 1988;85:7231–7235. doi: 10.1073/pnas.85.19.7231. [DOI] [PMC free article] [PubMed] [Google Scholar]
- 35.Rubinstein A, Sherman S. Influence of the solvent structure on the electrostatic interactions in proteins. Biophys J. 2004;87:1544–1557. doi: 10.1529/biophysj.103.038620. [DOI] [PMC free article] [PubMed] [Google Scholar]
- 36.Shen MY, Freed KF. All-atom fast protein folding simulations: The villin headpiece. Proteins. 2002;49:439–445. doi: 10.1002/prot.10230. [DOI] [PubMed] [Google Scholar]
- 37.Sihvola A, Lindell IV. Polarizability and effective permittivity of layered and continuously inhomogeneous dielectric spheres. J Electrom Waves Appl. 1989;3:37–60. [Google Scholar]
- 38.Tanford C, Kirkwood JG. Theory of protein titration curves. I. General equations for impenetrable spheres. J Am Chem Soc. 1957;79:5333–5339. [Google Scholar]
- 39.Tironi IG, Sperb R, Smith PE, van Gunsteren WF. Generalized reaction field method for molecular dynamics simulations. J Chem Phys. 1995;102:5451–5459. [Google Scholar]
- 40.Wang J, Tan C, Tan YH, Lu Q, Luo R. Poisson-Boltzmann solvents in molecular dynamics simulations. Commun Comput Phys. 2008;3:1010–1031. [Google Scholar]
- 41.Wang L, Hermans J. Reaction field molecular dynamics simulation with Friedman’s image method. J Phys Chem. 1995;99:12001–12007. [Google Scholar]
- 42.Warshel A, Levitt M. Theoretical studies of enzymic reactions: dielectric, electrostatic and steric stabilization of the carbonium ion in the reaction of lysozyme. J Mol Biol. 1976;103:227–249. doi: 10.1016/0022-2836(76)90311-9. [DOI] [PubMed] [Google Scholar]
- 43.Xu Z, Deng S, Cai W. Image charge approximations of reaction fields in solvents with arbitrary ionic strength. J Comput Phys. 2009;228:2092–2099. doi: 10.1016/j.jcp.2008.11.023. [DOI] [PMC free article] [PubMed] [Google Scholar]


