Abstract
The need for alternatives to animal based skin sensitization testing has spurred research on the use of in-vitro, in silico and in chemico methods. Glutathione and other select peptides have been used to determine the reactivity of electrophilic allergens to nucleophiles, but these methods are inadequate to accurately measure rapid kinetics observed with many chemical sensitizers. A kinetic spectrophotometric assay involving the reactivity of electrophilic sensitizers to nitrobenzenethiol was evaluated. Stopped flow techniques and conventional UV spectrophotometric measurements enabled determination of reaction rates with half-lives ranging from 0.4 ms (benzoquinone) to 46.2 s (ethyl acrylate). Rate constants were measured for 7 extreme, 5 strong, 7 moderate and 4 weak/non-sensitizers. 17 out of the 23 tested chemicals were pseudo-first order and 3 were second order. In 3 out of the 23 chemicals, deviations from first and second order were apparent where the chemicals exhibited complex kinetics whose rates are mixed order. The reaction rates of the electrophiles correlated positively with their EC3 values within the same mechanistic domain. Nonsensitizers such as benzaldehyde, sodium lauryl sulfate and benzocaine did not react with nitrobenzenethiol. Cyclic anhydrides, diones and aromatic aldehydes proved to be false negatives in this assay. The findings from this simple and rapid absorbance model show that for the same mechanistic domain, skin sensitization is driven mainly by electrophilic reactivity. This simple, rapid and inexpensive absorbance based method has great potential for use as a preliminary screening tool for skin allergens.
Introduction
Skin sensitization to chemicals present in consumer products and the workplace continues to be a major concern. Although current regulatory guidelines call for the identification of skin sensitizers to be performed through the murine local lymph node assay (LLNA) (1), the Buehler test (2) and the guinea-pig maximization test (GPMT) (3), which are all animal based, there is impetus within industry and EU regulatory authorities to develop alternative non-animal based methods wherever possible. Alternative methods utilizing chemical reactivity of test chemicals as end point toxicology assays have been proposed using current mechanistic understanding of the chemical and biological basis of skin sensitization (4). From a skin sensitization perspective, understanding and predicting early allergenic events, such as protein haptenation, is critical as discussed by Schultz et al(5). A major and common factor in chemical induced skin sensitization is the ability of a chemical, either as such or after ex/in cutaneo activation, to covalently react with a carrier protein or peptide (6) resulting in an immunogenic complex. This reactivity of chemicals to cutaneous proteins is the basis for most, if not all, current non-animal based methods. While the complete proteinaceous constituents of the skin is yet to be delineated (7), development of in-chemico methods, premised on protein haptenation, as endpoint skin sensitization predictive assays has shown promise. The interaction of skin sensitizers with proteins, peptides and model nucleophiles representing cutaneously available proteins has been reported to be predominantly covalent bonding between electrophiles (E+) and nucleophiles. For example, irreversible binding of dinitrochlorobenzene (DNCB), a known electrophilic skin sensitizer, to human serum albumin, cytokeratin 14 and cofilin (8) was demonstrated to be the rate determining step in skin sensitization for DNCB. The reactivity of electrophilic chemicals to glutathione was exploited by Schultz et al. (9) with the determination of the RC50 value being the marker of the potency of a chemical. RC50 was defined as the concentration of electrophile required to deplete 50% of the thiol group on glutathione (GSH) in 2 h. The peptide depletion assay developed by Gerberick at al. (10;11) reported the identification of chemicals as skin sensitizers based on their ability to deplete GSH and nucleophilic hepta-peptides. This method (10) measured depletion of the peptides after treatment with excess electrophile for 24 h and adopted the percent depletion (dp) as the reactivity index of a given chemical. As a modification to the peptide reactivity assay (10) quantitative LC-MS was exploited by Natsch et al. (12) to characterize adduct formation as well as oxidation of the heptapeptide Cor1-C420 by skin sensitizers. Further modifications (6;13) on the original HPLC assay (10) and the work of Natsch et al. (12) were performed by generating data on dp values based on varying initial concentrations (E0) of the suspect compounds. Both the derivation of the RC50 (2 h assay) (9) and dp (24 h assay) (10) values as reactivity indices, while promising as skin sensitizing predictive methods, do not adequately capture the nature of the chemical kinetics involved in these electrophile-nucleophile interactions. RC50 and dp values measured at fixed time points using initial test compound concentrations result in imprecise rate constants as different chemicals with different reactivities are bound to give complete depletion of the peptides after several hours. The initial reaction and chemical kinetics involved have a bearing on whether the reaction with the peptide is going to be linear or not throughout its duration, an aspect that is overlooked by both the glutathione and peptide reactivity assays. A recent review proffers a detailed argument on the shortcomings of these assays (6).
The high throughput kinetic profiling (HTKP) method reported by Roberts and Natsch (14) improved the earlier assays and addressed some of the pitfalls with respect to reaction times and deviations by some sensitizers from ideal behavior. The HTKP method compiled data on the depletion of the thiol group of the hepta-peptide Ac-RFAACAA. To address the range of reaction times, measurements of peptide depletion were done at several different time points for varying initial concentrations (E0) of the sensitizers. Models were proposed to compensate for the “drowning out effect”(14) and loss of test chemicals due to evaporation. Despite these improvements the HTKP model still failed to accurately measure the kinetics of very reactive compounds like 2-methyl-4-isothiazolinone and benzoquinone (14).
In this paper, we present a novel kinetic spectrophotometric chemoassay for the assessment of skin sensitizers by reactivity toward 4-nitrobenzenethiol (NBT). Stopped flow techniques and conventional UV absorbance measurements were used to determine rate constants of reactions ranging from seconds to hours to reach completion. Data generated from this simple and rapid absorbance model is correlated with LLNA derived skin sensitization potency within the same mechanistic domain.
Materials and Methods
Chemicals
Phosphate buffer, acetic acid, sodium acetate, acetonitrile (ACN), acetone, 4-nitrobenzenethiol (NBT) and all test chemicals were purchased from Sigma Chemical Co. (St. Louis, MO).
UV/Vis Spectroscopy
Absorbance measurements were carried out on a Beckman DU 800 Spectrophotometer using quartz cells with calibrated 1 cm path lengths. Experiments were carried out at 25°C with temperature being controlled by a VWR Scientific circulating water bath.
Stopped-Flow Studies
Rapid reactions were performed on a Hitech Scientific SF-61DX2 double-mixing stopped-flow spectrophotometer with an F/4 Czerny-Turner MG-60 monochromator and a spectra scan control unit. The signal from the spectrophotometer was amplified and digitized via an Omega Engineering DAS-50/1 16-bit A/D board interfaced to a computer for storage and data analysis. Reaction progress was followed by monitoring the loss of free thiol on NBT at 412 nm, where it has its highest molar absorptivity coefficient (ε).
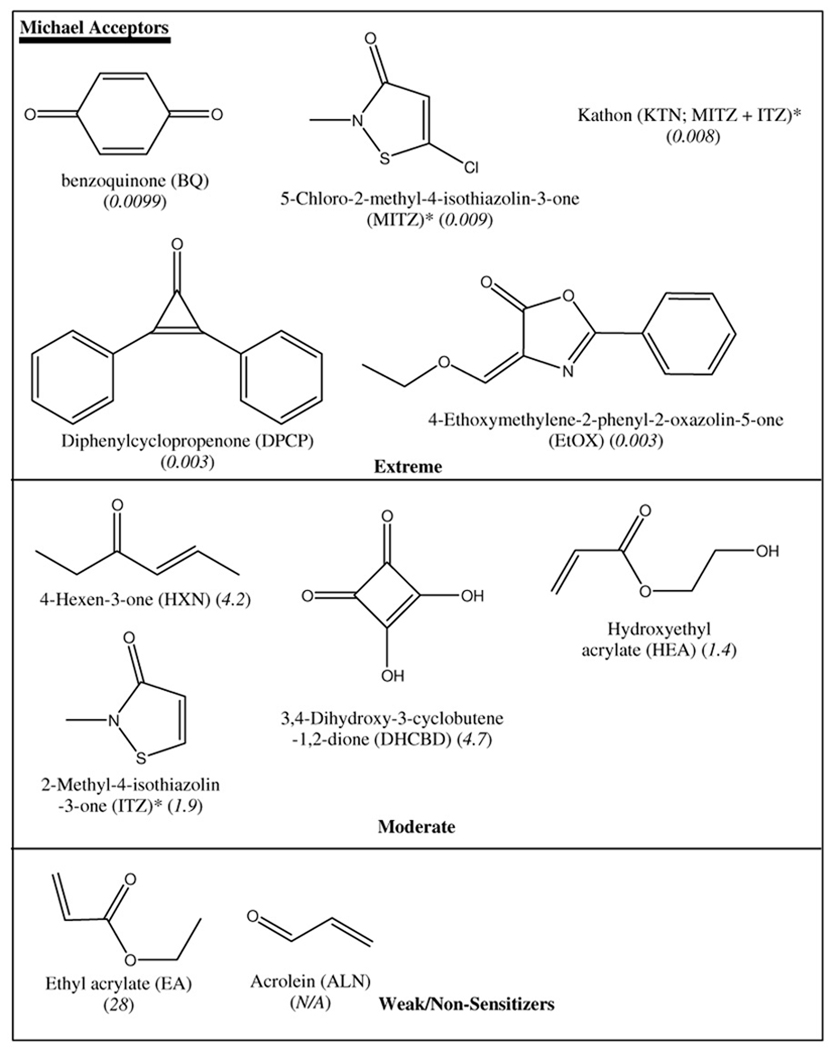
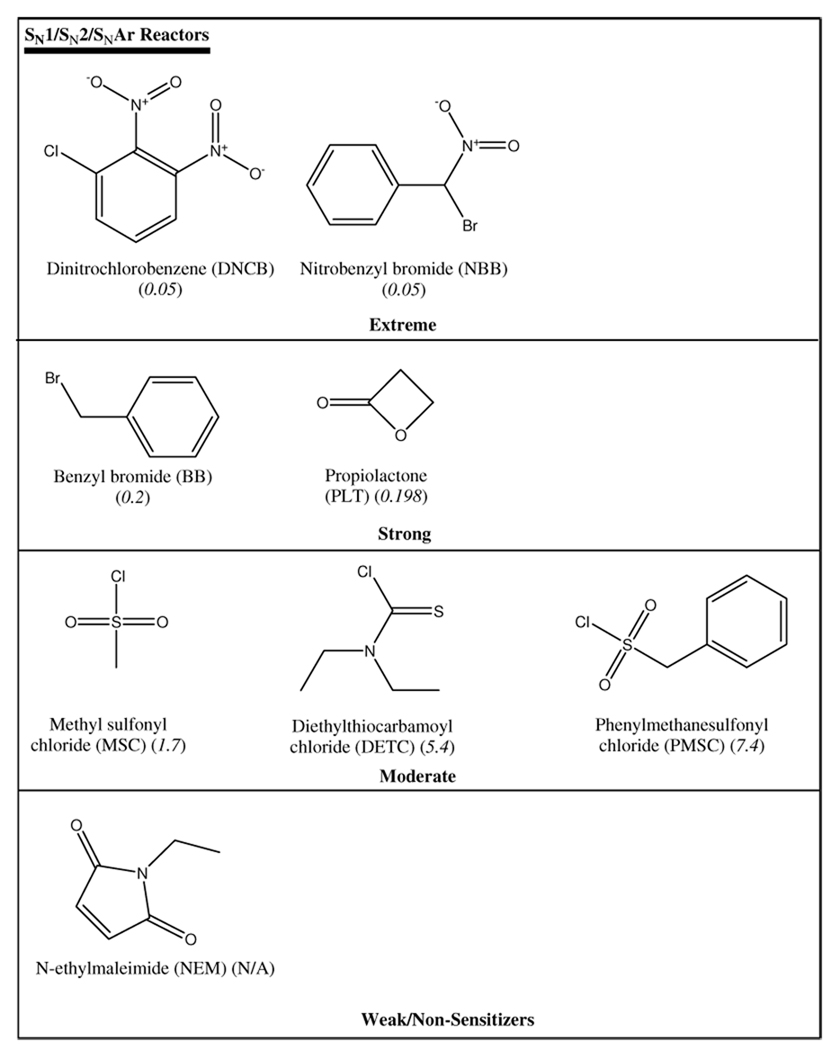
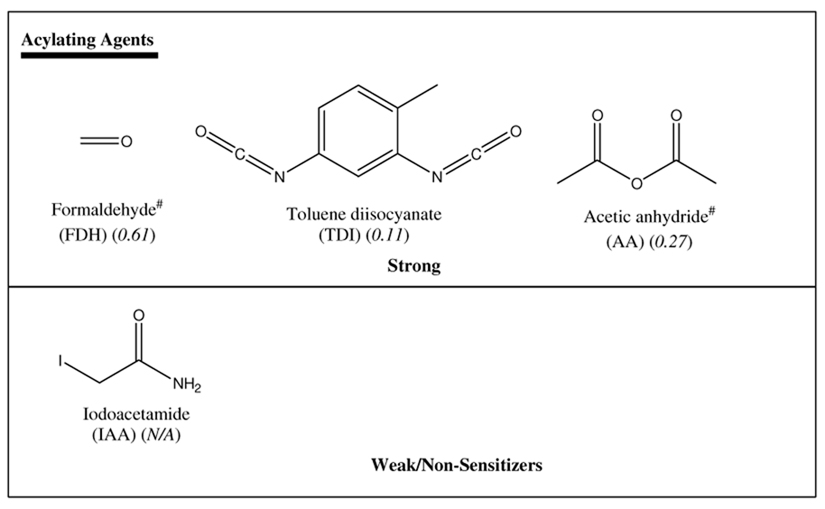
Test chemicals were dissolved in acetonitrile (and acetone for TDI and DPCP) at concentrations ranging from 0.01 to 10 mM. These solutions (5 µL) were combined with 5 µL of 0.1 mM NBT in phosphate buffer (pH 7.4) in a sealed reaction cell with rapid mixing. Absorbance readings were collected after a dead time of 1 ms. Control experiments contained acetonitrile and phosphate buffer only to determine background absorbance. Five replicates were performed for each chemical at each concentration. The temperature was maintained at 25°C in the observation cell with a VWR Scientific circulating water bath. Twenty known dermal sensitizers and 3 non-sensitizers (Table 1) were used to evaluate the potential of this kinetic assay for identification of contact allergens.
Table 1.
Test chemicals that were reacted with NBT.
 |
 |
 |
Results
Depletion of the highly absorbing chromophore, NBT, was measured after rapid mixing with test electrophiles. For every mole of NBT reacted one mole of the electrophile was consumed assuming that the reactions were all going in the forward direction and to completion. TDI was an exception with two electrophilic centers that are amenable to thiol attack. Change in absorbance of the NBT with time was hence used to calculate the amount of free thiol remaining at time t, [NBT]t, by using the following equation
| (1) |
where ANBTt is the absorbance of the chromophore NBT at time t and ε (11,068 ± 126 M−1cm−1) is its absorptivity co-efficient where the path length is 1 cm.
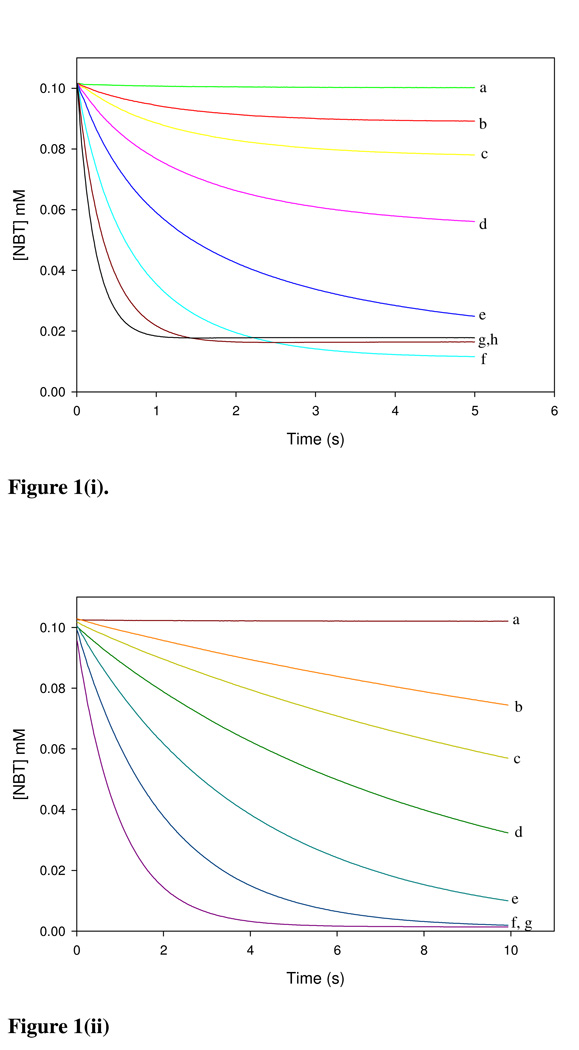
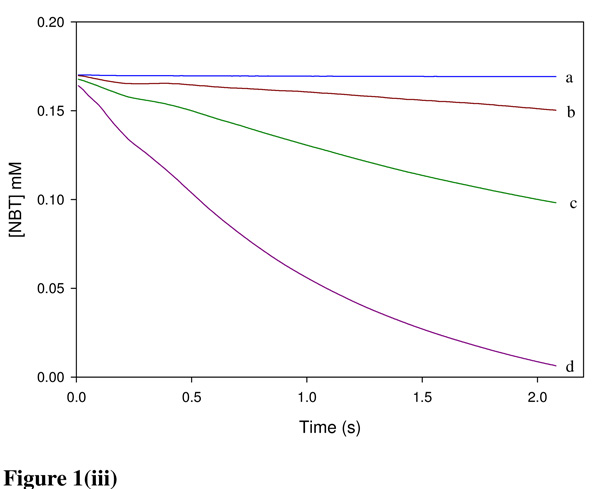
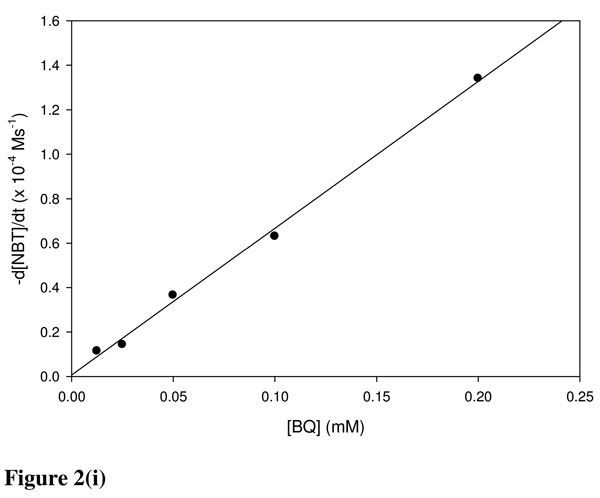
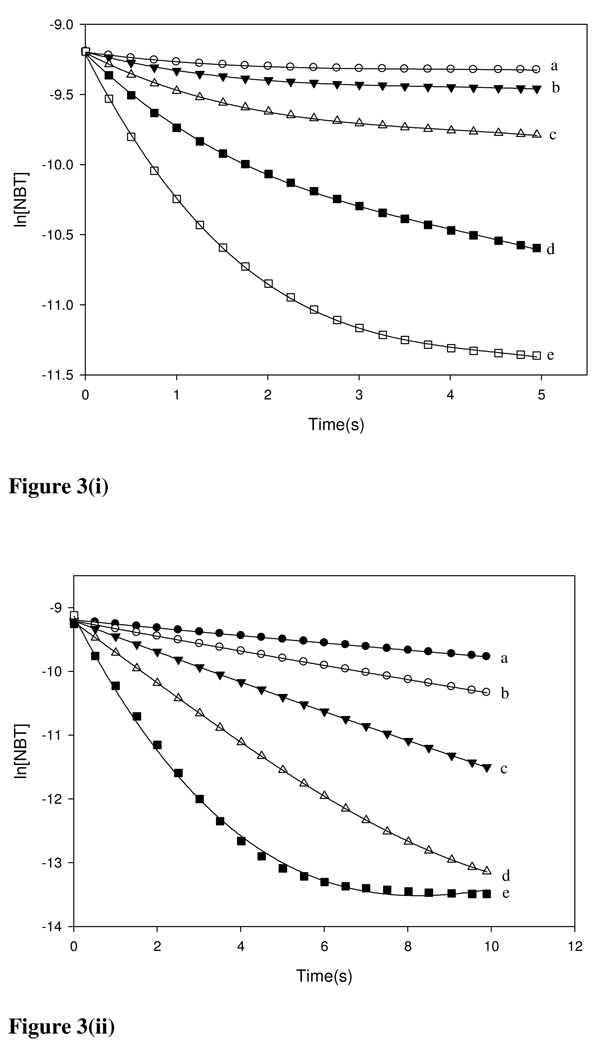
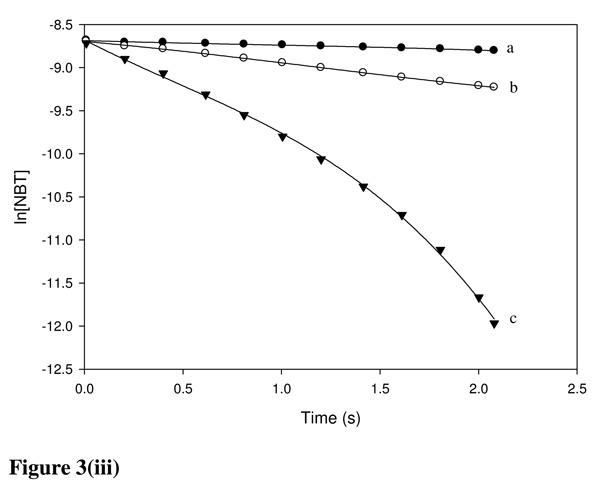
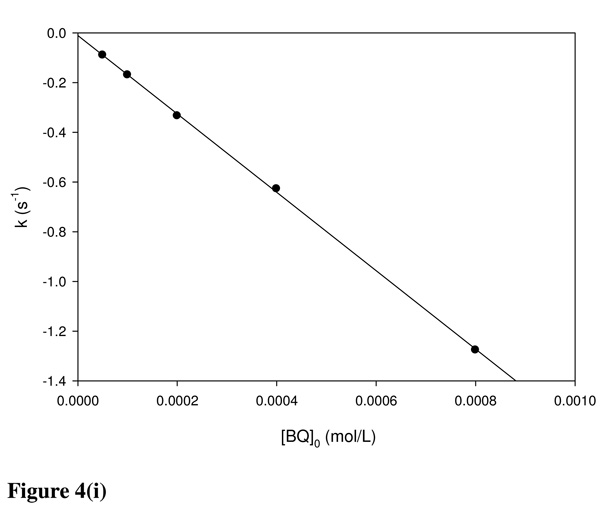
Chemicals were classified into three mechanistic domains which are (i) Michael acceptor, (ii) SN1/SN2 reactants and (iii) acylating agents. Figures 1(i–iii) show the depletion of NBT during reaction with BQ, NBB and TDI representing the Michael acceptor, SN1/SN2 reactants and acylating agents, respectively. Where the electrophile was in excess over NBT the time taken for the E+-NBT reaction to reach completion ranged from <1 s (BQ) to >1 h (EA).
Figure 1.
(i) Reaction of BQ with NBT in 50% acetonitrile in a pH 7.4 phosphate buffer at 25 °C. Absorbance readings were performed at 412 nm. Using [NBT]0 = 0.1 mM. BQ concentrations were varied from (a) 0.0 mM (b) 0.0125 mM (c) 0.025 mM (d) 0.05 mM (e) 0.1 mM (f) 0.2 mM (g) 0.4 mM (h) 0.8 mM. (ii) NBB was reacted with 0.1mM NBT in a phosphate buffered 50% acetonitrile. Initial NBB concentrations were (a) 0.0 mM (b) 0.1 mM (c) 0.25 mM (d) 0.5 mM (e) 1 mM (f) 2 mM (g) 4 mM. (iii) NBT at a concentration of 0.1 mM was reacted with {(a) 0 (b) 0.01 (c) 0.02 (d) 0.05} mM TDI in acetone.
Kinetic studies were based on the working hypothesis that nucleophilic attack (by the NBT thiol group) on electron deficient centers on the test chemical, leading to adduct formation were the major reaction pathways. The order (with respect to E+) and apparent rate constants (k0 = −ka[NBT]0) were determined as the slope of the plot of several initial rates (R) against several [E+]0 for a fixed concentration of NBT.
| (2) |
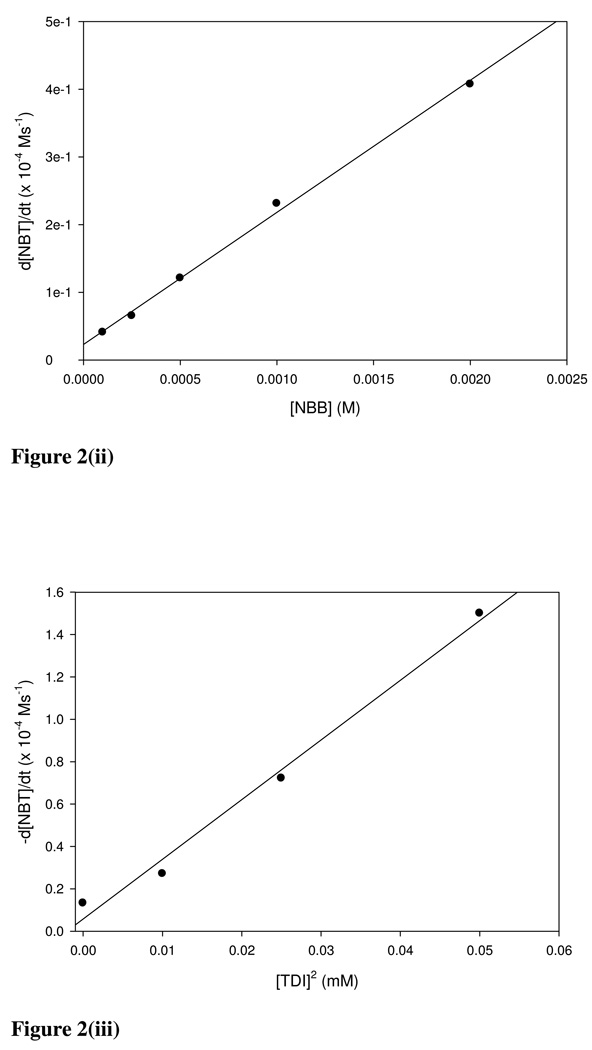
As an illustrative example of the Michael acceptor domain the initial rate plot for BQ is shown in Figure 2(i). A good linear fit was obtained for several [E+]0 values and shows that the reaction is first order with respect to BQ. Using the apparent rate constants (k0) the calculated rate constants (k) for BQ and other chemicals in the same domain are listed in Table 2a for a fixed [NBT]. The order of the reaction with respect to the electrophiles is also listed in Table 2a. Nitrobenzyl bromide is used as an example of the SN1/SN2 reactivity domain. Plotting initial rates against several initial NBB concentrations resulted in a good linear fit (Figure 2(ii), r2 = 0.997) and confirmed pseudo-first order kinetics of the reaction of NBB with NBT. Table 2b gives the calculated rate constants and reaction orders for NBB and other SN1/SN2 type reactants.
Figure 2.
Initial rate vs [E+] plots for (i) BQ, (ii) NBB and (iii) TDI. The rate constants are calculated from the slope of the [E+] vs initial rate for NBT depletion.
Table 2.
Rate constants and reaction order derived from the initial rate methods for the (a) Michael acceptor (b) SN1/SN2 and (c) Acylating agents Domains.
| (a) | |||
|---|---|---|---|
| Chemical | k (s−1) | r2 | Order |
| BQ | 0.696 | 0.996 | 1 |
| KTN* | 0.022 | 0.933 | 2 |
| MITZ* | 0.039 | 0.947 | 2 |
| EA | 1.7 × 10⁻⁶ | 0.96 | 1 |
| ITZ | 0.0023 | 0.978 | 1 |
| HEA | 6.1 × 10⁻⁶ | 0.95 | 1 |
| ALN | 2 × 10⁻⁵ | 0.992 | 1 |
| HNN | 2 × 10⁻⁴ | 0.989 | 1 |
| DPCP | 3 × 10⁻⁶ | 0.99 | 1 |
| DHCBD | 2 × 10⁻⁵ | 0.98 | 1 |
| EtOX* | 6 × 10⁻⁶ | 0.956 | 2 |
| (b) | |||
| Chemical | k (s−1) | r2 | Order |
| BB | 0.06 | 0.987 | 1 |
| NBB | 0.114 | 0.986 | 1 |
| MSC* | 0.0012 | 0.985 | 2 |
| NEM | 0.01 | 0.991 | 1 |
| DETC | 8.7 × 10⁻⁶ | 0.997 | 1 |
| PMSC | 9 × 10⁻⁶ | 0.993 | 1 |
| PLN | 1 × 10⁻⁵ | 0.998 | 1 |
| DNCB# | 2.1 × 10⁻⁵ | 0.993 | 1 |
| (c) | |||
| Chemical | k (s−1) | r2 | Order |
| TDI* | 0.002 | 0.989 | 2 |
| FDH | 0.003 | 0.982 | 1 |
| IAA* | 3 × 10⁻⁷ | 0.997 | 2 |
| AA | 0.0025 | 0.979 | 1 |
The r2 values are for the [E+] vs initial rate of NBT depletion under pseudo-first order conditions.
KTN, MITZ, EtOX, TDI, MSC and IAA was able to fit second order plots.
DNCB has been known to react via an SNAr reaction.
Three electrophiles which included TDI, FDH and IAA were evaluated as acylating agents and the linear plot for TDI is given in Figure 2(iii). The rate constants are shown in Table 2c. Pseudo-first order kinetics was not observed with IAA, MSC, TDI, KTN, MITZ and EtOX. However the data for IAA, TDI and MSC was able fit a second order plot where the initial rates were plotted against [E+]2. KTN, MITZ and EtOX exhibited complex behavior that fitted poorly into second order plots.
Full Kinetics
The extent of the E+-NBT reaction in terms of the depletion of NBT was measured at different time intervals (seconds or minutes) depending on the reaction rate. Data from complete reactions for all the chemicals in the three domains was evaluated to obtain the overall rate constants. Pseudo-first order conditions were used with the E+ in excess over the NBT. For the overall reaction the NBT depletion data for several initial concentrations of the electrophiles (E+) was fitted into the following integrated rate law for equation (2)
| (3) |
where k’ = ka[E+]0. The value of the pseudo-first order rate (ka) was then calculated for given [E+]0 values. Pseudo-first order plots for BQ, NBB and TDI are given in Figures 3(i–iii) as examples of the reactivity of chemicals in the Michael acceptor, SN1/SN2, and acylating agents domains, respectively. In cases where linear curve fitting was not possible, quadratic regression was used and the × co-efficient was adopted as the slope (k’) as has been reported by Roberts and Natsch (14). Tables 3(a–c) list all the ka values obtained for the three domains for varying [E+]0 values.
Figure 3.
Pseudo-first order plots for (i) BQ, (ii) NBB and (iii) TDI representing the Michael acceptor, SN1/SN2 and acylating domains respectively. Data obtained from full kinetics were used to plot the depletion of NBT with time.
Table 3.
(a). Rate constants and for the (a) Michael acceptor (b) SN1/SN2 and (c) Acylating agents domains.
| (a) | ||||
|---|---|---|---|---|
| Chemical | ka (s−1) | ks (s−1) | t1/2 (s) | ki (s−1) |
| BQ | 1660 ± 86 | 1576.5 | 0.00044 | 0.0106 |
| KTN | 58.6 ± 5.3 | 51.46 | 0.013 | 0.0005 |
| MITZ | 193 ± 6 | 196 | 0.0035 | 6 × 10⁻⁵ |
| ITZ | 7.2 ± 1.3 | 6.7 | 0.096 | 2 × 10⁻⁵ |
| EA | 0.018 ± 0.002 | 0.015 | 46.2 | 1 × 10⁻⁵ |
| HEA | 0.053 ± 0.01 | 0.047 | 14.7 | 8 × 10⁻⁵ |
| ALN | 0.16 ± 0.02 | 0.1 | 4.95 | 5 × 10⁻⁵ |
| HNN | 0.418 ± 0.13 | 0.37 | 1.66 | 0.0089 |
| DPCP | 1105 ± 96 | 1083 | 0.00063 | 2 × 10⁻⁵ |
| DHCBD | 0.189 ± 0.02 | 0.175 | 3.67 | 3 × 10⁻⁶ |
| EtOX | 1290 ± 117 | 1343 | 0.00054 | 8 × 10⁻⁴ |
| (b) | ||||
| Chemical | ka (s−1) | ks (s−1) | t1/2 (s) | ki (s−1) |
| BB | 248 ± 24.5 | 246.8 | 0.0028 | 0.0006 |
| NBB | 1280 ± 123 | 1170 | 0.00059 | 0.0074 |
| MSC | 21.4 ± 6.0 | 15.0 | 0.046 | 0.0041 |
| NEM | 37.1 ± 12.6 | 34.9 | 0.020 | 6 × 10⁻⁶ |
| DETC | 6.21 ± 0.74 | 7.64 | 0.091 | 0.0002 |
| PMSC | 1.92 ± 0.34 | 2.2 | 0.36 | 4 × 10⁻⁵ |
| PLN | 71.4 ± 7.3 | 84.6 | 0.0097 | 3 × 10⁻⁵ |
| DNCB | 0.87 ± 0.20 | 0.93 | 0.75 | 2 × 10⁻⁶ |
| (c) | ||||
| Chemical | ka (s−1) | ks (s−1) | t1/2 (s) | ki (s−1) |
| TDI | 20.1 ± 3.4 | 25.5 | 0.027 | 0.11 |
| FDH | 0.93 ± 0.78 | 8.3 | 0.075 | 0.013 |
| IAA | 3.53 ± 0.71 | 6.3 | 0.11 | 3 × 10⁻⁵ |
| AA | 11.76 ± 1.64 | 12.07 | 0.059 | 5.3 × 10⁻³ |
Rate constants ka were derived from the overall kinetics for the E+-NBT reactions using equation 3. Rate constants ks and ki were determined as the slope and intercept of the linear plot of [E+] vs k’ according to the integrated rate equation 3.
Elimination of possible depletion of NBT from competing side reactions such as oxidation and disulfide formation was achieved by varying initial [E+]0 and then plotting the slopes (−ks[E+]0), obtained from plots of data fitted into equation (3) against [E+]0. Pseudo first order kinetics for overall NBT loss were calculated on the basis of the E+-NBT reaction while assuming the loss of NBT due to side reactions such as oxidation/disulfide formation to be negligible (ki ≪ ks) within the overall reaction time.
| (4) |
Thus the equation was reduced to
| (2) |
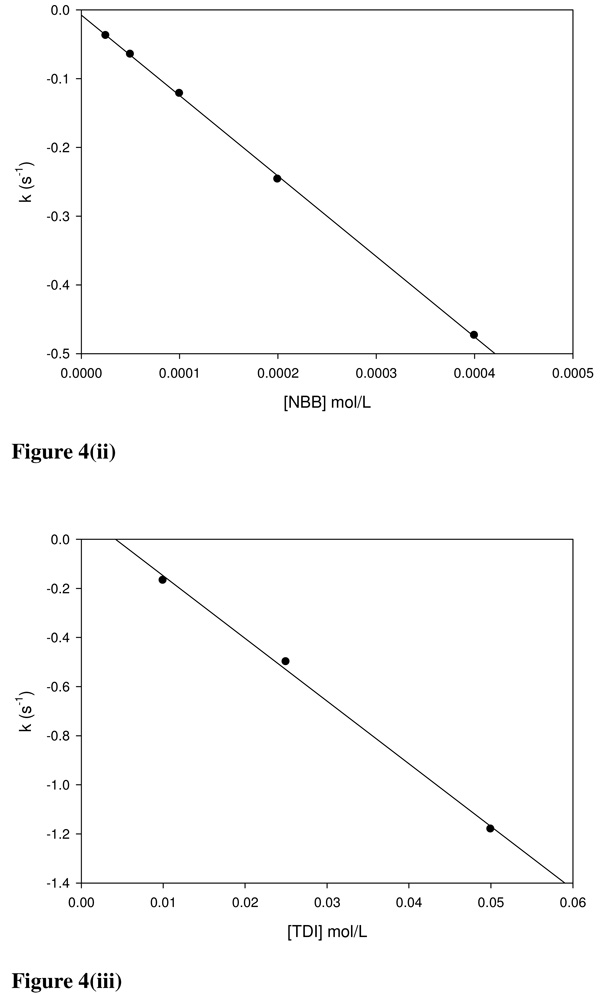
In cases where the NBT-E+ reactions adhered to pseudo-first order conditions the pseudo-first order rate constant (ks = −ka[E+]0) was calculated as the slope of the resultant linear curve ([E+]0 vs −ka[E+]0) and the pseudo-first order rate constant ki for the side reaction was the intercept. Linear plots for BQ, NBB and TDI are given in Figures 4(i–iii). The values of ks and ki obtained using this method are listed in Table 3(i–iii) for comparison with ka values. The values of the rate constants ka and ks were not significantly different between each chemical in all test mechanistic domains even though the graphing method also resulted in the determination of ki values.
Figure 4.
Linear plots for k’ (−ks[E+]0) vs (i) [BQ], (ii) [NBB] and (iii) [TDI]. The ks values obtained from the slopes of the linear plots were agreeable to the ka values obtained using equation 3. The intercepts of the linear plots are the rate constants (ki) for any competing reactions.
Deviations from ideal pseudo-first order conditions were observed with KTN, EtOX, MITZ, TDI, IAA and MSC. TDI-NBT experiments were performed in acetone. Attempts to perform the reactions in either pure ACN or 1:1 ACN/PB resulted in immediate TDI precipitation. The closed reaction chamber of the stopped flow prevented evaporative loss of both the TDI and acetone. The relatively large ki (0.11 s−1) for TDI (Table 4c) is indicative of a side reaction occurring concurrently with the NBT-TDI reaction.
Discussion
Development of alternative approaches to replace in vivo assays in skin sensitization testing is an important research area to protect the public from hazardous chemicals. A number of promising in vitro, in chemico and in silico assays have been reported and progress noted so far is due to the improved understanding of the skin sensitization processes at the molecular level (15). This study avails a simple spectrophotometric method capable of measuring rapid kinetics of common skin sensitizers with a select thiol based nucleophile. Using stopped flow and conventional UV-Vis absorbance spectrophotometry, kinetics of 23 electrophilic chemicals reactivity to NBT were determined. Reactions ranged from very fast (BQ; t1/2 = 0.4 ms) to slow (EA; t1/2 = 46.2 s). The depletion of NBT, which has a high absorptivity coefficient at 412 nm was studied under pseudo-first order conditions. The use of acetonitrile and acetone (in the case of TDI and DPCP) combined with a phosphate buffer eliminated the ‘drowning out effects’ which Roberts and Natsch (14) observed with the HTKP assay. Solubility incompatibilities between the peptide and chemicals sometimes resulted in ‘drowning out effects’ of the chemicals (14). Inconsistencies due to the ‘drowning out effect’ often result in discordant data for the same reactions. The model used herein benefited from comparative solubilities of NBT and the tested chemicals in the buffered organic solvent. Derivation of data was, thus from solution kinetics, without the need to factor in the loss of reactants due to ‘drowning out effects’. The accessible thiol group on NBT also enabled electrophile-nucleophile interactions with minimal steric hindrance from NBT. The stopped flow measurements utilized a closed cell as the reaction chamber and so the effect of evaporative loss was absent. Evaporative loss has been cited as a contributing factor to discordant results in several chemistry based assays and the LLNA (14;16). Unlike the peptide reactivity assay (10) which was not sensitive for electrophilic chemicals at the high reactivity end, the stopped-flow method was able to capture a wide range of reaction rate constants.
The chemicals investigated in this study were classified into three mechanistic domains and rate constants were compared within the same domain. The use of NBT as the nucleophile and the same buffered organic solvent (except for TDI and DPCP) ensured that nucleophilic influence and solvent effects were the same for all the chemicals evaluated. Most of the data adhered to pseudo first-order kinetics, irrespective of whether initial rates or the integrated rate equation was used to determine the rate constants. Deviations from ideal pseudo first order kinetics were evident with TDI, KTN, MITZ, EtOX, MSC and IAA. The behavior exhibited by TDI can be attributed to the instability of TDI whenever there are trace amounts of water. Rapid TDI hydrolysis results in amine formation. While the use of acetone may have slowed down the hydrolysis of TDI, the presence of side reactions was still evident as shown by the ki value (Table 3c). The reaction dynamics for KTN were complex and exhibited a shift in the kinetics after the initial part of the reaction. Recent NMR studies (17) characterizing peptide reactivity of the isothiazolinones that comprise KTN demonstrated the complex nature of KTN reactivity after the initial reactions. KTN exists as a mixture of two NBT reactive compounds (1.1% 5-chloro-2-methyl-4-isothiazolin-3-one and 0.4% 2-methyl-4-isothiazolin-3-one) in water. Thus KTN composition may have resulted in two competing reactions with NBT resulting in deviations from ideal kinetics. The data from the NBT-KTN experiments were still able to fit into a second order plot, albeit poorly, from which the rate constant (ks) in Table 3a was derived. Further analysis of the reactivity of KTN can be done by analyzing the reactivity of the constituents of the KTN separately. Careful consideration of the percentages of the reactive constituents will result in data that can be used to derive more accurate rate constants for KTN. MSC and IAA were able to fit into second order plots from which the rate constants were determined.
The different pH conditions between the surface of the stratum corneum (pH 5.5) and the epidermis (pH 7.4) has resulted in many speculations as to the role that pH plays in carrier protein haptenation (7). The degree of ionization of amino acids is pH dependent and thereby affects nucleophilic reactivity to electrophilic chemicals. Kinetics measurements that were carried out at pH 5.5 highlighted the importance of the ionization state of NBT and the role of H+ ions in the NBT-E+ reaction. For BQ and MITZ, kinetics performed at pH 5.5 showed that the rate of the reaction increased ≈ 10-fold over the kinetics performed at pH 7.4 (data not shown). Lower pH is more relevant if protein haptenation is confined to and controlled by the micro environment around the functional group of importance on a protein. It has been argued that the micro environment pH around a protein tends to be different from the overall physiological pH (7).
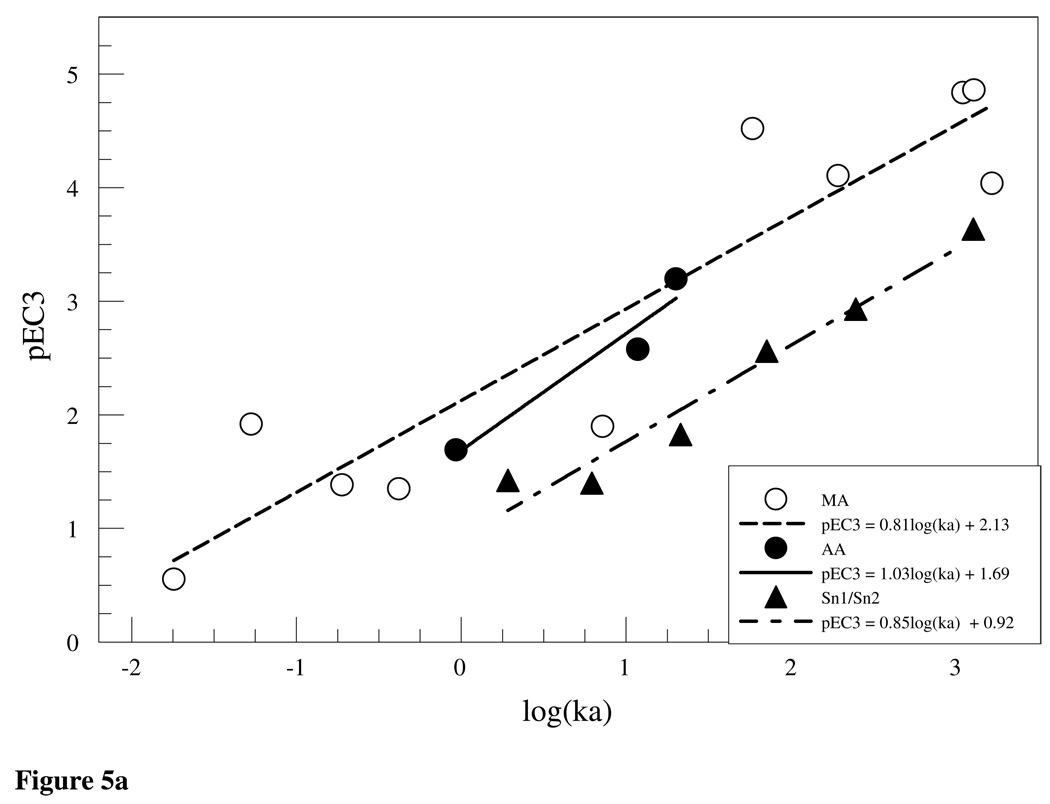
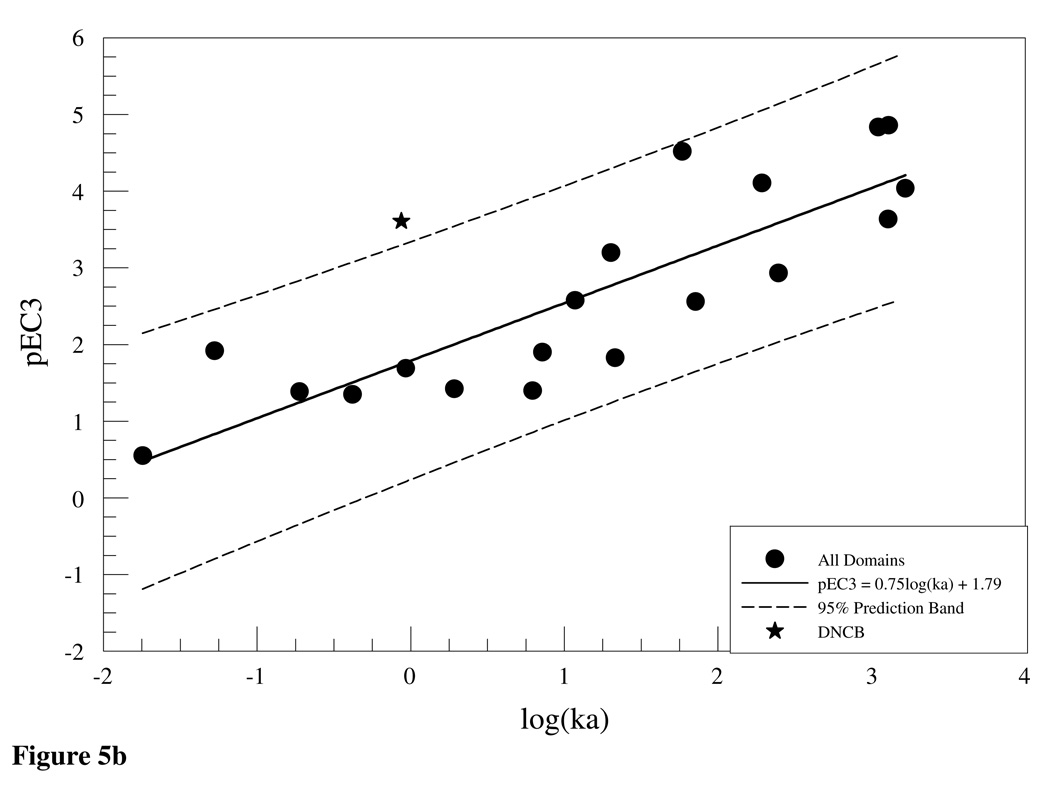
In comparison, the work done by Schultz et al. (18) argued that reactivity to GSH provided a good model for toxicity producing reactions of offending electrophiles with proteins and if classified in appropriate domains (e,g SN1, SN2, Michael acceptors etc) reactivity to nucleophiles such as GSH and by extension NBT tend to give a good indication of the reactivity of a chemical to cutaneous proteins. The relevance of the calculated rate constants to the chemicals’ potency as skin sensitizers was outlined by plotting pEC3 values against logka. The values for pEC3 were determined by dividing the molecular mass for the test chemical by the EC3 value and finding the log (14). Plots of pEC3 versus logka for the Michael acceptor, SN1/SN2 and acylating agent domains are shown in Figure 5(a,b) using rate constants in Tables 3(a–c) and previously reported EC3 values (12;19–21). Within the three domains and when all the domains were combined (Figure 5b), there is a positive correlation between potency in the LLNA and reactivity to NBT as was indicated by the following linear equations (with statistical parameters)
| (6) |
| (7) |
| (8) |
| (9) |
from the plots of the Michael acceptor (6), SN1/SN2 (7), acylating agent(8) and all domains (9), respectively. The correlation between pEC3 and logk within the Michael acceptor domain may weaken as more test chemicals are included due to the fact that the domain is structurally diverse and hence reactivity to thiols differs within subsets of the domain. This was demonstrated in the glutathione chemoassay where compounds with similar RC50 values were shown to have a 10-fold difference in rate constants (22). The allocation of Michael acceptors into subcategories of the domain (23) demonstrates this structural diversity. Data from the NBT-DNCB reaction shows that it was an outlier (Figure 5b). Given its potency classification as extreme sensitizer with an EC3 value of 0.05% DNCB would have been expected to react rapidly with NBT. DNCB, however, shows a slow reaction rate relative to the NBB (EC3 = 0.05%). While both react with NBT via a substitution mechanism, thiol attack on DNCB is on the benzene ring (SNAr) as opposed to NBB where nucleophilic attack is on the methyl C atom attached to the bromine. The attack on the ring proceeds more slowly than on the alkyl C atom. One explanation would be steric hindrance due to the nitro group adjacent to the chlorine. Reactivity rate of nitrochlorobenzene (NCB) to NBT was measured to evaluate this possibility. The overall rate (ka = 0.39 s−1) of the NCB-NBT reaction was lower than that of DNCB (ka = 0.87 s−1) suggesting that steric hindrance was not a determining factor in the DNCB-NBT reaction. The fact that the kinetics of the DNCB-NBT reaction was faster than the NCB-NBT reaction can be attributed to the inductive effect of the two electron withdrawing nitro groups on DNCB compared to NCB with one nitro group. The inclusion of DNCB, an SNAr reactor, in a largely SN1/SN2 domain further highlights the resultant weak correlation between logka and pEC3 when data sets are not sub-categorized.
Figure 5.
(a) Logka vs pEC3 for Michael acceptors, acetylating agents and SN1/SN2 reactivity domains. Significant positive correlations between LLNA pEC3 values and NBT reactivity was observed within the domains. (b.) Correlation between NBT reactivity and potency in the LLNA was still observed across all reactivity domains (r2 = 0.74). DNCB NBT reactivity was observed, but was outside the predictive bands at 95% CI.
Comparison of this model with existing kinetics profiling approaches shows that the new UV/VIS based method is superior with respect to the detectable range of electrophilic reactivity and to confounding factors such as potential loss of nucleophile due to oxidation. When the kinetics data were fitted into equation 3 comparison of the calculated rate constants ks and ki for the NBT-E+ and side reactions, respectively, showed that ks ≫ ki in most cases (Table 3(a–c)) and hence contribution of the side reactions was negligible. TDI proved to be an exception with a significantly high ki value of 0.11 s−1. TDI rapidly hydrolyses in trace amounts of aqueous media to give the urea product (24).
False negative results were obtained with known skin sensitizers that are cyclic anhydrides and diones like trimellitic anhydride and butanedione, respectively. The reactivity of formaldehyde and acetic anhydride to NBT was also interesting given that these chemicals are Schiff base formers with preferential reactivity to an amine based nucleophiles, although their potency NBT reactivity rankings still were within the 95% prediction bands. The inclusion of an amine based (harder) nucleophile to complement the softer thiol based NBT would certainly reduce the false negatives obtained from non-NBT reactive chemical sensitizers like trimellitic anhydride. The present assay system correctly ranked HEA (ka = 0.053 s−1; EC3 = 1.4) as more potent than EA (ka = 0.018 s−1; EC3 = 28) within one degree of potency difference from reported EC3 values (3-fold NBT reactivity rate constant vs. the 20-fold difference in the EC3 values between EA and HEA). Peptide reactivity studies using HEA and EA reported similar reactivities for these haptens (25). It was suggested that the LLNA results for EA may be skewed due to potential free radical induced polymerization and evaporative loss from the skin.
Our current method dwelled on the depletion of NBT with the assumption that the E+-NBT reactions were characterized by adduct formation. While this may not have been the case with all test chemicals, peptide binding studies (12;22) which have included characterization of the chemistry involved have demonstrated oxidation of the peptide thiol as the substitute reaction whenever there was absence of adduct formation. The buffered organic media precluded oxidation of NBT to species other than the disulfide - of which the rate would have been slower than the E+-NBT reaction. The fact that ks ≫ ki highlights the negligible contribution of disulfide formation to the overall depletion of NBT within the time frame of the reactions. Adduct formation with a protein is more important than oxidation of amino acid functional groups as it results in a recognizable immunogen. The present assay which captures adduct formation without interference from side reactions like oxidations is of greater utility than the previously reported assays where complications arose from side reactions. Our study focused on the rapid depletion of NBT as a measure of the reactivity of test chemicals to nucleophiles and just as argued by Mutschler et al (17) in the reaction of three peptides with Kathon the identification of adducts, while relevant may not need to be the main focus in the development of an in chemico assay because it is complicated and sometimes misleading. Characterization of hapten-peptide adducts does not take into account the rapid reactivity (such as hydrolysis) of the identified adducts as was observed in Mutschler et al’s study (17). Depletion of nucleophiles like NBT suffices as a simpler and relevant method for inclusion into a battery of preliminary screening assays for skin sensitizers. This study thus serves to strengthen other reported nucleophile depletion assays by capturing skin sensitizers with a wide range of reactivity. The study is particularly useful in measuring kinetics of rapidly reacting skin sensitizers and eliminates the need for estimated rate constants.
Acknowledgments
This work was supported by an Interagency Agreement with the NIEHS (No.Y1-ES0001-06). The findings and conclusions in this report are those of the authors and do not necessarily represent the views of the National Institute for Occupational Safety and Health.
References
- 1.Dean JH, Twerdok LE, Tice RR, Sailstad DM, Hattan DG, Stokes WS. ICCVAM evaluation of the murine local lymph node assay. Conclusions and recommendations of an independent scientific peer review panel. Regul. Toxicol. Pharmacol. 2001;34(3):258–273. doi: 10.1006/rtph.2001.1497. [DOI] [PubMed] [Google Scholar]
- 2.Buehler EV. Delayed Contact Hypersensitivity in the Guinea Pig. Arch. Dermatol. 1965;91:171–177. doi: 10.1001/archderm.1965.01600080079017. [DOI] [PubMed] [Google Scholar]
- 3.Magnusson B, Kligman AM. The identification of contact allergens by animal assay. The guinea pig maximization test. J. Invest Dermatol. 1969;52(3):268–276. doi: 10.1038/jid.1969.42. [DOI] [PubMed] [Google Scholar]
- 4.Ryan CA, Gerberick GF, Gildea LA, Hulette BC, Betts CJ, Cumberbatch M, Dearman RJ, Kimber I. Interactions of contact allergens with dendritic cells: opportunities and challenges for the development of novel approaches to hazard assessment. Toxicol. Sci. 2005;88(1):4–11. doi: 10.1093/toxsci/kfi245. [DOI] [PubMed] [Google Scholar]
- 5.Schultz TW, Carlson RE, Cronin MT, Hermens JL, Johnson R, O'Brien PJ, Roberts DW, Siraki A, Wallace KB, Veith GD. A conceptual framework for predicting the toxicity of reactive chemicals: modeling soft electrophilicity. SAR QSAR Environ. Res. 2006;17(4):413–428. doi: 10.1080/10629360600884371. [DOI] [PubMed] [Google Scholar]
- 6.Roberts DW, Aptula AO, Patlewicz G, Pease C. Chemical reactivity indices and mechanism-based read-across for non-animal based assessment of skin sensitisation potential. Journal of Applied Toxicology. 2008;28(4):443–454. doi: 10.1002/jat.1293. [DOI] [PubMed] [Google Scholar]
- 7.Divkovic M, Pease CK, Gerberick GF, Basketter DA. Hapten-protein binding: from theory to practical application in the in vitro prediction of skin sensitization. Contact Dermatitis. 2005;53(4):189–200. doi: 10.1111/j.0105-1873.2005.00683.x. [DOI] [PubMed] [Google Scholar]
- 8.Aleksic M, Pease CK, Basketter DA, Panico M, Morris HR, Dell A. Mass spectrometric identification of covalent adducts of the skin allergen 2,4-dinitro-1-chlorobenzene and model skin proteins. Toxicol. In Vitro. 2008;22(5):1169–1176. doi: 10.1016/j.tiv.2008.03.006. [DOI] [PubMed] [Google Scholar]
- 9.Schultz TW, Yarbrough JW, Johnson EL. Structure-activity relationships for reactivity of carbonyl-containing compounds with glutathione. SAR QSAR Environ. Res. 2005;16(4):313–322. doi: 10.1080/10659360500204152. [DOI] [PubMed] [Google Scholar]
- 10.Gerberick GF, Vassallo JD, Bailey RE, Chaney JG, Morrall SW, Lepoittevin JP. Development of a peptide reactivity assay for screening contact allergens. Toxicol. Sci. 2004;81(2):332–343. doi: 10.1093/toxsci/kfh213. [DOI] [PubMed] [Google Scholar]
- 11.Gerberick GF, Vassallo JD, Foertsch LM, Price BB, Chaney JG, Lepoittevin JP. Quantification of chemical peptide reactivity for screening contact allergens: a classification tree model approach. Toxicol. Sci. 2007;97(2):417–427. doi: 10.1093/toxsci/kfm064. [DOI] [PubMed] [Google Scholar]
- 12.Natsch A, Gfeller H. LC-MS-based characterization of the peptide reactivity of chemicals to improve the in vitro prediction of the skin sensitization potential. Toxicol. Sci. 2008;106(2):464–478. doi: 10.1093/toxsci/kfn194. [DOI] [PubMed] [Google Scholar]
- 13.Natsch A, Gfeller H, Rothaupt M, Ellis G. Utility and limitations of a peptide reactivity assay to predict fragrance allergens in vitro. Toxicol. In Vitro. 2007;21(7):1220–1226. doi: 10.1016/j.tiv.2007.03.016. [DOI] [PubMed] [Google Scholar]
- 14.Roberts DW, Natsch A. High Throughput Kinetic Profiling Approach for Covalent Binding to Peptides: Application to Skin Sensitization Potency of Michael Acceptor Electrophiles. Chemical Research in Toxicology. 2009;22(3):592–603. doi: 10.1021/tx800431x. [DOI] [PubMed] [Google Scholar]
- 15.Jowsey IR, Basketter DA, Westmoreland C, Kimber I. A future approach to measuring relative skin sensitising potency: a proposal. J. Appl. Toxicol. 2006;26(4):341–350. doi: 10.1002/jat.1146. [DOI] [PubMed] [Google Scholar]
- 16.Siegel PD, Fedorowicz A, Butterworth L, Law B, Anderson SE, Snyder J, Beezhold D. Physical-chemical and solvent considerations in evaluating the influence of carbon chain length on the skin sensitization activity of 1-bromoalkanes. Toxicol. Sci. 2009;107(1):78–84. doi: 10.1093/toxsci/kfn212. [DOI] [PubMed] [Google Scholar]
- 17.Mutschler J, Gimenez-Arnau E, Foertsch L, Gerberick GF, Lepoittevin JP. Mechanistic assessment of peptide reactivity assay to predict skin allergens with Kathon CG isothiazolinones. Toxicol. In Vitro. 2009;23(3):439–446. doi: 10.1016/j.tiv.2009.01.014. [DOI] [PubMed] [Google Scholar]
- 18.Schultz TW, Ralston KE, Roberts DW, Veith GD, Aptula AO. Structure-activity relationships for abiotic thiol reactivity and aquatic toxicity of halo-substituted carbonyl compounds. SAR QSAR Environ. Res. 2007;18(1–2):21–29. doi: 10.1080/10629360601033424. [DOI] [PubMed] [Google Scholar]
- 19.Gerberick GF, Ryan CA, Kern PS, Schlatter H, Dearman RJ, Kimber I, Patlewicz GY, Basketter DA. Compilation of historical local lymph node data for evaluation of skin sensitization alternative methods. Dermatitis. 2005;16(4):157–202. [PubMed] [Google Scholar]
- 20.van Och FM, Slob W, de Jong WH, Vandebriel RJ, van LH. A quantitative method for assessing the sensitizing potency of low molecular weight chemicals using a local lymph node assay: employment of a regression method that includes determination of the uncertainty margins. Toxicology. 2000;146(1):49–59. doi: 10.1016/s0300-483x(00)00165-7. [DOI] [PubMed] [Google Scholar]
- 21.Chipinda I, Hettick JM, Simoyi RH, Siegel PD. Zinc diethyldithiocarbamate allergenicity: potential haptenation mechanisms. Contact Dermatitis. 2008;59(2):79–89. doi: 10.1111/j.1600-0536.2008.01399.x. [DOI] [PubMed] [Google Scholar]
- 22.Bohme A, Thaens D, Paschke A, Schuurmann G. Kinetic glutathione chemoassay to quantify thiol reactivity of organic electrophiles--application to alpha,beta-unsaturated ketones, acrylates, and propiolates. Chem. Res. Toxicol. 2009;22(4):742–750. doi: 10.1021/tx800492x. [DOI] [PubMed] [Google Scholar]
- 23.Schultz TW, Rogers K, Aptula AO. Read-across to rank skin sensitization potential: subcategories for the Michael acceptor domain. Contact Dermatitis. 2009;60(1):21–31. doi: 10.1111/j.1600-0536.2008.01473.x. [DOI] [PubMed] [Google Scholar]
- 24.Chipinda I, Stetson SJ, Depree GJ, Simoyi RH, Siegel PD. Kinetics and mechanistic studies of the hydrolysis of diisocyanate-derived bis-thiocarbamates of cysteine methyl ester. Chemical Research in Toxicology. 2006;19(3):341–350. doi: 10.1021/tx050311t. [DOI] [PubMed] [Google Scholar]
- 25.Dearman RJ, Betts CJ, Farr C, McLaughlin J, Berdasco N, Wiench K, Kimber I. Comparative analysis of skin sensitization potency of acrylates (methyl acrylate, ethyl acrylate, butyl acrylate, and ethylhexyl acrylate) using the local lymph node assay. Contact Dermatitis. 2007;57(4):242–247. doi: 10.1111/j.1600-0536.2007.01215.x. [DOI] [PubMed] [Google Scholar]


