Abstract
Ultrasound image guided needle insertion is the method of choice for a wide variety of medical diagnostic and therapeutic procedures. When flexible needles are inserted in soft tissue, these needles generally follow a curved path. Segmenting the trajectory of the needles in ultrasound images will facilitate guiding them within the tissue. In this paper, a novel algorithm for curved needle segmentation in three-dimensional (3D) ultrasound images is presented. The algorithm is based on the projection of a filtered 3D image onto a two-dimensional (2D) image. Detection of the needle in the resulting 2D image determines a surface on which the needle is located. The needle is then segmented on the surface. The proposed technique is able to detect needles without any previous assumption about the needle shape, or any a priori knowledge about the needle insertion axis line.
Index Terms: Biomedical imaging, image analysis, biomedical acoustics, image segmentation, Hough transform
1. Introduction
Percutaneous needle insertion is a commonly used procedure to remove tissue samples from the body and/or to deliver substances, electric energy, or acoustic energy. Core needle biopsy, the definitive diagnosis of breast and prostate cancer [1, 2], is an example of diagnostic applications of percutaneous needle insertion, in which a hollow core needle is inserted into the tissue and small samples are removed for cancer diagnosis. Prostate brachytherapy is an example of therapeutic applications in which a needle is inserted into the prostate through perineum. The needle is then withdrawn while dropping radioactive seeds [3]. Radio frequency ablation (RFA) is another example of therapeutic applications in which needle electrodes are used for delivering radio frequency electric energy to the tissue to destroy abnormal electrical pathways in heart in order to reduce the risk of cardiac fibrillation [4]. Other applications of RFA are to destroy tumors in the liver, kidney, or prostate [5].
Compared to open surgery, needle-based methods tend to reduce the risk of injury to surrounding tissues, patients' discomfort, collateral treatment related complications (such as infection and hemorrhage), procedure time, and the overall costs of intervention [6].
When flexible needles are inserted in soft tissue, these needles generally follow a curved trajectory. In many cases, needle deflection occurs as a result of lateral forces on the beveled needle tip. At the same time, using the same forces, needle curvature could be intentionally generated as part of the needle steering process [7].
During the needle insertion procedure, the target is located using a medical imaging modality. Imaging is also used for guiding the needle to reach to the target. Due to its portability, safety, cost effectiveness and real-time nature, ultrasound imaging is the modality of choice in many needle insertion procedures. Generally, needle localization using 2D ultrasound images is limited to cases that the needle is located in the plane of the ultrasound image. In many cases, due to lateral deflection of the needle, imaging the needle with 2D images is not technically feasible. In these cases, 3D ultrasound can be used for imaging the needle.
Segmenting the trajectory of needles in ultrasound images will facilitate guiding them within the tissue. Most previously proposed techniques for needle segmentation are only applicable for straight needles [8, 9]. Segmentation of curved needles has been addressed before in the literature, but it was limited to 2D ultrasound images [10].
In this paper, a novel technique for curved needle segmentation in three-dimensional (3D) ultrasound images is presented. The proposed technique projects a 3D image onto a 2D image, followed by the segmentation of needle in the 2D image. Using the proposed algorithm, the position and the shape of the needle in the 3D volume can be determined in an automated manner, without manual intervention or supervision.
2. Methods
2.1. Experimental Data
The proposed algorithm was tested on 3D ultrasound images collected using a Sonix RP (Ultrasonix Inc., Richmond, BC, Canada) ultrasound machine equipped with a 3D probe (4DC7-4/40). The probe uses a motorized curvilinear transducer with 104 degrees field of view. Central frequency was set to 5 MHz. A tissue mimicking phantom was built from gelatin-agar based gel mixed with cellulose (to generate speckle texture) and glycerol (to modify the speed of sound in the gel) [11]. A flexible beveled-tip metal needle of 0.5 mm diameter was inserted in the phantom. The needle was inserted and imaged 15 times. The average bending radius of the needle was about 8 cm. In each case, the needle was segmented in a 3D volume image containing 256×256×125 voxels.
2.2. 3D image speckle reduction
Ultrasound image quality is generally degraded by speckles. Reduction of speckles (without reducing the details in the image) is usually necessary for an automated object recognition process. Anisotropic diffusion filter, first proposed in [12], has shown promising results in speckle reduction in ultrasound images [13]. The filter reduces the speckles by smoothing homogeneous image regions while retaining edges in the image. In this filter, the following nonlinear partial differential equation is used to smooth the images:
| (1) |
where I is the gray-level image, ∇ is the gradient operator, |∇ I | is the gradient magnitude, div is the divergence operator [12], and c(.) is an edge-stopping function defined as:
| (2) |
where k is a positive gradient threshold parameter (also known as diffusion constant). c(|∇ I|) decreases as the gradient magnitude of the image increases. Accordingly, in areas close to the edges c(|∇ I|) will have a small value, whereas c(|∇ I|) in homogenous regions will have a large value. Details about anisotropic diffusion filter can be found in [12, 13].
In this study, a 3D image containing the needle was first filtered by an anisotropic diffusion filter. The remaining speckles were then reduced by passing the 3D image through a contrast enhancement spatial domain filter with transfer function defined by:
| (3) |
where I(x, y, z) is the intensity of the voxel located at (x, y, z), and μ and σ are respectively the mean and variance of intensity values of a needle in a typical 3D image. A morphological opening operation then removes small remaining specks.
2.3. Ray casting
In the next step, filtered 3D images are projected onto 2D image planes. Projected 2D images are obtained using a ray casting process explained in [14], in which parallel rays travel through a 3D image towards xy -plane. Luminance of each voxel is proportional to its intensity:
| (4) |
where 0≤ C (x, y, z) ≤ 1 and 0 ≤ I (x, y, z) ≤ 1 are luminance and normalized gray level of the voxel located at (x, y, z). Each ray will be attenuated on its way to xy-plane. Attenuation will depend on the opacity of the voxels that the ray travels through. In this study, opacity 0 ≤ λ(x, y, z) ≤ 1 of each voxel is assumed to be:
| (5) |
Ray casting process is illustrated in Figure 1 in which a needle in 3D image (red curve) is projected to xy-plane. Projected image of the needle is shown in green. Further details about ray casting process can be found in [14].
Figure 1.
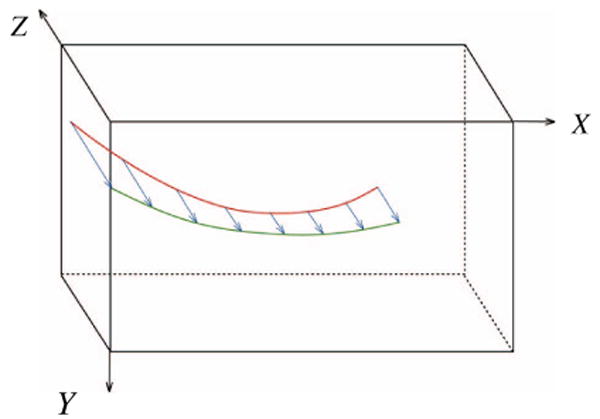
Projection of the needle in the 3D image (red curve) onto xy-plane (green curve) using ray casting.
2.4. Needle segmentation in projected image
In this study, it is assumed that the projected image of the curved needle can be approximated by a few short segments. These segments were detected using the Hough transform which is a powerful tool used for detection of linear features in the presence of noise [15]. Using the Hough transform for rough approximation of the needle path enables us to detect the needle even if the ultrasound image of the needle is discontinuous. A polynomial curve is then fitted to the end- and mid-points of the segments to detect the path of the needle image in the projected 2D image.
2.5. Needle segmentation in 3D image
The polynomial curve on xy-plane determines a surface that the needle is located on (the green surface in Figure 2). This surface in the 3D ultrasound image is then flattened, and the needle is detected on this surface using the Hough transform followed by polynomial curve fitting as explained in the previous section.
Figure 2.
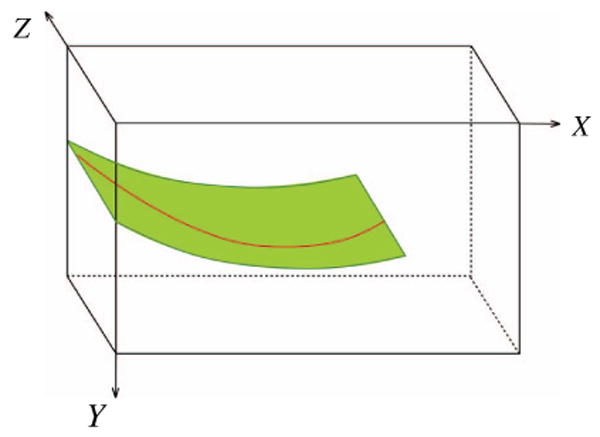
The surface on which the needle is located
3. Results and Discussion
In order to test the performance of the needle segmentation algorithm described in the previous section, the recorded 3D ultrasound images (as described in subsection 3.2) were transferred from the ultrasound machine to a personal computer with a 2.4 GHz Pentium processor and 2 gigabytes of RAM. The algorithm was implemented in MATLAB (MathWorks, Natick, MA). Different values of diffusion constant (k parameter in (2)) in the range of [5, 50] were tested. Diffusion constant k=30 resulted in the best results. Five randomly selected images were chosen to estimate average and standard deviation of the needle image gray-levels. These values were used in (3) for speckle reduction.
Different structuring elements for morphological opening were tested and a 3×1 structuring element resulted in the best performance.
A 2D slice of a 3D image before and after despeckling step as described in Section 2.2 is shown in Figure 3. The contrast of a small part of the needle, which is located in this slice, to surrounding areas was noticeably increased. Figure 4 shows a projected 2D image of a curved needle. Short segments detected by the Hough transform are shown in the right image of Figure 4. The (x, y) coordinates of the needle are estimated using a polynomial curve fitted to the end- and mid-points of the segments. The curve is shown in the left image of Figure 5. The curve was used for the detection of surface on which the needle is located on. This surface in the 3D ultrasound image is flattened. The flattened surface is shown in Figure 5 (right). The needle is detected on this surface using the Hough transform followed by polynomial curve fitting, shown with the red curve. This curve determines the z coordinates of the needle corresponding to the (x,y) coordinates detected previously. These coordinates can be used for locating the needle in the 3D image. The final result is shown in Figure 6. Using the Hough transform for rough approximation of the needle path enables us to detect the needle even if the ultrasound image of a needle has poor contrast to its surrounding area (Figure 7).
Figure 3.
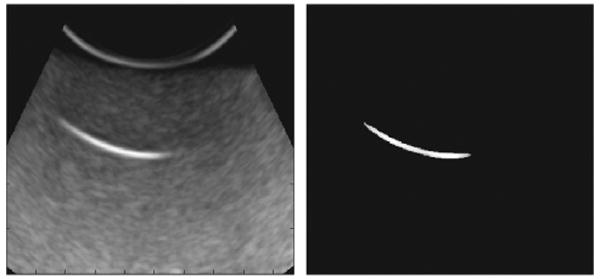
A 2D slice of a 3D image before (left) and after (right) speckle reduction step.
Figure 4.
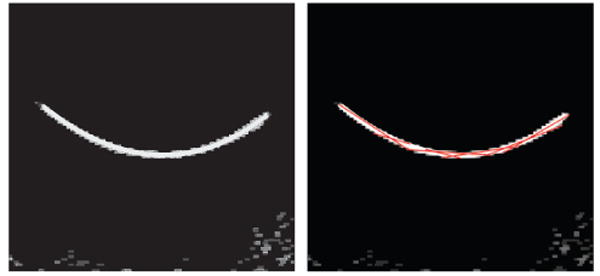
2D projected image (left) and segments detected using the Hough transform (right).
Figure 5.
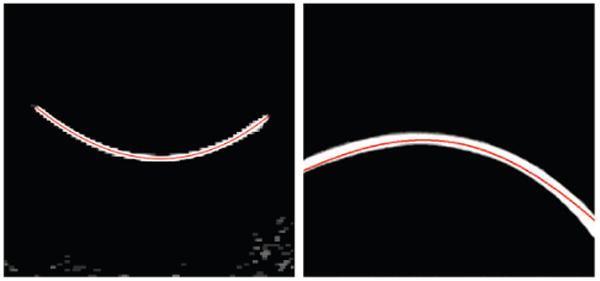
A curve marking the needle in projected 2D image (left) and detected needle in the flattened image (right).
Figure 6.
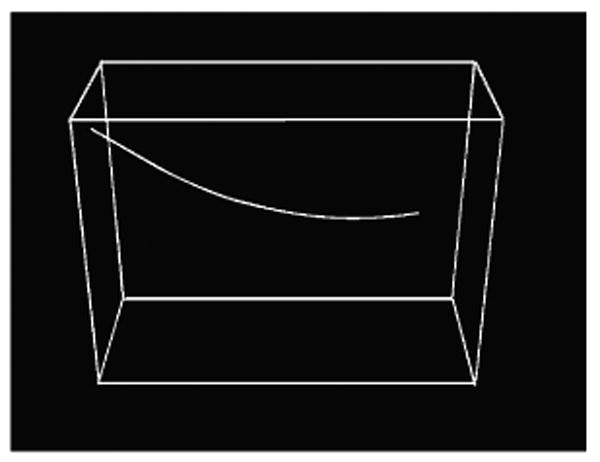
Needle detected in a 3D image.
Figure 7.
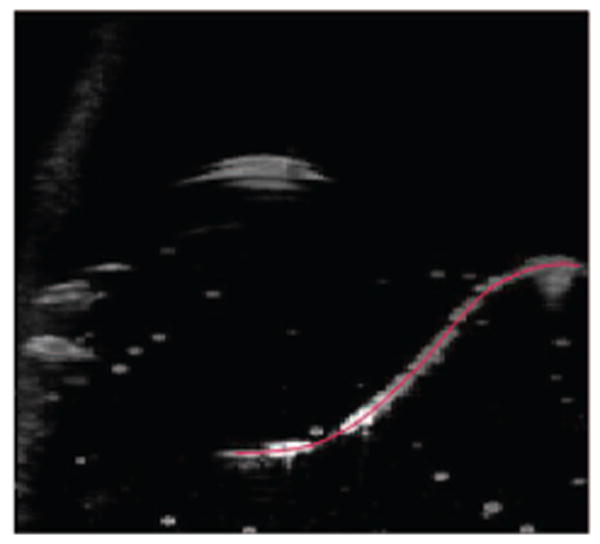
Needle detected in a case where the image has poor quality at some parts of the needle.
The automatically detected needle locations were compared with the locations detected by visual inspection of the 3D images. In all 15 images, needle locations were detected correctly, however in 6 cases needle tip locations did not match with what detected automatically. Average error in needle tip detection was less than 2.8 mm (less than 3.2% of the needle lengths).
Needle segmentation in a 256×256×125 voxel 3D image took about 3 seconds. The speed can be increased by implementing the algorithm in C++. Since some steps of the proposed algorithm can be executed in a parallel processing scheme, GPU based implementation of the algorithm will increase the speed of the segmentation algorithm.
4. Conclusion
The proposed technique is able to detect needles without any previous assumption about the needle, or any a priori knowledge about the needle insertion axis line. Using the Hough transform for rough approximation of the needle path enables us to detect the needle even if the ultrasound image of the needle is discontinuous. Detection of needles in the presence of curvilinear structures similar to needles is an important issue that must be addressed in a future work.
Acknowledgments
This work was supported by the U.S. National Institute of Health (NIH) grant number 5R01EB006435.
References
- 1.Durkan GC, Sheikh N, Johnson P, Hildreth AJ, Greene DR. Improving prostate cancer detection with an extended-core transrectal ultrasonography-guided prostate biopsy protocol. British Journal of Urology International. 2002;89(1):33–39. doi: 10.1046/j.1464-4096.2001.01488.x. [DOI] [PubMed] [Google Scholar]
- 2.Liberman L, LaTrenta LR, Dershaw DD, Abramson AF, Morris EA, Cohen MA, Rosen PP, Borgen PI. Impact of core biopsy on the surgical management of impalpable breast cancer. American Journal of Roentgenology. 1997;168:495–499. doi: 10.2214/ajr.168.2.9016234. [DOI] [PubMed] [Google Scholar]
- 3.Nag S, Beyer D, Friedland J, Grimm P, Nath R. American brachytherapy society (ABS) recommendations for transperineal permanent brachytherapy of prostate cancer. International Journal of Radiation Oncology, Biology, and Physics. 1999;44(4):789–799. doi: 10.1016/s0360-3016(99)00069-3. [DOI] [PubMed] [Google Scholar]
- 4.Jais P, Haissaguerre M, Shah DC, Chouairi S, Gencel L, Hocini M, Clementy J. A focal source of atrial fibrillation treated by discrete radiofrequency ablation. Circulation. 1997;95:572–576. doi: 10.1161/01.cir.95.3.572. [DOI] [PubMed] [Google Scholar]
- 5.Goldberg SN, Gazelle GS, Compton CC, Mueller PR, Tanabe KK. Treatment of intrahepatic malignancy with radiofrequency ablation: radiologic-pathologic correlation. Cancer. 2000;88(11):2452–63. [PubMed] [Google Scholar]
- 6.Pandharipande PV, Gervais DA, Mueller PR, Hur C, Gazelle GS. Radiofrequency ablation versus nephron-sparing Surgery for small unilateral renal cell carcinoma: cost-effectiveness analysis. Radiology. 2008;248:169–178. doi: 10.1148/radiol.2481071448. [DOI] [PMC free article] [PubMed] [Google Scholar]
- 7.Alterovitz R, Branicky M, Goldberg K. Motion planning under uncertainty for image-guided medical needle steering. The International Journal of Robotics Research. 2008;27(11-12):1361–1374. doi: 10.1177/0278364908097661. [DOI] [PMC free article] [PubMed] [Google Scholar]
- 8.Ding M, Cardinal HN, Fenster A. Automatic needle segmentation in three-dimensional ultrasound images using two orthogonal two-dimensional image projections. Medical Physics. 2003;30(2):222–234. doi: 10.1118/1.1538231. [DOI] [PubMed] [Google Scholar]
- 9.Novotny PM, Stoll JA, Vasilyev NV, del Nido PJ, Dupont PE, Zickler TE, Howe RD. GPU based real-time instrument tracking with three-dimensional ultrasound. Medical Image Analysis. 2007;11(5):458–464. doi: 10.1016/j.media.2007.06.009. [DOI] [PMC free article] [PubMed] [Google Scholar]
- 10.Okazawa SH, Ebrahimi R, Chuang J, Rohling RN, Salcudean SE. Methods for segmenting curved needles in ultrasound images. Medical Image Analysis. 2006;10:330–342. doi: 10.1016/j.media.2006.01.002. [DOI] [PubMed] [Google Scholar]
- 11.Madsen EL, Hobson MA, Shi H, Varghese T, Frank GR. Tissue-mimicking agar/gelatin materials for use in heterogeneous elastography phantoms. Physics in Medicine and Biology. 2005;50(23):5597–5618. doi: 10.1088/0031-9155/50/23/013. [DOI] [PMC free article] [PubMed] [Google Scholar]
- 12.Perona P, Malik J. Scale-space and edge detection using anisotropic diffusion. IEEE Transactions on Pattern Analysis and Machine Intelligence. 1990;12(7):629–639. [Google Scholar]
- 13.Loizou CP, Pattichis CP, Christodoulou CI, Istepanian RSH, Pantziaris M, Nicolaides A. Comparative evaluation of despeckle filtering in ultrasound imaging of the carotid artery. IEEE Transactions on Ultrasonics, Ferroelectrics, and Frequency Control. 2005;52(10):1653–1670. doi: 10.1109/tuffc.2005.1561621. [DOI] [PubMed] [Google Scholar]
- 14.Lichtenbelt B, Crane R, Naqvi S. Introduction to Volume Rendering. Prentice-Hall; Upper Saddle River: 1998. [Google Scholar]
- 15.Duda RO, Hart PE. Use of the Hough transformation to detect lines and curves in pictures. Communication of Association for Computing Machinery. 1972;15:11–15. [Google Scholar]


