

Abstract
Axonal degeneration contributes to permanent neurological disability in inherited and acquired diseases of myelin. Mitochondrial dysfunction has been proposed as a major contributor to this axonal degeneration. It remains to be determined, however, if myelination, demyelination, or remyelination alter the size and distribution of axonal mitochondrial stationary sites or the rates of axonal mitochondrial transport. Using live myelinated rat dorsal root ganglion (DRG) cultures, we investigated whether myelination and lysolecithin-induced demyelination affect axonal mitochondria. Myelination increased the size of axonal stationary mitochondrial sites by 2.3-fold. After demyelination, the size of axonal stationary mitochondrial sites was increased by an additional 2.2-fold and the transport velocity of motile mitochondria was increased by 47%. These measures returned to the levels of myelinated axons after remyelination. Demyelination induced activating transcription factor 3 (ATF3) in DRG neurons. Knockdown of neuronal ATF3 by short hairpin RNA abolished the demyelination-induced increase in axonal mitochondrial transport and increased nitrotyrosine immunoreactivity in axonal mitochondria, suggesting that neuronal ATF3 expression and increased mitochondrial transport protect demyelinated axons from oxidative damage. In response to insufficient ATP production, demyelinated axons increase the size of stationary mitochondrial sites and thereby balance ATP production with the increased energy needs of nerve conduction.
Introduction
Neurons are a diverse population of cells that usually extend several short dendrites and a single axon that can be a meter or more in length. Long axons pose challenges to neurons. A constant flow of metabolites and organelles must be delivered throughout the axon. Since conduction of nerve impulses is a major consumer of ATP, the transport, distribution, and function of axonal mitochondria are essential for axonal function (Hollenbeck and Saxton, 2005; Chan, 2006). Axons contain two mitochondrial pools: a stationary pool and a motile pool. Seventy percent or more of axonal mitochondria are present at stationary sites, which can be composed of single or multiple mitochondria. Stationary mitochondrial sites are enriched in axonal areas with high ATP consumption such as growth cones and nodes of Ranvier (Fabricius et al., 1993; Morris and Hollenbeck, 1993). Motile mitochondria are generally smaller than mitochondria at stationary sites and are transported throughout the axon in anterograde and retrograde directions (Hollenbeck and Saxton, 2005).
In addition to its insulating role in increasing conduction velocity, myelin provides trophic support that is essential for long-term axonal survival (Nave and Trapp, 2008). Loss or disruption of this extrinsic axonal support can result in axonal degeneration. Axonal degeneration contributes to permanent neurological disability in primary diseases of myelin (Nave and Trapp, 2008; Trapp and Nave, 2008). The mechanisms of axonal pathology and degeneration after demyelination or dysmyelination are not yet fully understood, but mitochondrial dysfunction is considered to play a key role (Smith et al., 1999; Dutta et al., 2006; Kalman et al., 2007). Mitochondrial densities are increased in dysmyelinated optic nerve axons (Andrews et al., 2006; Hogan et al., 2009) and demyelinated lesions of human brain (Mahad et al., 2009; Witte et al., 2009) but are decreased in chronically demyelinated spinal cord axons from multiple sclerosis patients (Dutta et al., 2006). Although current theories support altered mitochondrial function and distribution in the pathogenesis of primary myelin diseases (Trapp and Stys, 2009), little is known about how myelination, demyelination, and remyelination alter axonal mitochondrial distribution and transport. Axonal degeneration after demyelination or as a result of dysmyelination is a chronic process taking months or years to develop (Trapp and Nave, 2008). The initial axonal response to demyelination, therefore, reestablishes axonal function and is likely to include changes in mitochondrial distribution or behavior.
In this study, we examined how and to what extent demyelination affects axonal mitochondria. We report that the size of stationary mitochondrial sites and the transport speed of motile mitochondria are significantly increased in demyelinated dorsal root ganglion (DRG) axons. Furthermore, we show that neuronal expression of activating transcription factor 3 (ATF3), which is rapidly upregulated during axonal regeneration (Tsujino et al., 2000; Nakagomi et al., 2003), is required for the demyelination-induced increase in mitochondrial motility. Knockdown of ATF3 also increased nitrotyrosine immunoreactivity in axonal mitochondria. These data support the hypothesis that the changes of motility and distribution of axonal mitochondria are essential adaptive/stress responses designed to maintain the function of demyelinated axons.
Materials and Methods
Myelinating DRG cultures.
Rat DRG and Schwann cell mixed cultures were prepared using established methods (Fex Svenningsen et al., 2003) with modifications. Briefly, DRGs from embryonic day 16 Sprague Dawley rats (Harlan Laboratories) were extracted and collected in L15 medium, treated with 0.25% trypsin in L-15 (Sigma-Aldrich) at 37°C for 15 min, and then mechanically dissociated through a plastic Pasteur pipette until all large fragments disappeared. Dissociated cells were washed twice in cold L15 and resuspended in Neurobasal media (Invitrogen) containing 2% B27, 0.3% Glutamax (Invitrogen), 100 ng/ml nerve growth factor (Roche Diagnostics), and penicillin/streptomycin. Before cell plating, poly-d-lysine-coated glass-bottom culture dishes (MatTek) were coated by Matrigel (BD Biosciences). A total of 5 × 10⁴ cells was plated into the dishes. Five days after plating, 50 μg/ml ascorbic acid was added to the medium to induce myelination; these cultures were maintained for 7–9 additional weeks. The medium was changed every 2–3 d. To induce demyelination, lysolecithin (L-4129; Sigma-Aldrich) was added to the culture medium at a concentration of 0.05% for 15 h at 37°C. After incubation, the lysolecithin-containing medium was removed and replaced with fresh medium.
All procedures were in strict accordance with the National Institutes of Health Guide for the Care and Use of Laboratory Animals and were approved by the Institutional Animal Care and Use Committee of the Cleveland Clinic Foundation.
Immunocytochemistry.
Cultures were fixed with 4% formaldehyde in PBS for 15 min, rinsed, permeabilized with 0.5% Triton X-100 in 2% bovine serum albumin (Sigma-Aldrich) and PBS for 45 min, and incubated with primary antibodies overnight. Primary antibodies included SMI-94 and SMI-99 (myelin basic protein) for myelin staining (Covance), SMI-31 (phosphorylated neurofilament) and SMI-32 (nonphosphorylated neurofilament) for axon staining (Covance), ATF3 (Santa Cruz Biotechnology), pan-Nav (Sigma-Aldrich), and nitrotyrosine (clone 1A6; Millipore). The cultures were subsequently rinsed and incubated with secondary antibodies conjugated to Alexa Fluor 488, 546, 594, or 633 (Invitrogen), diluted 1:500 in 2% BSA. Immunostained cultures were analyzed by confocal microscopy (Leica SP5; Leica), and images were processed with Adobe Photoshop (Adobe) and NIH ImageJ. For counting ATF3-positive neurons, five random fields of each culture were imaged, and the number of positive and negative neurons was counted. For semiquantitative comparison of nitrotyrosine immunoreactivity, the gray values of fluorescence intensity were measured under the same immunostaining and observational conditions in at least 10 axons in five different fields for each group. Three independent experiments were examined for each condition.
Lentivirus preparation.
Lentivirus was prepared according to the manufacturer's protocol from ViraPower Lentiviral Expression Systems (Invitrogen). Briefly, Mito-DsRed2 sequences followed by a mitochondrial targeting signal (Clontech) were amplified by PCR and subcloned into pLentiV5/6 lentiviral vector. 293FT cells were transfected with the construct and packaging plasmids using Lipofectamine 2000. The viral supernatants were collected 72 h after transfection, centrifuged at 2500 rpm for 10 min, filtered with 0.45 μm PVDF (polyvinylidene difluoride) filters, aliquoted, and frozen at −80°C until use. Control nontarget short hairpin RNA (shRNA) (SHC002V) and ATF3 shRNA (TRCN0000082131; sequence: CCGGTGCTGCCAAGTGTCGAAACAACTCGAGTTGTTTCGACACTTGGCAGCATTTTTG) lentiviruses were purchased from Sigma-Aldrich. The results obtained with control shRNA were similar to those obtained with another shRNA (TRCN0000082130), which did not suppress ATF3 expression in our culture after demyelination. Viruses were applied to cultures using ∼107 colony-forming units/ml and incubated for 24 h. Under these conditions, >90% of neurons were infected.
Imaging.
Seven to 9 d after virus infection, culture dishes were transferred to a microincubator (PDMI-2; Medical System Corporation) attached to an inverted laser-scanning confocal microscope (TCS SP; Leica). The chamber temperature was kept at 37.0 ± 0.5°C using a temperature controller (TC-202; Medical System Corporation), and the cells were provided with constant gas flow (95% air, 5% CO2) as described previously (Kumada et al., 2006). DRG cultured cells were imaged using a 40× oil-immersion objective (numerical aperture, 1.25). Time-lapse images of mitochondrial dynamics were collected in a single focal plane at 1024 × 1024 pixel resolution every 6.8 s for a total of 201 images. The presence or absence of myelin and the location of nodes were evident from the transmitted light images and also confirmed by immunostaining for Na+ channels and myelin basic protein (MBP) in the same axons, as described above.
Electron microscopy.
The DRG culture was fixed in 0.1 m phosphate buffer containing 4% paraformaldehyde and 1% glutaraldehyde overnight. The cultures were placed in 1% OsO4, dehydrated in a graded series of ethanol, and embedded in Epon 812 (Electron Microscopy Sciences). Ultrathin sections (∼100 nm thick) were cut, stained with uranyl acetate and lead citrate, and observed with a Philips CM100 transmission electron microscope.
Quantification of mitochondria.
The time-lapse images were processed with ImageJ software, and kymographs were generated as described previously (Miller and Sheetz, 2004). Stationary mitochondrial sites were identified as vertical lines on the kymographs. Motile mitochondria appeared as diagonal lines, and their slopes provided velocity. The size of stationary mitochondrial sites was measured as the pixel area labeled by DsRed2 at each stationary mitochondrial site and converted to square micrometer area. This value represented changes in both length and width of the DsRed2 fluorescence signal. The number of stationary mitochondrial sites per length of axon was also determined.
Statistical analysis.
Statistical analysis was performed using SigmaStat (Aspire Software International). Data are presented as mean ± SD. Comparisons were made using the Mann–Whitney U test for mitochondrial velocities and sizes of stationary mitochondrial sites and the Student's t test for percentage of ATF3-positive cells and nitrotyrosine immunoreactivity.
Results
Visualization of mitochondria in myelinated and demyelinated DRG axons
To investigate mitochondrial transport in myelinated axons, we established DRG cultures that attained robust myelination. To visualize mitochondrial distribution and transport, we constructed a mito-DsRed2 lentivirus carrying fluorescent DsRed2 with a mitochondrial targeting signal in the N terminus. The advantage of using lentivirus in this culture system is that it preferentially infects DRG neurons, but not myelinating Schwann cells. This characteristic enabled observation of mitochondria in living axons using confocal microscopy. Figure 1A shows mito-DsRed2 distribution in a living axon of a DRG neuron 7 d after infection. To identify myelin internodes, we immunostained myelinated DsRed2-expressing DRG cultures for voltage-gated Na+ channels, which are enriched in nodes of Ranvier, and MBP, which is a marker of myelin (Fig. 1B). The DsRed2-labeled mitochondria were present in both nodal and internodal regions. The axons analyzed contained multiple contiguous myelin internodes with few or no unmyelinated segments. In electron micrographs of myelinated axons from DRG cultures (Fig. 1C), mitochondria were characteristically elongated, and two to three of these elongated mitochondria were often present at single sites (Fig. 1C, inset). To examine changes in axonal mitochondria before and after demyelination, we treated myelinated DRG cultures with the demyelination-inducing reagent lysolecithin (Woodruff and Franklin, 1999; Birgbauer et al., 2004). Because high concentrations of lysolecithin can also damage neurons and axons, we carefully optimized the concentration of lysolecithin to 0.5 mg/ml, as reported previously (Birgbauer et al., 2004). Lysolecithin treatment induced demyelination such that myelin stained by MBP was highly vacuolated. Axons were spared (Fig. 1D–I, stained for neurofilament). These results show that this in vitro model is suitable for observing mitochondrial behavior in living myelinated and demyelinated axons.
Figure 1.

Mitochondria in myelinated and demyelinated axons of DRG neurons. A, Representative live imaging of myelinated DRG cultures infected by mito-DsRed2 lentivirus. An asterisk shows the cell body of a DRG neuron. The arrows indicate predicted nodes of Ranvier. Mitochondria labeled by fluorescent red are distributed in the axon as well as the cell body. Note that surrounding Schwann cells are not labeled. B, Colabeling of mitochondria with DsRed2 (red), Na+ channel (green), and MBP (blue) by immunostaining. C, An electron micrograph of a myelinated DRG axon. Multiple elongated mitochondria were clustered at single sites (arrowhead); their spatial separation and cristae are visible at higher magnification (inset). This arrangement of mitochondria establishes that many mitochondrial stationary sites contain multiple mitochondria. D–I, Myelination and demyelination in DRG cultures. Immunostaining of MBP (green) and neurofilament (NF) (red) in control culture (D–F) and culture 2 d after lysolecithin (Lyso) treatment (G–I). The insets show magnified images of the areas marked with rectangles in F and I. Note that continuous MBP-positive myelin sheath in control (D–F) becomes discontinuous and fragmented after Lyso treatment (G–I). Scale bars: C, 500 nm; C, inset, 250 nm; others, 10 μm.
Alterations of mitochondrial transport and distribution by demyelination
To observe mitochondrial motility and distribution in demyelinated axons, DRG cultures were subjected to lysolecithin treatment 7 d after lentivirus infection, and then time-lapse imaging of mitochondria in living axons was performed using confocal microscopy 48 h after the treatment. We selected this time point because lysolecithin demyelination requires this period of time to develop morphologically evident myelin disruption as described previously (Birgbauer et al., 2004). Using this system, we observed the dynamics of DsRed2-labeled axonal mitochondria in myelinated (Fig. 2A,A′; supplemental Movie 1, available at www.jneurosci.org as supplemental material) and demyelinated axons (Fig. 2B,B′; supplemental Movie 2, available at www.jneurosci.org as supplemental material). Immunostaining for MBP after live imaging confirmed myelination of the observed axons in control cultures and demyelination in lysolecithin-treated cultures (data not shown). Not all of the vacuolated myelin debris was degraded in demyelinated cultures because of reduced numbers of phagocytic cells of monocyte origin in the cultures. Motile mitochondria and stationary mitochondrial sites were identified using kymographs, which represent two-dimensional images of stationary and motile mitochondria during the entire time-lapse sequence (Fig. 2A′,B′). The vertical lines represent the stationary mitochondrial sites, whereas the oblique lines represent the motile mitochondria. The size and number of stationary mitochondrial sites and the velocity of mitochondria were measured in myelinated and demyelinated axons. In myelinated axons, sizes of stationary mitochondrial sites varied from <2 to >20 μm2, with those <2 μm2 being the most abundant at ∼36% (Fig. 2C). The majority (>95%) of mitochondrial stationary sites ranged in size from <2 to 10 μm2, and the mean size of the stationary sites was 3.7 μm2 (n = 185 mitochondria). The number of stationary mitochondrial sites per 10 μm axonal length was 1.2 ± 0.5 (n = 20 axons). In contrast, motile mitochondria appeared uniformly small (<2 μm). Electron microscopy of myelinated axons from DRG cultures indicated that many of the stationary sites observed in live imaging consisted of multiple mitochondria (Fig. 1C). The average velocity of the mitochondrial transport in myelinated axons was 0.6 ± 0.1 μm/s (n = 24 axons) and did not differ significantly in the anterograde or retrograde direction (data not shown).
Figure 2.

Mitochondrial behavior before and after demyelination. A, B, Single frames from the time-lapse images. A′, B′, Kymographs of the time-lapse images. C, Sizes of stationary mitochondrial site in myelinated (control; gray bars) and demyelinated (Lyso; black bars) axons. The size of stationary mitochondrial sites is significantly increased (p < 0.01) in the demyelinated axons [n = 185 mitochondria (control); n = 182 mitochondria (lysolecithin treated)].
In demyelinated axons, the size of stationary mitochondrial sites was significantly increased compared with myelinated axons (p < 0.01), as the mean size of the stationary sites was 8.1 μm2 (n = 182 mitochondria, a 2.2-fold increase over the 3.7 μm2 in myelinated axons). The percentage of sites <2 μm2 in demyelinated axons was only ∼18%, or approximately one-half of the percentage in myelinated axons (Fig. 2C). Demyelination also resulted in greater percentages (12% compared with 0.5% in myelinated axons) of mitochondrial sites >20 μm2 in size (Fig. 2C). Mitochondrial stationary sites of 10, 12, 14, and 16 μm2 in size were also more abundant in demyelinated axons when compared with myelinated axons. Despite this increase in size, the number of stationary mitochondrial sites per 10 μm axonal length was identical in myelinated and demyelinated axons (1.2 ± 0.4 per 10 μm axon; n = 21 axons), indicating that demyelination significantly increases total stationary mitochondrial size, but not the number of mitochondrial stationary sites. The velocity of motile mitochondria was also significantly greater in demyelinated axons (p < 0.01), as the mean velocity increased from 0.6 ± 0.1 μm/s in myelinated axons to 0.9 ± 0.3 μm/s (n = 20 axons) in demyelinated axons (47% increase). These results indicate that demyelination significantly increases the size of stationary mitochondria and the rate of motile mitochondrial transport, but importantly does not affect the distance between the stationary mitochondrial sites.
Lysolecithin does not alter mitochondrial stationary site sizes or transport velocities in unmyelinated axons
It is conceivable that the application of lysolecithin may directly affect axonal mitochondria. To address this issue, we generated DRG cultures as described above but did not add ascorbic acid to the medium to prevent myelination. After neuronal transfection of mito-DsRed2, we observed mitochondrial dynamics in unmyelinated axons with (Fig. 3B,B′) or without (Fig. 3A,A′) lysolecithin treatment. As shown in Figure 3C, the overall size of stationary mitochondrial sites is significantly smaller in unmyelinated axons compared with myelinated axons (Fig. 2C). The mean size of unmyelinated axonal mitochondrial stationary sites was 1.6 μm2 (n = 180 mitochondria). This value is 43% of the mean stationary site size on myelination (3.7 μm2 in myelinated axons), indicating that myelination produces a 2.3-fold increase in stationary site size. Mitochondria of <2 μm2 in size comprised ∼70% of the total in unmyelinated axons (Fig. 3C), compared with ∼36% or less in the myelinated and demyelinated cultures (Fig. 2C). In addition, mitochondria >6 μm2 in size were rare (<1%) in unmyelinated axons (Fig. 3C), whereas the myelinated and demyelinated axons contained >14 and >30% of mitochondria >6 μm2 in size, respectively (Fig. 2C). The observation of smaller stationary mitochondrial sizes in unmyelinated axons supports the hypothesis that myelination increases the volume of axonal mitochondria, although we cannot exclude some influence of neuronal maturation (Chang and Reynolds, 2006). In contrast, the number of stationary mitochondrial sites per 10 μm (1.0 ± 0.4; n = 20 axons) and the transport velocity of motile mitochondria in unmyelinated axons (0.6 ± 0.2 μm/s; n = 24 axons) were not statistically different from those of myelinated axons. Interestingly, the application of lysolecithin did not alter the size or density of stationary mitochondrial sites or the transport velocity of motile mitochondria in unmyelinated axons, as none of these measures was significantly different in the lysolecithin-treated cultures compared with controls. In the unmyelinated axons treated with lysolecithin, the mean size of stationary sites was 1.9 μm2, the number of stationary mitochondrial sites per 10 μm was 1.1 ± 0.4 (n = 21 axons), and the mean velocity of motile mitochondria was 0.6 ± 0.1 μm/s (n = 20 axons). These findings establish that the changes in axonal mitochondria after lysolecithin treatment of myelinated axons result from demyelination and not from direct effects of lysolecithin on axons, and that both myelination and demyelination increase the size of stationary mitochondria.
Figure 3.

Lysolecithin does not alter mitochondrial behavior in unmyelinated axons. A, B, Single frames from the time-lapse images of untreated (A) and lysolecithin-treated (B) unmyelinated axons. A′, B′, Representative kymographs of the time-lapse images from unmyelinated axons with (B′) or without (A′) lysolecithin treatment. C, Sizes of stationary mitochondrial sites in unmyelinated axons with (Lyso) or without (control) lysolecithin treatment. The sizes are similar in both groups. n = 180 mitochondria (control); n = 181 mitochondria (Lyso).
Reversal of demyelination-induced mitochondrial changes after remyelination
If the alterations in mitochondrial transport and distribution observed in our experiments described above were caused by demyelination, then mitochondria in remyelinated axons would be expected to revert back to their previous state before lysolecithin treatment. To investigate this possibility, we examined axonal mitochondria after remyelination. In our culture system, DRG axons are remyelinated within 15 d after lysolecithin treatment (Fig. 4A). We therefore performed time-lapse imaging at this time point. The size distribution of stationary mitochondrial sites in remyelinated axons (Fig. 4B) was similar to that found in myelinated axons (Figs. 2B, 4B). This included a very similar percentage of small (<2 μm2) stationary mitochondrial sites in both conditions, as well as very similar percentages of larger (>10 μm2) stationary mitochondrial sites. The mean size of stationary sites was 4.7 μm2 (n = 127 mitochondria). Furthermore, the transport rate of motile mitochondria, which was higher in demyelinated axons (0.9 ± 0.3 μm/s; n = 20 axons) than in myelinated axons (0.6 ± 0.1 μm/s; n = 24 axons), returned to 0.6 ± 0.1 μm/s (n = 21 axons) after remyelination (Fig. 4C). Myelinated and remyelinated axons have similarly sized stationary mitochondrial sites and transport velocities of motile mitochondria, supporting the concept that demyelination caused by lysolecithin treatment produced significant but reversible changes in mitochondrial dynamics.
Figure 4.

Mitochondrial transport velocity and stationary mitochondrial sites are similar in myelinated and remyelinated axons. A, Immunostaining for MBP in control, demyelinated [2 d after lysolecithin treatment (Lyso 2d)] and remyelinated [14 d after lysolecithin treatment (Lyso 14d)] cultures. Continuous tubular MBP-positive myelin (control) becomes fragmented in Lyso 2d, but is replaced in Lyso 14d. Scale bars, 10 μm. B, Size changes of stationary mitochondrial sites in control (gray bars), demyelinated (black bars), and remyelinated (white bars) axons. The sizes of stationary mitochondrial sites increased after demyelination (p < 0.01) but were similar in myelinated and remyelinated axons. n = 124 (control), 128 (demyelination), and 127 (remyelination) mitochondria. C, Mean velocity of motile mitochondria in control, demyelinated, and remyelinated axons. After demyelination, the mean velocity of motile mitochondria was significantly increased (*p < 0.01). The mitochondrial transport velocity was similar in myelinated and remyelinated axons. n = 158 (control), 194 (demyelination), and 183 (remyelination) mitochondria. Error bars indicate SD.
Alteration of axonal mitochondria as a neuronal adaptive response
Because mitochondrial transport and distribution were significantly altered on demyelination and reverted back to the levels of myelinated axons after remyelination, the changes in mitochondrial transport and distribution may reflect a neuronal adaptive response to maintain axonal functions during and after demyelination. To further investigate this possibility, we studied the neuronal expression of ATF3 in myelinated and demyelinated cultures. We focused on ATF3 because it is induced in regenerating neurons and is a key transcription factor in orchestrating a program of neuronal gene expression that contributes to neuronal cell survival (Campbell et al., 2005; Seijffers et al., 2007; Kiryu-Seo et al., 2008). We first examined the expression of ATF3 in DRG neurons before and after demyelination. ATF3 was not detectable in myelinated DRG cultures, but was significantly induced in DRG neurons after demyelination (Fig. 5A), as the number of ATF3-immunopositive neurons was significantly increased from 3 to 74% after demyelination (n = 15 fields; p < 0.01). Interestingly, ATF3 was not detected in unmyelinated cultures before or after lysolecithin treatment (Fig. 5B). These findings suggest that neurons induce an adaptive/stress response to demyelination that involves ATF3 expression.
Figure 5.
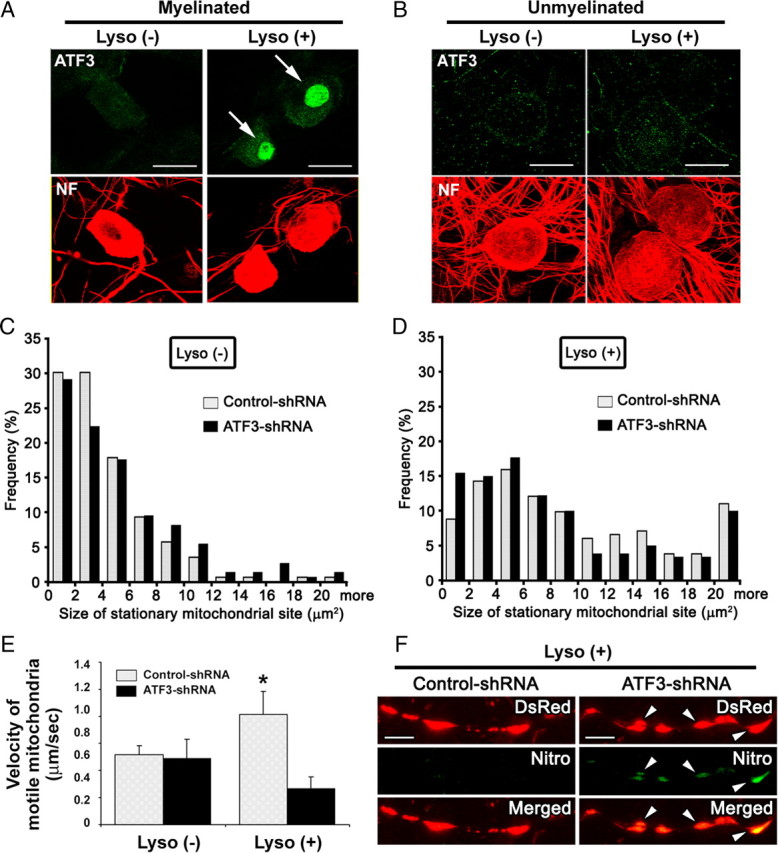
Expression of ATF3 protein and its effect on mitochondrial transport in DRG axons after demyelination. A, ATF3 (green) and neurofilament (red) distribution in myelinated DRG neurons with [Lyso(+)] or without [Lyso(−)] lysolecithin treatment. Note dense nuclear ATF3 immunostaining is observed in DRG neurons after lysolecithin treatment (arrows). B, Immunostaining for ATF3 in unmyelinated DRG cultures with [Lyso(+)] or without [Lyso(−)] lysolecithin treatment. Immunoreactivity of ATF3 is not increased after lysolecithin treatment of unmyelinated DRG cultures. C, D, Sizes of stationary mitochondrial sites in control shRNA- and ATF3 shRNA-treated axons with (D) or without (C) lysolecithin (Lyso) treatment. The sizes of stationary mitochondria are similar in control- and ATF3-shRNA treated cultures (n = 139 mitochondria for control-shRNA without lysolecithin, 147 for ATF3-shRNA without lysolecithin, 181 for control-shRNA with lysolecithin, and 180 for ATF3-shRNA with lysolecithin). E, Mean velocity of motile mitochondria in control shRNA- and ATF3 shRNA-treated axons. After demyelination, the increase in mitochondrial transport velocity was still observed under control-shRNA treatment but abolished under ATF3-shRNA treatment (n = 10 axons for control-shRNA without lysolecithin, 20 for ATF3-shRNA without lysolecithin, 11 for control-shRNA with lysolecithin, and 21 for ATF3-shRNA with lysolecithin; *p < 0.01). Error bars indicate SD. F, Immunostaining for nitrotyrosine (Nitro; green) in the demyelinated axons of DRG neurons infected with mito-DsRed (red) and treated with lysolecithin [Lyso(+)]. The neurons were also treated with control- or ATF3-shRNA. Immunoreactivity of nitrotyrosine in mitochondria was increased in ATF3 shRNA-treated DRG axons (arrowheads). Scale bars: A, B, 20 μm; F, 5 μm.
We next investigated whether ATF3 expression was critical for increased axonal mitochondrial stationary site size and increased mitochondrial transport velocity after demyelination. To address these questions, we coinfected control shRNA or ATF3 shRNA lentivirus with mito-DsRed2 lentivirus and examined the distribution and transport rate of axonal mitochondria. ATF3 shRNA suppressed the expression of neuronal ATF3 after demyelination, as the number of ATF3-positive cells was 2% compared with 70% in demyelinated neurons infected with control shRNA. In myelinated (Fig. 5C) and demyelinated axons (Fig. 5D) extending from control shRNA- and ATF3 shRNA-treated neurons, the size distribution of stationary mitochondrial sites was almost identical. However, after demyelination, axons extending from ATF3 shRNA-treated neurons did not show an increase in motile mitochondrial velocity, whereas axons extending from control shRNA-treated neurons in the demyelinated cultures showed a significant increase in transport rates of motile mitochondria compared with those in the myelinated cultures (Fig. 5E). These data support an ATF3-mediated increase in axonal mitochondrial transport velocity after demyelination, but no ATF3 effect on the size of stationary mitochondria.
Although the distribution of stationary mitochondrial site size was not altered by the ATF3 knockdown, impairment of mitochondrial transport caused by suppressed ATF3 expression may still impact axonal mitochondrial function. Alterations in mitochondrial transport can effect mitochondrial stationary site biogenesis and degradation by altering fission/fusion (Miller and Sheetz, 2004; Twig et al., 2008). To investigate the role of ATF3 in protecting demyelinated axons from oxidative damage, we compared the immunoreactivity of nitrotyrosine, a marker of oxidative stress (Beckman and Koppenol, 1996; Ischiropoulos, 1998), in demyelinated cultures treated with ATF3 or control shRNA. Nitrotyrosine immunoreactivity was significantly increased (p < 0.01) in the stationary mitochondrial sites of demyelinated axons after ATF3-shRNA treatment (54 ± 31 U; n = 54) compared with control-shRNA treatment (39 ± 24 U; n = 54) (Fig. 5F). In contrast, nitrotyrosine immunoreactivity was similar in the soma of ATF3 shRNA- and control shRNA-treated groups (data not shown). The induction of ATF3, therefore, ameliorates the accumulation of reactive oxidative species in axonal mitochondria, thereby supporting continued mitochondrial function in demyelinated axons.
Discussion
The present study investigated how and to what extent myelination and demyelination affect the distribution and transport of axonal mitochondria. The most striking finding from these experiments is that the size of axonal stationary mitochondrial sites was significantly increased by both myelination (2.3-fold) and demyelination (2.2-fold), without affecting the overall number of sites. Demyelination also increased the transport velocity of motile mitochondria. After remyelination, axonal mitochondrial stationary sites and transport velocity were similar to those in myelinated axons. Demyelination also induced a significant increase in neuronal expression of the stress-induced transcription factor ATF3. Inhibition of neuronal ATF3 expression abolished the demyelination-induced increase in mitochondrial transport velocity, but not the size of stationary mitochondrial sites. After ATF3 knockdown, nitrotyrosine immunoreactivity, a measure reflective of oxidative stress, was also significantly increased in axonal mitochondrial stationary sites. Collectively, these results establish that myelination, demyelination, and remyelination modulate axonal stationary mitochondrial site size and thereby help balance axonal ATP production and axonal energy requirements.
This is the first report to investigate mitochondrial dynamics and motility in live myelinated and demyelinated axons. Lentivirus delivery of Mito-DsRed2 exclusively and intensely labeled mitochondria in DRG neurons. Therefore, mitochondrial transport and distribution in individual living myelinated axons could be reliably investigated. Immunocytochemical staining of cultures immediately after live imaging confirmed the presence or absence of myelin. Myelination was extensive in our DRG cultures and voltage-gated Na+ channels were concentrated at nodes of Ranvier. Thus, we are confident that mitochondrial dynamics were reliably and reproducibly investigated in unmyelinated, myelinated, demyelinated, and remyelinated axons. Increased mitochondrial density has been reported in electron micrographs of demyelinated and dysmyelinated axons in vivo (Griffiths et al., 1998; Mutsaers and Carroll, 1998; Andrews et al., 2006; Hogan et al., 2009), and our data are consistent with these observations. We extend these studies by establishing that the increased mitochondrial density is attributable to an increase in the size of stationary mitochondrial sites. In addition, mitochondrial density has been previously shown to decrease during remyelination of optic nerves (Mutsaers and Carroll, 1998), consistent with DRG axons in the present study. The rates of mitochondrial transport measured in the present study (0.6–1.0 μm/s) are also within the range of velocities reported previously (Morris and Hollenbeck, 1993, 1995; Miller and Sheetz, 2004). Demyelination increases axonal mitochondrial volume in vivo and in vitro, and our data indicate that this increase is attributable to an increase in the size of stationary mitochondrial sites. The number of mitochondrial stationary sites was similar in unmyelinated, myelinated, demyelinated, and remyelinated DRG axons in vitro.
How could increases in mitochondrial stationary site size and bulk transport of axonal mitochondria benefit demyelinated axons? Axonal mitochondria have limited life spans that are regulated in part by their overall activity. Newly synthesized mitochondria are generated in the neuronal cell body, transported down the axon, and delivered to stationary sites, where they fuse with stationary mitochondria. Dysfunctional mitochondrial segments are removed from stationary mitochondria through a process called fission (Twig et al., 2008) and then transported to the neuronal perikarya, where they are degraded. Axonal conduction/depolarization depends on activation of voltage-gated Na+ channels in an energy-independent manner. The axolemma must be rapidly repolarized by axolemmal-enriched Na+/K+ ATPases, which exchange axonal Na+ for extracellular K+ in an energy-dependent manner. Therefore, by concentrating voltage-gated Na+ channels in the nodal axolemma, myelin increases the speed of nerve conduction and conserves energy. After demyelination, Na+ channels become diffusely distributed along the demyelinated axolemma (Craner et al., 2004). This restores nerve conduction, but at the expense of increased ATP consumption to drive the Na+/K+ ATPases. It is not surprising, therefore, that increases in axonal mitochondrial size and motility parallel the increased energy demands of nerve conduction after demyelination.
Myelin and myelin-forming cells provide trophic support to axons, and this support can be regulated at the level of individual internodes (for review, see Nave and Trapp, 2008). Key and interrelated aspects of this regulation include increased axoplasmic Ca2+ and posttranslational modifications of axoplasmic proteins. Focal inhibition of axonal mitochondrial movement can increase the size of stationary mitochondria (Morris and Hollenbeck, 1993; Chada and Hollenbeck, 2004). As described above, demyelination increases axoplasmic Ca2+ as a result of insufficient ATP production at stationary sites and altered ion channel dysfunction. Elevated axoplasmic Ca2+, therefore, would increase at or near stationary mitochondria. When elevated, axoplasmic Ca2+ binds to the EF hands of Miro, a protein involved in bridging the outer mitochondrial membrane and the mitochondria motor protein kinesin. Ca2+ binding to the EF-hand motifs of Miro inactivates kinesin and halts mitochondrial movement at stationary sites but does not affect bulk microtubule-mediated mitochondrial transport (Saotome et al., 2008; Wang and Schwarz, 2009). Myelination (Brady et al., 1999) and demyelination (Trapp et al., 1998) also alter the phosphorylation state of axonal proteins. Although protein phosphorylation can regulate axonal transport and mitochondrial fusion/fission, future studies will be required to delineate how such changes modulate mitochondrial dynamics in demyelinated axons.
In addition to local axonal changes, our data indicate that neuronal gene expression increases the rate of bulk mitochondrial transport in demyelinated axons. The role of neuronal gene expression after demyelination is supported by the induction of the transcription factor ATF3 in neuronal cell bodies. ATF3 is a stress response gene that facilitates axonal regeneration and survival (Nakagomi et al., 2003; Seijffers et al., 2007; Kiryu-Seo et al., 2008). Knockdown of ATF3 expression by shRNA eliminated the demyelination-induced increase in bulk axonal mitochondrial transport. The induction of ATF3 supports an axonally initiated/derived signal that is transported to the neuronal cell body. In this regard, ATF3 expression is modulated by retrograde axonal transport of JNK (c-Jun N-terminal kinase) (Lindwall et al., 2004; Lindwall and Kanje, 2005). Axonally derived signaling pathways can also be initiated by neurotrophins and the myelin proteins, NOGO, MAG (myelin-associated glycoprotein), and oligodendrocyte–myelin glycoprotein, and involve activation of cAMP and protein kinase A (Filbin, 2003; Hannila and Filbin, 2008). Similar pathways and additional transcription factors may be modulated after demyelination.
Do the described changes in gene expression have an effect on demyelinated axons? Inhibiting the induction of ATF3 after demyelination with shRNA produced a significant increase in nitrotyrosine labeling of mitochondria in demyelinated axons. Nitrotyrosine, produced by the reaction between nitric oxide (NO) and superoxide, is widely used as a marker for oxidative damage to mitochondrial proteins. Inducible NO synthase, a key enzyme for NO production, is increased in demyelinating environments (Bö et al., 1994; Beckman and Koppenol, 1996). Mitochondrial functions are directly inhibited by NO and by oxidative modifications of mitochondrial proteins (Beckman and Koppenol, 1996; Smith et al., 1999; Smith and Lassmann, 2002). Oxidative damage to axonal mitochondria has been implicated in the pathogenesis of neurodegenerative diseases, including primary myelin diseases (Gilgun-Sherki et al., 2004; Lin and Beal, 2006; Kalman et al., 2007). Inhibition of mitochondrial translocation to degradative/lysosomal compartments also results in the accumulation of mitochondrial oxidative damage markers, including nitrotyrosine (Twig et al., 2008). Our data indicate that the ATF3-induced increase in bulk axonal transport helps maintain stationary mitochondrial function upon demyelination and thereby contributes to increased ATP production after demyelination.
Stationary mitochondrial sites are stable axonal structures in myelinated, demyelinated, and remyelinated axons, as their number per unit length of axon did not vary. Their size, however, is dynamically increased by myelination and demyelination and is significantly decreased by remyelination. By adjusting the size of stationary mitochondrial sites, axons dynamically regulate ATP production to meet the energy demands of nerve conduction.
Footnotes
This work was supported by National Institutes of Health Grant NS38186 (B.D.T.) and a National Multiple Sclerosis Society Postdoctoral Fellowship (N.O.). We thank Dr. Ansi Chang and Courtney Batt for helpful assistance and Dr. Chris Nelson for editorial assistance.
References
- Andrews H, White K, Thomson C, Edgar J, Bates D, Griffiths I, Turnbull D, Nichols P. Increased axonal mitochondrial activity as an adaptation to myelin deficiency in the Shiverer mouse. J Neurosci Res. 2006;83:1533–1539. doi: 10.1002/jnr.20842. [DOI] [PubMed] [Google Scholar]
- Beckman JS, Koppenol WH. Nitric oxide, superoxide, and peroxynitrite: the good, the bad, and ugly. Am J Physiol. 1996;271:C1424–C1437. doi: 10.1152/ajpcell.1996.271.5.C1424. [DOI] [PubMed] [Google Scholar]
- Birgbauer E, Rao TS, Webb M. Lysolecithin induces demyelination in vitro in a cerebellar slice culture system. J Neurosci Res. 2004;78:157–166. doi: 10.1002/jnr.20248. [DOI] [PubMed] [Google Scholar]
- Bö L, Dawson TM, Wesselingh S, Mörk S, Choi S, Kong PA, Hanley D, Trapp BD. Induction of nitric oxide synthase in demyelinating regions of multiple sclerosis brains. Ann Neurol. 1994;36:778–786. doi: 10.1002/ana.410360515. [DOI] [PubMed] [Google Scholar]
- Brady ST, Witt AS, Kirkpatrick LL, de Waegh SM, Readhead C, Tu PH, Lee VM. Formation of compact myelin is required for maturation of the axonal cytoskeleton. J Neurosci. 1999;19:7278–7288. doi: 10.1523/JNEUROSCI.19-17-07278.1999. [DOI] [PMC free article] [PubMed] [Google Scholar]
- Campbell G, Hutchins K, Winterbottom J, Grenningloh G, Lieberman AR, Anderson PN. Upregulation of activating transcription factor 3 (ATF3) by intrinsic CNS neurons regenerating axons into peripheral nerve grafts. Exp Neurol. 2005;192:340–347. doi: 10.1016/j.expneurol.2004.11.026. [DOI] [PubMed] [Google Scholar]
- Chada SR, Hollenbeck PJ. Nerve growth factor signaling regulates motility and docking of axonal mitochondria. Curr Biol. 2004;14:1272–1276. doi: 10.1016/j.cub.2004.07.027. [DOI] [PubMed] [Google Scholar]
- Chan DC. Mitochondria: dynamic organelles in disease, aging, and development. Cell. 2006;125:1241–1252. doi: 10.1016/j.cell.2006.06.010. [DOI] [PubMed] [Google Scholar]
- Chang DT, Reynolds IJ. Differences in mitochondrial movement and morphology in young and mature primary cortical neurons in culture. Neuroscience. 2006;141:727–736. doi: 10.1016/j.neuroscience.2006.01.034. [DOI] [PubMed] [Google Scholar]
- Craner MJ, Newcombe J, Black JA, Hartle C, Cuzner ML, Waxman SG. Molecular changes in neurons in multiple sclerosis: altered axonal expression of Nav1.2 and Nav1.6 sodium channels and Na+/Ca2+ exchanger. Proc Natl Acad Sci U S A. 2004;101:8168–8173. doi: 10.1073/pnas.0402765101. [DOI] [PMC free article] [PubMed] [Google Scholar]
- Dutta R, McDonough J, Yin X, Peterson J, Chang A, Torres T, Gudz T, Macklin WB, Lewis DA, Fox RJ, Rudick R, Mirnics K, Trapp BD. Mitochondrial dysfunction as a cause of axonal degeneration in multiple sclerosis patients. Ann Neurol. 2006;59:478–489. doi: 10.1002/ana.20736. [DOI] [PubMed] [Google Scholar]
- Fabricius C, Berthold CH, Rydmark M. Axoplasmic organelles at nodes of Ranvier. II. Occurrence and distribution in large myelinated spinal cord axons of the adult cat. J Neurocytol. 1993;22:941–954. doi: 10.1007/BF01218352. [DOI] [PubMed] [Google Scholar]
- Fex Svenningsen A, Shan WS, Colman DR, Pedraza L. Rapid method for culturing embryonic neuron-glial cell cocultures. J Neurosci Res. 2003;72:565–573. doi: 10.1002/jnr.10610. [DOI] [PubMed] [Google Scholar]
- Filbin MT. Myelin-associated inhibitors of axonal regeneration in the adult mammalian CNS. Nat Rev Neurosci. 2003;4:703–713. doi: 10.1038/nrn1195. [DOI] [PubMed] [Google Scholar]
- Gilgun-Sherki Y, Melamed E, Offen D. The role of oxidative stress in the pathogenesis of multiple sclerosis: the need for effective antioxidant therapy. J Neurol. 2004;251:261–268. doi: 10.1007/s00415-004-0348-9. [DOI] [PubMed] [Google Scholar]
- Griffiths I, Klugmann M, Anderson T, Yool D, Thomson C, Schwab MH, Schneider A, Zimmermann F, McCulloch M, Nadon N, Nave KA. Axonal swellings and degeneration in mice lacking the major proteolipid of myelin. Science. 1998;280:1610–1613. doi: 10.1126/science.280.5369.1610. [DOI] [PubMed] [Google Scholar]
- Hannila SS, Filbin MT. The role of cyclic AMP signaling in promoting axonal regeneration after spinal cord injury. Exp Neurol. 2008;209:321–332. doi: 10.1016/j.expneurol.2007.06.020. [DOI] [PMC free article] [PubMed] [Google Scholar]
- Hogan V, White K, Edgar J, McGill A, Karim S, McLaughlin M, Griffiths I, Turnbull D, Nichols P. Increase in mitochondrial density within axons and supporting cells in response to demyelination in the Plp1 mouse model. J Neurosci Res. 2009;87:452–459. doi: 10.1002/jnr.21867. [DOI] [PubMed] [Google Scholar]
- Hollenbeck PJ, Saxton WM. The axonal transport of mitochondria. J Cell Sci. 2005;118:5411–5419. doi: 10.1242/jcs.02745. [DOI] [PMC free article] [PubMed] [Google Scholar]
- Ischiropoulos H. Biological tyrosine nitration: a pathophysiological function of nitric oxide and reactive oxygen species. Arch Biochem Biophys. 1998;356:1–11. doi: 10.1006/abbi.1998.0755. [DOI] [PubMed] [Google Scholar]
- Kalman B, Laitinen K, Komoly S. The involvement of mitochondria in the pathogenesis of multiple sclerosis. J Neuroimmunol. 2007;188:1–12. doi: 10.1016/j.jneuroim.2007.03.020. [DOI] [PubMed] [Google Scholar]
- Kiryu-Seo S, Kato R, Ogawa T, Nakagomi S, Nagata K, Kiyama H. Neuronal injury-inducible gene is synergistically regulated by ATF3, c-Jun, and STAT3 through the interaction with Sp1 in damaged neurons. J Biol Chem. 2008;283:6988–6996. doi: 10.1074/jbc.M707514200. [DOI] [PubMed] [Google Scholar]
- Kumada T, Lakshmana MK, Komuro H. Reversal of neuronal migration in a mouse model of fetal alcohol syndrome by controlling second-messenger signalings. J Neurosci. 2006;26:742–756. doi: 10.1523/JNEUROSCI.4478-05.2006. [DOI] [PMC free article] [PubMed] [Google Scholar]
- Lin MT, Beal MF. Mitochondrial dysfunction and oxidative stress in neurodegenerative diseases. Nature. 2006;443:787–795. doi: 10.1038/nature05292. [DOI] [PubMed] [Google Scholar]
- Lindwall C, Kanje M. Retrograde axonal transport of JNK signaling molecules influence injury induced nuclear changes in p-c-Jun and ATF3 in adult rat sensory neurons. Mol Cell Neurosci. 2005;29:269–282. doi: 10.1016/j.mcn.2005.03.002. [DOI] [PubMed] [Google Scholar]
- Lindwall C, Dahlin L, Lundborg G, Kanje M. Inhibition of c-Jun phosphorylation reduces axonal outgrowth of adult rat nodose ganglia and dorsal root ganglia sensory neurons. Mol Cell Neurosci. 2004;27:267–279. doi: 10.1016/j.mcn.2004.07.001. [DOI] [PubMed] [Google Scholar]
- Mahad DJ, Ziabreva I, Campbell G, Lax N, White K, Hanson PS, Lassmann H, Turnbull DM. Mitochondrial changes within axons in multiple sclerosis. Brain. 2009;132:1161–1174. doi: 10.1093/brain/awp046. [DOI] [PMC free article] [PubMed] [Google Scholar]
- Miller KE, Sheetz MP. Axonal mitochondrial transport and potential are correlated. J Cell Sci. 2004;117:2791–2804. doi: 10.1242/jcs.01130. [DOI] [PubMed] [Google Scholar]
- Morris RL, Hollenbeck PJ. The regulation of bidirectional mitochondrial transport is coordinated with axonal outgrowth. J Cell Sci. 1993;104:917–927. doi: 10.1242/jcs.104.3.917. [DOI] [PubMed] [Google Scholar]
- Morris RL, Hollenbeck PJ. Axonal transport of mitochondria along microtubules and F-actin in living vertebrate neurons. J Cell Biol. 1995;131:1315–1326. doi: 10.1083/jcb.131.5.1315. [DOI] [PMC free article] [PubMed] [Google Scholar]
- Mutsaers SE, Carroll WM. Focal accumulation of intra-axonal mitochondria in demyelination of the cat optic nerve. Acta Neuropathol. 1998;96:139–143. doi: 10.1007/s004010050873. [DOI] [PubMed] [Google Scholar]
- Nakagomi S, Suzuki Y, Namikawa K, Kiryu-Seo S, Kiyama H. Expression of the activating transcription factor 3 prevents c-Jun N-terminal kinase-induced neuronal death by promoting heat shock protein 27 expression and Akt activation. J Neurosci. 2003;23:5187–5196. doi: 10.1523/JNEUROSCI.23-12-05187.2003. [DOI] [PMC free article] [PubMed] [Google Scholar]
- Nave KA, Trapp BD. Axon-glial signaling and the glial support of axon function. Annu Rev Neurosci. 2008;31:535–561. doi: 10.1146/annurev.neuro.30.051606.094309. [DOI] [PubMed] [Google Scholar]
- Saotome M, Safiulina D, Szabadkai G, Das S, Fransson A, Aspenstrom P, Rizzuto R, Hajnóczky G. Bidirectional Ca2+-dependent control of mitochondrial dynamics by the Miro GTPase. Proc Natl Acad Sci U S A. 2008;105:20728–20733. doi: 10.1073/pnas.0808953105. [DOI] [PMC free article] [PubMed] [Google Scholar]
- Seijffers R, Mills CD, Woolf CJ. ATF3 increases the intrinsic growth state of DRG neurons to enhance peripheral nerve regeneration. J Neurosci. 2007;27:7911–7920. doi: 10.1523/JNEUROSCI.5313-06.2007. [DOI] [PMC free article] [PubMed] [Google Scholar]
- Smith KJ, Lassmann H. The role of nitric oxide in multiple sclerosis. Lancet Neurol. 2002;1:232–241. doi: 10.1016/s1474-4422(02)00102-3. [DOI] [PubMed] [Google Scholar]
- Smith KJ, Kapoor R, Felts PA. Demyelination: the role of reactive oxygen and nitrogen species. Brain Pathol. 1999;9:69–92. doi: 10.1111/j.1750-3639.1999.tb00212.x. [DOI] [PMC free article] [PubMed] [Google Scholar]
- Trapp BD, Nave KA. Multiple sclerosis: an immune or neurodegenerative disorder? Annu Rev Neurosci. 2008;31:247–269. doi: 10.1146/annurev.neuro.30.051606.094313. [DOI] [PubMed] [Google Scholar]
- Trapp BD, Stys PK. Virtual hypoxia and chronic necrosis of demyelinated axons in multiple sclerosis. Lancet Neurol. 2009;8:280–291. doi: 10.1016/S1474-4422(09)70043-2. [DOI] [PubMed] [Google Scholar]
- Trapp BD, Peterson J, Ransohoff RM, Rudick R, Mörk S, Bö L. Axonal transection in the lesions of multiple sclerosis. N Engl J Med. 1998;338:278–285. doi: 10.1056/NEJM199801293380502. [DOI] [PubMed] [Google Scholar]
- Tsujino H, Kondo E, Fukuoka T, Dai Y, Tokunaga A, Miki K, Yonenobu K, Ochi T, Noguchi K. Activating transcription factor 3 (ATF3) induction by axotomy in sensory and motoneurons: a novel neuronal marker of nerve injury. Mol Cell Neurosci. 2000;15:170–182. doi: 10.1006/mcne.1999.0814. [DOI] [PubMed] [Google Scholar]
- Twig G, Elorza A, Molina AJ, Mohamed H, Wikstrom JD, Walzer G, Stiles L, Haigh SE, Katz S, Las G, Alroy J, Wu M, Py BF, Yuan J, Deeney JT, Corkey BE, Shirihai OS. Fission and selective fusion govern mitochondrial segregation and elimination by autophagy. EMBO J. 2008;27:433–446. doi: 10.1038/sj.emboj.7601963. [DOI] [PMC free article] [PubMed] [Google Scholar]
- Wang X, Schwarz TL. The mechanism of Ca2+-dependent regulation of kinesin-mediated mitochondrial motility. Cell. 2009;136:163–174. doi: 10.1016/j.cell.2008.11.046. [DOI] [PMC free article] [PubMed] [Google Scholar]
- Witte ME, Bø L, Rodenburg RJ, Belien JA, Musters R, Hazes T, Wintjes LT, Smeitink JA, Geurts JJ, De Vries HE, van der Valk P, van Horssen J. Enhanced number and activity of mitochondria in multiple sclerosis lesions. J Pathol. 2009;219:193–204. doi: 10.1002/path.2582. [DOI] [PubMed] [Google Scholar]
- Woodruff RH, Franklin RJ. Demyelination and remyelination of the caudal cerebellar peduncle of adult rats following stereotaxic injections of lysolecithin, ethidium bromide, and complement/anti-galactocerebroside: a comparative study. Glia. 1999;25:216–228. doi: 10.1002/(sici)1098-1136(19990201)25:3<216::aid-glia2>3.0.co;2-l. [DOI] [PubMed] [Google Scholar]