

Abstract
Gene networks of protective lymphocytes after immune activation with live attenuated vaccines remain poorly characterized. Because Mycobacterium bovis bacille Calmette-Guérin (BCG) vaccine can confer protection against fatal forms of tuberculosis in humans and monkeys, we made use of macaque models to optimally study immune gene networks after BCG vaccination/infection. We first established and validated a large-scale real-time quantitation system and then used it to measure expression levels of 138 immune genes after BCG vaccination/infection of rhesus macaques. Systemic BCG vaccination induced up to 600-fold increases in expression of 78 immune genes among the 138 genes tested at the time when BCG-elicited T cell responses and immunity were apparent. These up-regulated transcripts constituted multiple gene networks that were linked to various aspects of immune function. Surprisingly, the up-regulation of most of these immune genes in the gene networks occurred at 1 week and was sustained at ≥6 weeks after BCG vaccination/infection. Although early activation of immune gene networks was an immune correlate of anti-BCG immunity, prolonged up-regulation of these networks coincided with the development of vaccine-elicited T cell responses after BCG vaccination/infection. These findings provide molecular evidence suggesting that the BCG-induced gene networks may represent global transcriptomes and proteomes underlying the development of T cell responses and, ultimately, immunity to mycobacteria.
Live attenuated vaccines have proved to be protective against a number of infectious diseases [1–6]. Although the development and evaluation of live vaccines are mainly focused on safety and the efficacies of vaccine-elicited immune responses and vaccine-induced protection, little is known about the global transcriptional responses of protective lymphocytes elicited by a live vaccine. Studies of global transcriptional responses or gene networks during the development of protective immune responses after vaccination can facilitate our understanding of the molecular mechanisms of live vaccine–mediated immunity and may provide useful information for developing and evaluating new or better vaccines from safety and efficacy standpoints.
Among infectious diseases, tuberculosis remains one of the leading causes of death, with an estimated 8–9 million new cases occurring worldwide annually [7]. The high rate of an adult form of pulmonary tuberculosis may be attributed, in part, to the absence of a highly effective vaccine. Live attenuated Mycobacterium bovis bacille Calmette-Guérin (BCG) vaccine is protective against M. tuberculosis infection and fatal forms of tuberculosis in children [1, 3, 8], although it is unable to consistently confer protection against an adult form of pulmonary tuberculosis [1, 3, 8, 9]. Elucidating BCG-elicited immune responses that confer short-term protection against M. tuberculosis infection may facilitate the development of tuberculosis vaccines that are better than BCG [10, 11]. In this regard, exploring the gene networks of BCG-elicited lymphocytes may provide information for the rational design and evaluation of new tuberculosis vaccines [12, 13].
Studies by us and others suggest that BCG-vaccinated monkeys can provide a dual model system in which to explore both vaccine-elicited T cell responses and anti-mycobacterium immunity at cellular or molecular levels [14–16]. As a vaccine model, BCG immunization can serve as a prototype of live vaccine–elicited T cell immune responses. As an infection model, BCG-infected monkeys can be assessed for immune correlates for clearance of BCG bacteria after systemic BCG vaccination [15, 16]. In fact, BCG vaccination has been shown to confer protection against early fatal tuberculosis in rhesus macaques after aerosol and low-dose M. tuberculosis infection [15, 17–20]. These findings are consistent with BCG’s capability to protect against M. tuberculosis infection in children [1–3]. We therefore made use of BCG-vaccinated rhesus macaques to study global gene-expression profiles of protective lymphocytes. We first established and validated a large-scale real-time quantitation system for measuring 138 macaque immune genes and then used this system to identify global gene networks that underscore BCG-elicited T cell immune responses and associated anti-BCG immunity.
MATERIALS AND METHODS
Macaques and BCG vaccination/infection
Normal, healthy rhesus macaques, 2–6 years old, were included in the present study. Monkeys were vaccinated intravenously with 1 × 10⁶ cfu of M. bovis BCG (Pasteur strain), as described elsewhere [15, 16]. The BCG vaccination/infection of monkeys was done on the basis of the animal protocol that was approved by the University of Illinois at Chicago Institutional Animal Care and Use Committee. Blood samples were collected weekly or biweekly after BCG vaccination/infection, to measure the expression kinetics of immune genes in peripheral-blood mononuclear cells (PBMCs).
Macaque immune gene templates
Because a number of macaque immune genes are not available in GenBank, we isolated cDNA of those genes through polymerase chain reaction (PCR)–based cloning and sequencing, using primer sets that were designed on the basis of the sequences of their human counterparts. The isolated PCR products of individual macaque genes were sequenced using a direct sequencing technique [21]. The sequences of individual genes were used for designing primer sets and probes for real-time quantitative PCR, on the basis of recommendations given in Primer Express software (PE Applied Biosystems); the cloned cDNA of individual genes serves as template standards for real-time quantitation. Table 1 shows the sequences of these isolated macaque genes and other genes available in GenBank.
RNA isolation and cDNA synthesis
PBMCs (6 × 10⁶) were collected at each time point, mixed with 800 μL of TRIzol reagent (Invitrogen), and stored at −70°C until use. Total RNA was isolated from PBMCs by the TRIzol isolation method [15]. cDNA synthesis was done by use of the protocol provided in the cDNA Synthesis Kit from Clontech Laboratories, as described elsewhere [15].
Large-scale real-time quantitation system for measuring 138 macaque immune genes
The large-scale real-time quantitation system was established on the basis of our extensive experience with real-time quantitative PCR, as described elsewhere [14, 15, 22–26]. The names and abbreviations of individual genes as well as sequences of primers and FAM probes for the genes are listed in table 2. Real-time quantitative PCR was performed using PE Applied Biosystems 7700 single-reporter sequence-detection systems. The total reaction volume was 12.5 μL; it contained 6.25 μL of master mix (PE Applied Biosystems), 0.5 μL of 12.5 pmol/μL forward primer, 0.5 μL of 5 pmol/μL FAM probe (Applied Biosystems), 2.75 μL of H2O, and 2 μL of cDNA diluted 1:10 or 1:20. Reaction wells for each sample were done in triplicate. The real-time PCR conditions were 50°C for 2 min, 95°C for 10 min, 40 cycles of 95°C for 15 s, and 60°C for 1 min. Six defined copies of each gene template were included in each PCR microplate, to serve as standards for real-time quantitation. All amplifications were done in an optical 96-well reaction plate with an optical membrane cover (MicroAmp; PE Applied Biosystems). To minimize variation, cDNA samples prospectively collected from each rhesus macaque were run together in a plate for quantitation of each gene. All data were analyzed using GeneAmp 7700 SDS software. The expression values of individual genes were normalized on the basis of the values of the β-actin or GAPDH housekeeping gene (number of copies/1 × 105 β-actin or GAPDH transcripts). The changes in expression for each gene were calculated by dividing the postvaccination values by the prevaccination values. The data were then expressed as a fold change for the postvaccination value relative to the baseline value for each gene (i.e., fold change equals copies for the week 2 sample divided by the copies for the week 0 sample).
Table 2.
Names, abbreviations, and oligonucleotide sequences of 138 macaque immune genes investigated by use of a large-scale real-time quantitation system.
| Gene | 5′ primer | 3′ primer | Probe | Accession no. or sourcea |
|---|---|---|---|---|
| Interleukin 1α (IL-1α) | TTCGAGCCAATGATCAGCAC | CCCATGTCAAATTTCACTGCTTC | TCACGGCTGCTGCAATACATAATCTGGA | MMU19844 |
| Interleukin 1β (IL-1β) | GGTTCCCTGCCCACAGATCT | CGTCGTTATTGCGTGTGTC | CCAGGACAATGACCTGAGCACCTTGA | MMU19845 |
| Interleukin 2 (IL-2) | GGACTTAATCAGCAATATCAACGTAATAG | TCTACAATGGTTGCTGTCTCATCA | TCTGGAACTAAAGGGATCTGAAACAACACTGATG | MMU19847 |
| Interleukin 3 (IL-3) | ATCAGCAATCGAGAGCATTCTTAA | TGGGTGCGGCCGTG | AATCTCCCACCATGCCTGCCCAT | Chen Lab |
| Interleukin 4 (IL-4) | ACTCTGTGCACCAAGTTGACCAT | AGCCCTGCAGAAGGTTTCCT | ACGGACATCCTTGCTGCCTCCAAG | MACIN4A, NM001032904, AY376144 |
| Interleukin 5 (IL-5) | CACAGTTGGTGATGTTTATGTACAGG | GCACTGCTTTCTACTCATCGAACTC | CAGGAATCCTCAGAGTCTCATTGCCTATCAGC | MMU19848 |
| Interleukin 6 (IL-6) | CCAGGCAAGTGTCCTCATTGA | GAGGCACTGGCAGAAAACAAC | CATCCATCTTTTTCAGCCATCTTTGGAAGGTT | MACIN6A, AB000554, AY849928 |
| Interleukin 7 (IL-7) | TGCTACCAATTTCTTTCATGCTG | ATTGAAGGTAAAGATGGCAAACAA T | CCAATAATTGATCGATGCTGACCATTAGAACACT | NM001032846, AF401221 |
| Interleukin 8 (IL-8) | AGCTCTCTTCCATCGGAAAGTTT | CCTTTCCACCCCAAATTTATCAA | TGTATTGGCACAGTGTGGTCCACTCTCAAT | NM001032965, MMU19849 |
| Interleukin 9 (IL-9) | TGTGACCAGTTGTCTCTGTCTGC | GACAGTCCCTCCCTGAAGCA | CATTCCTTCTGACAACTGCCCTGGACC | Chen Lab |
| Interleukin 10 (IL-10) | AAGACCCTCAGGCTGAGGCT | TCCACGGCCTTGCTCTTG | CGCTGTCATCGATTTCTTCCCTGTGAA | Chen Lab |
| Interleukin 12α (IL-12α) | GCAGCTTCTTCATCAGGGACA | TTCTTTAATGGCTTCAGCTGCA | CATCAAACCCGACCCACCCAAGAAC | MMU19841 |
| Interleukin 12β (IL-12β) | CAGCAACACGCTTCAGAAGG | CAGGCCTCTACTGTGCTGGTT | ACCCTTGCACTTCTGAAGAGATTGATCATGA | MMU19842 |
| Interleukin 13 (IL-13) | AACCTGACAGCTGGCGTGTAC | CTGGGTCTTCTCGATGGCAC | TGCAGCCCTGGAATCCCTGATCAAC | AY849927, NM001032929, Chen Lab |
| Interleukin 15 (IL-15) | TCATTTTGGGCTGTTTCAGTG | ACTTCATTGCTGTTACCTTGCAAC | CTCCCTAAAACAGAAGCCAACTGGGTGAAT | MMU19843, AB000555 |
| Interleukin 16 (IL-16) | GCACCTGGGACCACACATC | AGGCAGTTGAGAGGAGCCAAA | CCTCCATCAAGCAGAGAATCAGCTCCT TT | NM001032808, AF017108 |
| Interleukin 17 (IL-17) | CACCTCACCTTGGAATCTCCA | CATTTTGCCTCCCAGATCACA | CGCAATGAGGACCCTGAGAGATATCCCT | Chen Lab |
| Interleukin 18 (IL-18) | TGAGAACAGAATTATTTCCTTTAAGGAA | TCACAAGCTAGAAAGTATCCTTCGTATG | TGACATCATATTCTTTCAGAGAAGTGTCCCAGGA | NM001032834, AF303732 |
| Interleukin 19 (IL-19) | AGCTAAGGACACCTTCCCAAATG | CTTGGTCACGCAGCACACA | CACTATCCTGTCCACATTGGAGACTCTGCAG | Chen Lab |
| Interleukin 20 (IL-20) | GAGGACTGAGTCTTTGCAAGACAC | TCCAGATAGAGTCGTAGCAAATGG | AAGCCTGCGGATCAGTGCTGTCTTCTAC | Chen Lab |
| Interleukin 21 (IL-21) | TGTGAATGACTTGGACCCTGAA | AAACAGGAAATAGCTGACCACTCA | TCTGCCAGCTCCAGAAGATGTAGAGACAAACT | Chen Lab |
| Interleukin 22 (IL-22) | CCCTCAATCGGATAGGTTCCA | AGACTGTTGCTGAGCCTGGC | CTTATATGCAGGAGGTGGTGCCCTTCCT | Chen Lab |
| Interleukin 23α (IL-23α) | CTACTGGGCCTCAGCCAACT | GGGCTTGGAATCTGCTGAGTC | CTGCAGCCTGAGGGTCACCACTGG | Chen Lab |
| Interleukin 27 (IL-27) | GTTCAAGGCAGAGGTGCGA | TTCCCTTTCAAATGCAGCTTTAG | CGCCGAAATCGAGTACGCCATGG | Chen Lab |
| Interferon-α (IFN-α) | GACTAATACACCAGCTCACCTTTTTATG | TAAATAGATAGTAGATCAGTCAGCATGGTCA | TCTGCCATTTCAAAGATTCATGTTTCTGCTATG | Chen Lab |
| Interferon-β (IFN-β) | GCAATTGAATGGAAGGCTTGA | AGTCTCATTCCAGCCAGTGCTAG | TATTGCCTCAAGGACAGGA | MFA011909, Chen Lab |
| Interferon-γ (IFN-γ) | GCTGACCAATTATTCGGTAACTGA C | AGTTCAGCCATCACTTGGATGA | CAAATGTCCACCGCAAGGCAGTACATGAA | MACIFNG, NM001032905, AY376145 |
| Macrophage migration inhibitory factor (MIF) | ATGTTCATCGTAAACACCAACGTG | TGCTGGGTGAGCTCGGAG | CCTCCGTGCCGGAC | AY656809, AB169695, MN001032915, Chen Lab |
| Tumor necrosis factor–α (TNF-α) | AACCCCAAGTGACAAGCCTG | CCACTGGAGCTGCCCCT | AGCCCATGTTGTAGCAAACCCTCAAGC | MMU19850, AB000513, Chen Lab |
| Interleukin 1 receptor 1 (IL-1R1) | TTCAGGACATTACTACTGTGTGGTAAGA | TGGCTTCTGCATTATAACACAAGTT | CATCTTACTGCCTCAGAATTAAAATAACTGCAAAATTTGT | AY497008 |
| Interleukin 1 receptor 2 (IL-1R2) | GAGACCATTCCTGTGATCATTTCC | CACGGGATTGTCAGTCTCGA | CCCTCAAGACCATATCGGCTTCTCTGG | AY172102 |
| Interleukin 2 receptor α (IL-2Rα) | GGCTTCATTTTCCCACGGT | GCAGCTGGCGGACCAA | TCCCTGCAGTGACCTGGAAGGCTC | NM001032917, AY693777 |
| Interleukin 2 receptor β (IL-2Rβ) | TGGCCATCCAGGACTTCAA | TGGACGACTTGGAGGGAGAT | CCCTTTGAGAACCTTCGCCTGATGG | DQ223724 |
| Interleukin 2 receptor γ (IL-2Rγ) | AGCTCCAGGACCCACGG | GGGATCACCAGATTCTGCAGTT | AACCCAGGAGACAGGCCACACAGATG | NM001035529, DQ222417 |
| Interleukin 3 receptor α (IL-3Rα) | GTTCCCACATCCTGGTGAGG | CTCCAGTCATGTTGGGTGGAG | AGGAGCGCAGCCGTCAGTATCCC | Chen Lab |
| Interleukin 4 receptor (IL-4R) | AAAACGACCCGGCAGATTC | GAAATTCCAGACTTCAGGGTGCT | AGAATCCATAACGTGACCTACCTAAAACCCACC | AY459192, Chen Lab |
| Interleukin 5 receptor α (IL-5Rα) | CGCTCCAAAAGAAGATGATTATGA | GGTCCGCACACTTGCTGAA | ACCAGAATCACTGAAAGCAAATGCGTAACC | Chen Lab |
| Interleukin 6 receptor (IL-6R) | TTCGGCCGGACTGTTCTG | GCACCCCATCTCCGACG | AACTTCCTCACCAACAGCACAGCCTTG | Chen Lab |
| Interleukin 7 receptor (IL-7R) | TGAAAACAAATGGATGCATGTG | TACATTGCTTCAGGTTGGAGGTT | CCAGCACAAAGCTGACACTCCTGCA | Chen Lab |
| Interleukin 8 receptor α (IL-8Rα) | TTAGATCAAACCATTGCTGAAACT | GTTGAGTGACTGAGTCTCTAGCCTACA | CATGCCACCTACGGATGAAGATTATAGCCC | Chen Lab |
| Interleukin 9 receptor (IL-9R) | CACCCCGACAATGTGATCC | TTCAAGAAGCAGGAAGAGGCC | TGTGCTGGGCCCGCTCCC | Chen Lab |
| Interleukin 10 receptor α (IL-10Rα) | AAGGATGAAGCCATTGTGGATCT | CTGGACCGTCACCAACACC | ACACTGCCAACTGTCAGAGTCACTTCATCC | Chen Lab |
| Interleukin 10 receptor β (IL-10Rβ) | GGCTGAATTTGCAGATGAGCA | ACGCATATGTAAAGAATCAGCAAGTAC | TCAGACTGGGTAAACATCACCTTCTGTCCTGT | Chen Lab |
| Interleukin 11 receptor α (IL-11Rα) | CCAGCCAGATCAGCGGTT | GCTATCAGCTCCTAGAACTGTCTTCTT | ACCCACCCGCTACCTCACCTCCTACAG | Chen Lab |
| Interleukin 12 receptor β1 (IL-12Rβ1) | CGGTCCTGTCCACCTACCACT | AGCTATGATTCTTCACCGAGACG | CAATGCCTCAGCAGCTGGGACACC | Chen Lab |
| Interleukin 12 receptor β2 (IL-12Rβ2) | TCTGGCCTCTGTAACATTAAC CATAT | GGGACTGGTACTGCTTAATCGACT | TGCCTGCTGTTACTGGGCCGATATCT | Chen Lab |
| Interleukin 13 receptor α1 (IL-13Rα1) | ATTTGGCACAACCTGAGCTACA | TCCAGGCTTCTGTGCCAATAG | TGGAAGGAATACCAGTCCCGACACTAACTATACTCT | Chen Lab |
| Interleukin 15 receptor α (IL-15Rα) | GCCACAGCGACACCACTG | CAGGAGAGACACAGCGCTCA | CTATCTCCACATCCACCGTCCTGCTGTGT | Chen Lab |
| Interleukin 17 receptor (IL-17R) | CATGGAGAACCACAGCTGCTT | TGGTGGAAGTCCTCTGGTCTG | AGCACATGCACCACGTACCTGCG | Chen Lab |
| Interleukin 18 receptor 1 (IL-18R1) | TCAGCAAAGCAGAGCAGTTGA | GTGCCAGTTCTTCTTGGACCA | CCTTACATCTTTTCCTAATTCCACTGCAACATGGT | Chen Lab |
| Interleukin 21 receptor (IL-21R) | AGACACTTCTTGAGTCCACTGAGATC | GAGCTGCAGTACAGAAACCGG | CTTTCTCCTCGGACTCACAGCCCAGG | Chen Lab |
| Interferon-γ receptor (IFN-γR) | CTGGCACTGAATCTCGTCACAA | AGGTGACAATGTGTATGTGAGAAT GA | TCTGCGTCAGTATTTTATACT GGATCTCACTTCCG | AF227551 |
| Tumor necrosis factor receptor (TNFR) | CTGCCTCAATGGGACCGT | CCTGCATGGCAGGTGCA | CACCTCTCCTGCCAGGAGAAACAGAACA | AB220482, Chen Lab |
| Chemokine (C-C motif) ligand 27 (CCL27) | TTCCTACTGCCACCCAGCAC | ACCCGGATGACCTTCCTCAG | CTGTACTCAGCTCTACCG | NM001032876, AF449278 |
| Chemokine (C-C motif) ligand 28 (CCL28) | CATACTTCATGTCAAGCGCAGAA | GCTGCTTGCACTTTCATCCA | AATCTGTGTTAGCCCGCAC | NM001032877, AF449279 |
| Chemokine (C-X-C motif) ligand 11 (CXCL11) | ATGAGTGTGAAGGGCATGGC | CCTATGCAAAGACAGCGTCCT | AGCCTTAGCTATGATATTGTGT | NM001032950, AY044447 |
| Chemokine (C-X-C motif) ligand 12 (CXCL12) | CTCGTGCTGACCACGCTCT | GCTTTCGAAGAATCGGCATG | CCTCAGCGACGGGAA | NM001032934, AF449283, Chen Lab |
| Eotaxin (EOTAXIN) | GAGGCTGCAGAGCTACACAAGA | AGACCTCCTTGCCCCATTTG | ACCAACACCCAGTGTC | NM001032851, AF449269 |
| Early T lymphocyte activation 1 (Eta-1) | CCGCAGACCTGACATCCAGT | GCACCATTCAACTCCTCGCT | CCCTGATGCTACAGACGAGGACATCACC | Chen Lab |
| Fractalkine (FRA) | AGGCAGCTGGACCCCTAAAG | TAAGGACGCCCAGCCTCTG | AGGAACCCATCCATG | AY206690, M001032881, Chen Lab |
| γ-Tubulin complex component 2 (GCP2) | CTGACAGAGCTGCGTTGCAC | CTGGAGCACTGCGGACCTAC | TGTTTACACTTTACGCCGAGAG | Chen Lab |
| Interferon-γ–inducible protein-10 (IP-10) | GAGGGAAACAAAGTGCTGCC | TCCATGTAGGGAAGTGATGGG | AGAATGGACCACACAGAGGCTGCCTC | NM001032892, AY044446 |
| Liver and activation-regulated chemokine (LARC) | CTGGCCAATGAAACCTGTGA | TTGGATTTGCGCACACAGAT | TCAATGCTGTCGTCTTT | NM001032854, AF449274, Chen Lab |
| Monocyte chemotactic protein 1 (MCP1) | TGCAGAGGTTGGCG | AATGGTCTTGAAGA | AGAAGAATCACCAGCAGCAAGTGTCCCA | AY206692, AF276081 |
| Monocyte chemotactic protein 2 (MCP2) | TCAGCCAGATTCAGTTTCCATTC | CTCTGCAGCCTCTGGATAGGA | AATCACCTGCTGCTTTA | AY20669, NM001032851, AF449269 |
| Monocyte chemotactic protein 3 (MCP3) | AGCTACAGAAGGATCACCAGCAG | GGGTCAGCACAGATCTCCTTG | ACTGTCCCCGGGAAG | AY206694 |
| Monocyte chemotactic protein 4 (MCP4) | GTGTCCCCAGAAGGCTGTCA | TTCTGGACCCACTTCTCCTTTG | CTTCAGAACCAAACTGG | Chen Lab |
| Macrophage-derived chemokine (MDC) | TGACAGACTTAGATATACAATATACTTACCTTGG | TCTTCTGTATAGGTCCCCAATTGTT | TTTGTCAGCACATGCAAGAAATGCTTCA | Chen Lab |
| Macrophage inflammatory protein 1α (MIP-1α) | GAGCCTGAGCCTTGGGAAC | TGGGCAACAACCAGTCCAT | TCCCTGTGACCTCCACAGCTACCTCTTC | Chen Lab |
| Macrophage inflammatory protein 1β (MIP-1β) | TTTGAAACGAGCAGCGAGTG | ACTTGTCGCCCCTTCTTGG | TCCAAGCCGGGTGTCATCTTCCTC | Chen Lab |
| Macrophage inflammatory protein 3β (MIP-3β) | TGCTGAAGACTGCTGCCTGT | GCAGCCATCCTTGATGAGAAG | TGACCCAGAAACCCA | NM001032959, AF449273 |
| Pulmonary and activation-regulated chemokine (PARC) | GACAGATTCCACAAAAGTTTATAGTTGACT | TGAGGAGGATGACACCTGGTT | TTCTGAAACCAGCCCCCA | NM001032853, AF449272, Chen Lab |
| Regulated on activation, normally T cell–expressed and–secreted (RANTES) | ACCAGTGGCAAGTGCTCCA | GGCACACACTTGGCGATTCT | CCAGCAGTCGTCTTTGTCACCCGA | NM001032850, AF449268 |
| Thymus and activation-regulated chemokine (TARC) | TTCCCCTTAGAAAGCTGAAGAC | GTCCGAACAGATGGCCTTGT | TACCAGACATCCGAGGAC | NM001032852, AF449271, Chen Lab |
| Thymus-expressed chemokine (TECK) | GTGTGTGGGAACCCCAAGAA | AAAATCTTATTGCGAGCATCCAG | AGGTGCAGAGAGCC | NM001032875, AF449277, Chen Lab |
| Chemokine (C-C motif) receptor 1 (CCR1) | GGAAGTGACGGAGGTGATCG | CCGGCGAAGGCGTAAAT | CAACATGCACTGCTGTGTCAACCCAGT | NM001032858, AF017282, Chen Lab |
| Chemokine (C-C motif) receptor 2 (CCR2) | ATGGGCATCTGCTACTCAGG | CCCTGTGCCTCTTCTTCTCG | CCTGAAAACCCTGCTTCGGTGTGAGA | NM001032806, AF013958, Chen Lab |
| Chemokine (C-C motif) receptor 3 (CCR3) | CGCTCTCCCTCTGCTCGTT | GGCACCTCAGCAGCGT | TGGCCATCTGCTACACAGGAATCATCA | AF405536, AY065646, Chen Lab |
| Chemokine (C-C motif) receptor 4 (CCR4) | CCATCCAGGCCACAGAAACT | TCTCCCCCAGAAAAAAGTAGATGA | TGGCTTTTGTTCACTGCTGCCTTAATCC | Chen Lab |
| Chemokine (C-C motif) receptor 5 (CCR5) | GCCATGCAGGTGACAGAGACT | CCGACGAAGGCATAGATGATG | TGGGATGACACACTGCTGCATCAACC | AF161959, AF161958 |
| Chemokine (C-C motif) receptor 6 (CCR6) | CAGGCAGTTCTCCA | TCCCCAGGAGGCCA | TGTACCGATCGCCTACTCCTTGATCTGTG | NM001032935, AF508730, Chen Lab |
| Chemokine (C-C motif) receptor 7 (CCR7) | GCTTCTTCAGCGGCATGC | CCTGGACGATGGCCACAT | CCTACTTCTTTGCATCAGCATTGACCGC | NM001032884, AF508731 |
| Chemokine (C-C motif) receptor 8 (CCR8) | TAAGGTCCCGCTGCCTTG | TTCTCTGGATAAGTTCTCCATCACAG | CAACAATGACCGACTACTACTACCCTGATAGCCTCT | AF100205 |
| Chemokine (C-C motif) receptor 9 (CCR9) | CAAGCCCTGTTCCTAACATGG | AGTCAGTGAAGTTGAAGTTAACGTAGTCTT | TGATGACTATGGCTCTGAATCCACCTCTTCC | Chen Lab |
| Chemokine (C-C motif) receptor 10 (CCR10) | CTCCTCTAGATTCGCAGCCCTA | GCCTTTCTTCCTGCTCAGCTC | CCAGGAGAGACTGTGGGTCTCCGTG | Chen Lab |
| Chemokine (C-C motif) receptor 11 (CCR11) | CTGAATTTGGCTGTGGCAGA | CCCACCCATGAACTGCATTAA | TTACTCCTTCTATTCACTCTGCCTTTTTGGGC | Chen Lab |
| Chemokine (C-X3-C motif) receptor 1 (CX3CR1) | TGATTGGCAGATCCAGAGGTT | GGGAACGGATCCATGGTG | CCTTGGCAGTCCACGCCAGGC | Chen Lab |
| Chemokine (C-X-C motif) receptor 3 (CXCR3) | GGGCTACATGCACTGCTGC | CCGCTCCCGGAACTTGA | TCAACCCGCTGCTCTATGCCTTTGTAGG | Chen Lab |
| Chemokine (C-X-C motif) receptor 4 (CXCR4) | TTCCCTTCTGGGCA | ATGGACTGCCTTGC | CCGTGGCAAACTGGTACTTTGGGAACT | MMU93311, AF291672 |
| Chemokine (C-X-C motif) receptor 5 (CXCR5) | TCCTGGGCCTGGCCA | AACTTCACGCCGGCAAAA | TGCTGCCTCAACCCCATGCTCTACA | Chen Lab |
| Chemokine (C-X-C motif) receptor 6 (CXCR6) | ACCTCTGCTGGTGTTCATCAGA | TTGAAACTGTTGAGGAACCCATC | CAAACACCATGGCAGAGTATGATCACTATGAAGA | AF291671, AF124380 |
| Chemokine receptor 1 (XCR1) | AGGTACCACGTGAGTTCGGAAT | TCCATCCTCGACGCCGT | ATCACAGCCTGAAGAAAGCACCTTGTGG | Chen Lab |
| Angiopoietin (ANGPT) | GCCATTACCAGTCAGAGGCAGT | TTCCTGCTGTCCCAGTGTGA | CATGCTAAGAATTGAGTTAAT | Chen Lab |
| Fibroblast growth factor 18 (FGF18) | GCTCTACAGCCGGACCAGTG | GAATTCCGTCTCCTTGCCCT | AAACACATCCAGGTCCT | Chen Lab |
| Fibroblast growth factor 2 (FGF2) | GGCTGTACTGCAAAAACGGG | CGGTTAGCACACACTCCTTTGA | TTCTTCCTGCGCATTC | Chen Lab |
| Insulin-like growth factor I (IGF1) | AGATGCACACCATGTCCTCCT | CTGCTGGAGCCATACCCTGT | CATCTCTTCTACCTGGCACT | Chen Lab |
| Transforming growth factor α (TGFα) | GCAGCAGTGGTGTCCCATTT | GGAGGTCCGCATGCTCAC | ACTGCCCAGATTCCCACA | Chen Lab |
| Transforming growth factor β1 (TGFβ1) | TGTCATAGATTTCGTTGTGGGTTT | GTACAACAGCACCCGCGAC | ACCATTAGCACGCGGGTGACCTCC | Chen Lab |
| Vascular endothelial growth factor (VEGF) | ACTGCCATCCAATCGAGACC | TTGGACTCCTCAGTGGGCAC | TGGTGGACATCTTCCAGG | S82167 |
| C-MAF | CAAGTCGACCACCT | TTCTCCTTGTACGC | TTCTCCTTGTACGC | Chen Lab |
| Glutamyl-tRNA amidotransferase 3 (GATA-3) | CCTCATTAAGCCCAAGCGAAG | TGGTGGTCTGACAGTTCGCA | TGCAGCCAGGAGAGCAGGGACG | Chen Lab |
| Toll-like receptor 4 (PU.1) | CCTGAGGCATTTAGGCAGCTA | TTGTCTGGATTTCACACCTGGA | AGCTTCCTCCGTTTTCCAGAACTGCAG | AY864734 |
| Single cysteine motif-1 (SCM1) | AATTTTTATTACCAAACGTGGCCT | TCCATGCTCTTGACCACGTC | AAAGTCTGTGCTGATCC | NM001032947, AF449285, Chen Lab |
| T-box transcription factor (T-bet) | GCAGTGTGGAAAGGCCGA | ATGAAACTTCCTGGCGCATC | AGGAAACCGCCTGTACGTCCACCC | Chen Lab |
| B7-1 | GTGCTGGCTTGTCTTTCTCATTT | CAGCGTTGCCACTTCTTTCA | TGTTCAGGTGTTATCCACGTGACCAAG | AF344849 |
| B7-2 | CTCTCTGGTGCTGCTCCCC | AGCTCACTCAGGCTTCGGTTT | CAGACCTGCCATGCCAGTTTGCAA | AF344857, AF344851 |
| CD28 | TACTCCCAGCAGCTTCAGGTTT | ATGTCACTGATTCATTGCCCAA | CTCAAAGACGGGATTCAACTGTGATGG | AF344855, AF344852 |
| Cytotoxic T lymphocyte–associated protein 4 (CTLA4) | GCCATGGCTTGCCTTGG | GGTCCTGGTAGCCAGGTTGA | TTTCAGCGGCACAAGGCTCGG | AF344854, AF344846 |
| Inducible T cell costimulator (ICOS) | ACACAGCCAAAAAATCTAGACTCACA | GGCCAACGTTGTTCATGC | ATGTGACCGTATAATCTGGAACTCTGGCAT | Chen Lab |
| Inducible T cell costimulator ligand (ICOSL) | ACCATGCGCTGGGCAGT | CTGAGTATCGGCTCGAAGGC | CTGGACTGCTCCTCCTGCTCTTCAGC | Chen Lab |
| Cathepsin G (CTSG) | CCCCTCAGGTTACCTAGCAGC | AGCCGGCACACTGCACA | AGGTCCAGGTGAAGCCAGGGCAA | Chen Lab |
| Granzyme A (GZMA) | GAAAGAGTTTCCCTATCCATGCTATG | AATTTTTGCTTTTTCTGTTAGCTGTAAA | CCCAGCCACACACGAAGGTGATCTT | Chen Lab |
| Granzyme B (GZMB) | CGGTGGCTTCCTGATACGA | AGGTGACATTTATGGAGCTTCCC | AGGACTTCGTGCTGACAGCTGCTCACT | Chen Lab |
| Granzyme K (GZMK) | GCCCACTGCCAATATCCGT | ATTCTTTGAGAGAGAGTGTGCTCCTA | TCCAAAGGCCAGTCTCCCACTGTGGTT | Chen Lab |
| Granzyme M (GZMM) | TGTTGGTAGGCAGTTCCTTTGA | TCTGCAGCGAGGCCATG | CGGGAGGTCATCCCCCACTCG | Chen Lab |
| Matrix metallopeptidase 9 (MMP-9) | CTGACCGCCGGTTTGG | CGTCAGCATTGCCGTCC | TTCTGTCCCAGCGAGAGACTCTACACCC | Chen Lab |
| Ubiquitin-specific protease (UBP43) | CATGGCACAGTCGAGGCA | GACCAGATCACTGATGTGCACTTG | ATCAAGGAGTCCTTCACCCGGATCATATACA | Chen Lab |
| T cell immunoglobulin mucin 1 (TIM1) | TTCACCTCAGCCAGCAGAAA | AGCTGGTGGGTTGTGTCCTT | CCACCCTATGACACTGCTGGGAGCAA | Chen Lab |
| T cell immunoglobulin mucin 3 (TIM3) | AATGAATGATGAAAAACATAACCTGAA | CTGCAGAGTTGGTGCAGGG | TTGGTCGTCATCAAACCAGCCAAGGT | Chen Lab |
| Endothelial monocyte–activating polypeptide 2 (EMAP2) | TCCCGTCTGGATCTTCGAAT | GCATCTGTTCAAGAGGAACATGAT | TTGCATCATAACTGCCAGAA | Chen Lab |
| Granulysin (GNLY) | CCGGAGAAACTGCCCAGAA | GGGCTCAGAGGGAACCCATA | ATCTGTGTGGACCTCAGGTTGTGTGAACC | Chen Lab |
| Intercellular adhesion molecule 1 (ICAM-1) | CTCACCGTGTACTGGACTCCAG | TAAGGTTCTTGCCCACCGG | ACTGGCACCCCTTCCCCCTTGG | AF340040 |
| Programmed cell death protein 1 (PD1) | TCCTTGGCCACTGGTGTTC | CTTCTCCTGAGGGAAGGAGC | AGACCCTCCACCATGAGCCCAG | Chen Lab |
| Secretory leukocyte peptidase inhibitor (SLPI) | TTAGATATGAGAAACCTGAGTGCCA | TCAGGACAACATCTCTTCTTCCC | AGTGACTGGCAGTGTC | Chen Lab, DP000043 |
| Eosinophil chemotactic cytokine (ECF-L) | TGGGAGCCCTTCTCAAGACA | GGCCTCCTGCTCAAAAGCTT | CATCTCTTCACTGTCCTGG | Chen Lab |
| Endothelin 1 (EDN1) | ACTGGGAAGCCCTAGGTCCA | TTGGCTAGCACATTGGCATC | ACGAGCCTTGGAGAAT | MFU20579, Chen Lab |
| Fas ligand (FasL) | CCTGAGAAAAAGGAGCAGAGGA | CCAGAGGCATGGACCTTGAG | AGTGGCCCATTTAACAGGCAAGCCC | AF344856, NM000639 |
| Interferon-stimulated protein, 15 kDa (ISG15) | GTGCCGCGTCCCACA | TGACACCGACATGGAGTTGC | CCACAGCCATGAGCTGGGACCTG | Chen Lab |
| Myeloid progenitor inhibitory factor 1 (MPIF1) | GGCCCAGGTCACAAATGATG | TGGGATGTAGGAGGTGCAGC | AGAGACAGGGTTCATGATG | NM001032946, AF449276 |
| Programmed cell death ligand 1 (PDL1) | CCATACAGCTGAATTGGTCATCC | CTCCCAGAATTACCAAGTGAGTCC | AGAACTACCTCTGGCGCTTCCTCCAAA | Chen Lab |
| Programmed cell death ligand 2 (PDL2) | TGGCCAAACATCAGCGT | TGGTGACCTGGTAGAGGCCT | CACCAGCCACTCCAGGACCCCTG | Chen Lab |
| Perforin 1 (PRF1) | CCGCTTCTACAGTTACCATGTGG | AGCCCGGATGAAGTGGGT | ACACACTCCCCCGCTG | Chen Lab |
| Signal transducer and activator of transcription 1 (STAT1) | CAGAACGGAGGCGAACCTTA | GTCAGGGAAAGTAACAGCAGAAAGT | TCCATGCGGTTGAACCCTACACGA | AF230106, Chen Lab |
| Signal transducer and activator of transcription 6 (STAT6) | CCTGGTCACAGTTCAACAAGGA | CATCAAACCACTGCCAAAAGG | ATCCTGCTGGGCCGTGGCTTC | Chen Lab |
| Toll-like receptor 2 (TLR2) | GCTCCTGTGAATTCCTGTCCTT | TGGCCAATCAACCAGGACTT | CTCAGGAGCAGCAAGCACTGGCC | AY045573, Chen Lab |
Sequences of 98 immune genes (those for which Chen Lab [University of Illinois at Chicago] is listed as the sequence source) were obtained by cloning and sequencing using the polymerase chain reaction–based cloning method; sequences of the other genes were available in GenBank (accession nos. are indicated). Primers were designed on the basis of the sequences obtained by Chen Lab (see Materials and Methods) or those sequences reported as accession nos. in PubMed. The Chen Lab macaque gene sequences have been submitted to GenBank.
Validation of the large-scale real-time quantitation system
The large-scale real-time quantitation system was validated for the extent of variation and reproducibility, as described elsewhere [26]. The coefficient variations for intraassays and interassays for 30 immune genes were both <28% (data not shown). More importantly, in vivo experiments were conducted to validate this large-scale real-time quantitation system. The assay system was used to test variation over time for each of the 138 genes in PBMCs from 4 normal, uninfected rhesus macaques. To this aim, 4 macaques were inoculated intravenously with 5 mL of saline (presumably causing no changes in gene expression in PBMCs); PBMCs were collected at week 0 (right before the inoculation) and at week 2 and were then assessed for changes in expression levels of the 138 immune genes. There was no significant change in expression values for individual genes over time after saline administration in these macaques, because the mean values for each gene at week 2 were close to those at week 0 (table 3, control data). These data therefore suggested that the large-scale real-time quantitation system could be used to measure potential changes in the expression of the 138 immune genes after BCG vaccination/infection.
Table 3.
Expression levels of 78 genes constituting multiple immune gene networks that were striking up-regulated by bacille Calmette-Guérin (BCG) vaccination/infection.
| Gene | Gene ratio for BCG |
Gene ratio for control |
||
|---|---|---|---|---|
| Mean ± SD | P | Mean ± SD | P | |
| IL-1α | 4.1 ± 6.5 | .490 | 0.3 ± 0.1 | .055 |
| IL-1β | 16.4 ± 26.5 | .097 | 1.9 ± 1.4 | .527 |
| IL-2 | UD | UD | UD | UD |
| IL-3 | 113.9 ± 107.0 | .028a | 1.0 ± 0.1 | .714 |
| IL-4 | 4.3 ± 5.9 | .178 | 1.5 ± 2.7 | .827 |
| IL-5 | 1.1 ± 1.6 | .171 | 1.6 ± 2.1 | .680 |
| IL-6 | 3.0 ± 3.3 | .413 | 1.4 ± 1.1 | .734 |
| IL-7 | 2.5 ± 4.7 | .185 | 1.0 ± 0.1 | .721 |
| IL-8 | 65.1 ± 66.2 | .040a | 1.0 ± 0.1 | .268 |
| IL-9 | UD | UD | UD | UD |
| IL-10 | 0.4 ± 0.4 | .134 | 1.6 ± 1.4 | .565 |
| IL-12α | 1.2 ± 1.6 | .178 | 1.0 ± 0.1 | .631 |
| IL-12β | 1.5 ± 1.6 | .197 | 2.7 ± 2.5 | .282 |
| IL-13 | 1.4 ± 1.7 | .209 | 0.3 ± 0.2 | .166 |
| IL-15 | 10.0 ± 9.5 | .029a | 1.1 ± 0.1 | .153 |
| IL-16 | 25.9 ± 22.7 | .004b | 2.3 ± 1.0 | .141 |
| IL-17 | 1.5 ± 1.5 | .216 | 1.0 ± 0.0 | .177 |
| IL-18 | 235.6 ± 335.7 | .037a | 1.0 ± 0.1 | .293 |
| IL-19 | UD | UD | UD | UD |
| IL-20 | 27.1 ± 30.2 | .001b | 1.1 ± 0.1 | .239 |
| IL-21 | 4.3 ± 5.4 | .456 | 1.1 ± 0.1 | .268 |
| IL-22 | 115.1 ± 114.8 | .005b | 2.5 ± 3.6 | .930 |
| IL-23α | 11.4 ± 7.0 | .002b | 0.9 ± 0.5 | .648 |
| IL-27 | 8.2 ± 10.8 | .027a | UD | UD |
| IFN-α | 96.3 ± 94.6 | .001b | 0.9 ± 0.2 | .790 |
| IFN-β | 66.0 ± 67.5 | .000b | UD | UD |
| IFN-γ | 38.4 ± 37.7 | .000b | 1.8 ± 0.8 | .280 |
| MIF | 20.5 ± 23.0 | .006b | 0.9 ± 0.1 | .100 |
| TNF-α | 8.1 ± 5.1 | .030a | 1.8 ± 2.2 | .568 |
| IL-1R1 | 12.9 ± 18.7 | .123 | 0.9 ± 0.4 | .544 |
| IL-1R2 | 1.8 ± 1.8 | .323 | UD | UD |
| IL-2Rα | 8.5 ± 6.9 | .129 | 0.9 ± 0.1 | .146 |
| IL-2Rβ | 34.1 ± 29.3 | .001b | 2.3 ± 2.0 | .139 |
| IL-2Rγ | 39.7 ± 55.6 | .070 | 1.0 ± 0.2 | .631 |
| IL-3Rα | 44.7 ± 44.9 | .001b | UD | UD |
| IL-4R | 16.8 ± 21.4 | .158 | 1.0 ± 0.1 | .593 |
| IL-5Rα | 1.4 ± 1.5 | .202 | 1.0 ± 0.2 | .478 |
| IL-6R | 247.5 ± 168.5 | .008b | 2.1 ± 1.6 | .342 |
| IL-7R | 25.6 ± 49.3 | .481 | 1.1 ± 0.2 | .805 |
| IL-8Rα | 73.0 ± 82.1 | .000b | UD | UD |
| IL-9R | 1.4 ± 1.4 | .238 | 1.4 ± 1.2 | .459 |
| IL-10Rα | 9.0 ± 12.5 | .124 | 0.5 ± 0.3 | .148 |
| IL-10Rβ | 5.0 ± 7.1 | .291 | 1.1 ± 0.1 | .147 |
| IL-11Rα | 40.5 ± 43.0 | .001b | 1.3 ± 1.0 | .982 |
| IL-12Rβ1 | 4.0 ± 2.8 | .179 | 1.8 ± 1.1 | .172 |
| IL-12Rβ2 | 2.8 ± 1.9 | .427 | 1.0 ± 0.1 | .897 |
| IL-13Rα1 | 119.6 ± 182.0 | .003b | 1.0 ± 0.1 | .683 |
| IL-15Rα | 3.0 ± 3.0 | .249 | 2.6 ± 2.6 | .135 |
| IL-17R | 19.5 ± 19.6 | .247 | 1.3 ± 0.4 | .503 |
| IL-18R1 | 134.0 ± 110.4 | .002b | 1.0 ± 0.0 | .977 |
| IL-21R | 5.6 ± 8.4 | .266 | 1.0 ± 0.1 | .682 |
| IFN-γR | 76.7 ± 75.8 | .001b | 3.2 ± 3.5 | .392 |
| TNFR | 18.5 ± 27.5 | .005b | UD | UD |
| CCL27 | 9.7 ± 10.1 | .004b | 1.5 ± 1.7 | .910 |
| CCL28 | 87.5 ± 133.4 | .003b | 1.8 ± 2.5 | .833 |
| CXCL11 | 1.6 ± 2.1 | .179 | 1.0 ± 0.0 | .956 |
| CXCL12 | 1.2 ± 1.5 | .181 | 1.0 ± 0.1 | .364 |
| EOTAXIN | UD | UD | 1.0 ± 0.1 | .787 |
| Eta-1 | 1.1 ± 1.2 | .178 | 1.0 ± 0.1 | .374 |
| FRA | 28.1 ± 41.8 | .001b | 1.0 ± 0.0 | .110 |
| GCP2 | 107.0 ± 155.1 | .002b | 1.2 ± 0.6 | .936 |
| IP-10 | 26.0 ± 22.3 | .430 | 2.7 ± 3.5 | .882 |
| LARC | 1.2 ± 1.5 | .149 | 1.0 ± 0.1 | .253 |
| MCP1 | 18.0 ± 7.4 | .003b | UD | UD |
| MCP2 | 21.9 ± 29.3 | .007b | 1.0 ± 0.1 | .566 |
| MCP3 | 2.1 ± 1.7 | .279 | 1.0 ± 0.1 | .475 |
| MCP4 | 1.7 ± 1.8 | .208 | 1.0 ± 0.1 | .241 |
| MDC | 15.3 ± 20.8 | .017b | UD | UD |
| MIP-1α | 3.4 ± 0.8 | .010b | 0.9 ± 0.1 | .183 |
| MIP-1β | 62.7 ± 49.0 | .123 | 1.0 ± 0.0 | .725 |
| MIP-3β | 1.2 ± 1.6 | .183 | 1.0 ± 0.1 | .307 |
| PARC | 10.8 ± 14.8 | .092 | 1.7 ± 2.1 | .807 |
| RANTES | 3.4 ± 0.8 | .010a | 1.0 ± 0.1 | .871 |
| TARC | 1.4 ± 1.6 | .216 | 1.0 ± 0.1 | .422 |
| TECK | 17.7 ± 23.5 | .001b | 1.7 ± 1.7 | .795 |
| CCR1 | 12.0 ± 5.5 | .000b | 1.4 ± 0.5 | .682 |
| CCR2 | 21.9 ± 20.6 | .003b | 1.7 ± 1.2 | .779 |
| CCR3 | 9.8 ± 4.3 | .001b | 1.9 ± 3.0 | .922 |
| CCR4 | 51.8 ± 51.7 | .141 | 1.1 ± 0.1 | .434 |
| CCR5 | 263.2 ± 459.1 | .019a | 2.8 ± 3.5 | .668 |
| CCR6 | 51.4 ± 89.6 | .008b | UD | UD |
| CCR7 | 5.7 ± 6.7 | .006b | 2.6 ± 2.4 | .082 |
| CCR8 | 37.7 ± 37.4 | .000b | 1.2 ± 1.4 | .939 |
| CCR9 | 49.4 ± 49.0 | .001b | 1.5 ± 2.0 | .926 |
| CCR10 | 45.2 ± 38.2 | .000b | UD | UD |
| CCR11 | 18.7 ± 29.6 | .002b | 3.8 ± 4.7 | .671 |
| CX3CR1 | 54.4 ± 47.3 | .000b | UD | UD |
| CXCR3 | 5.3 ± 4.5 | .022a | 1.3 ± 1.3 | .893 |
| CXCR4 | 10.1 ± 5.9 | .002b | 1.0 ± 0.2 | .276 |
| CXCR5 | 4.4 ± 6.2 | .336 | 1.7 ± 1.4 | .432 |
| CXCR6 | 17.5 ± 13.8 | .010a | 3.2 ± 2.3 | .136 |
| XCR1 | 26.5 ± 32.0 | .000b | 3.1 ± 4.6 | .945 |
| ANGPT | UD | UD | 1.0 ± 0.0 | .436 |
| FGF18 | 3.0 ± 3.6 | .311 | 0.9 ± 1.5 | .554 |
| FGF2 | UD | UD | 1.4 ± 1.3 | .873 |
| IGF1 | 1.5 ± 2.2 | .198 | 3.0 ± 4.8 | .842 |
| TGFα | 1.4 ± 1.5 | .211 | 2.7 ± 3.9 | .428 |
| TGFβ1 | 2.4 ± 2.4 | .329 | 3.5 ± 2.6 | .154 |
| VEGF | 90.8 ± 128.7 | .001b | 1.1 ± 0.1 | .225 |
| C-MAF | 127.6 ± 214.5 | .000b | UD | UD |
| GATA-3 | 16.8 ± 21.4 | .158 | UD | UD |
| PU.1 | 73.9 ± 70.6 | .010a | 1.7 ± 1.7 | .451 |
| SCM1 | 14.2 ± 11.2 | .001b | 0.7 ± 0.9 | .991 |
| T-bet | 14.9 ± 14.6 | .007b | 1.8 ± 1.4 | .855 |
| B7-1 | 11.5 ± 21.9 | .144 | 1.0 ± 0.1 | .494 |
| B7-2 | 272.8 ± 522.8 | .038a | 2.8 ± 3.1 | .735 |
| CD28 | 603.9 ± 945.1 | .003b | 0.7 ± 0.4 | .411 |
| CTLA4 | 12.2 ± 8.3 | .004b | 0.8 ± 0.7 | .602 |
| ICOS | 23.8 ± 35.3 | .093 | 1.0 ± 0.0 | .196 |
| ICOSL | 5.5 ± 6.5 | .177 | 0.7 ± 0.4 | .150 |
| CTSG | 9.4 ± 9.8 | .001b | 2.5 ± 2.9 | .412 |
| GZMA | 260.7 ± 306.5 | .021a | 2.3 ± 2.1 | .269 |
| GZMB | 30.0 ± 28.8 | .000b | UD | UD |
| GZMK | 104.0 ± 83.0 | .000b | 1.8 ± 1.0 | .292 |
| GZMM | 41.3 ± 45.0 | .001b | 0.9 ± 0.7 | .628 |
| MMP-9 | 22.2 ± 24.0 | .008b | 0.9 ± 0.5 | .366 |
| UBP43 | 9.3 ± 10.7 | .026a | 1.0 ± 0.1 | .497 |
| TIM1 | 5.1 ± 4.0 | .002b | 1.4 ± 1.7 | .815 |
| TIM3 | 3.1 ± 1.7 | .264 | 0.5 ± 0.2 | .060 |
| EMAP2 | 10.5 ± 16.4 | .175 | 2.6 ± 3.1 | .428 |
| GNLY | 15.3 ± 27.9 | .165 | 0.9 ± 0.1 | .191 |
| ICAM-1 | 17.7 ± 24.3 | .020a | 1.0 ± 0.1 | .842 |
| PD1 | 39.4 ± 47.3 | .025a | 1.7 ± 1.8 | .976 |
| SLPI | 45.2 ± 56.6 | .000b | 1.1 ± 0.0 | .105 |
| ECF-L | 3.0 ± 3.6 | .311 | UD | UD |
| EDN1 | 11.5 ± 11.4 | .031a | 1.0 ± 0.0 | .753 |
| FasL | 4.6 ± 6.4 | .483 | 0.5 ± 0.2 | .043 |
| ISG15 | 54.4 ± 31.8 | .019a | 1.0 ± 0.0 | .793 |
| MPIF1 | 1.3 ± 1.5 | .198 | 1.4 ± 2.1 | .411 |
| PDL1 | 15.4 ± 16.9 | .059 | UD | UD |
| PDL2 | 52.9 ± 39.0 | .031a | 2.0 ± 2.6 | .858 |
| PRF1 | 43.9 ± 62.8 | .000b | 2.7 ± 2.3 | .413 |
| STAT1 | 164.2 ± 133.7 | .000b | 1.0 ± 0.1 | .388 |
| STAT6 | 28.9 ± 48.0 | .141 | 1.0 ± 0.1 | .519 |
| TLR2 | 33.9 ± 29.2 | .008b | 1.0 ± 0.1 | .668 |
NOTE. Peripheral-blood lymphocytes (PBLs) were collected from 4 rhesus monkeys before (week 0) and after (week 5) BCG vaccination/infection and assessed for global gene expression by a large-scale real-time quantitation system. Earlier studies had shown peak T cell responses and anti-BCG immunity occurring 5 weeks after intravenous BCG inoculation [14–16]. BCG data show the means of fold changes in expression levels for week 5 vs. week 0 in PBLs from the 4 BCG-vaccinated monkeys. P values for IL-1, IL-2, IL-4, IL-5, IL-6, and IL-9 were >.05 at this 5-week time point but were <.05 in the longitudinal analysis (table 4). As validation, the control data show the means of fold changes in expression levels for week 2 vs. week 0 in PBLs from 4 normal, uninfected rhesus macaques that received saline. UD, undetectable.
P < .05.
P < .01.
Measurement of mycobacterial burdens
Quantitation of mycobacterial infection was accomplished by measuring bacterial colony counts and levels of mycobacterial Ag85B mRNA expression [15]. Viable BCG mycobacterial colony counts in the blood were determined on the basis of the quantitation of mycobacterial colony-forming units in cell lysates from blood cells from BCG-vaccinated macaques. Five-fold dilutions of the lysate were plated in duplicate on Middlebrook 7H10 agar plates (Diffico) [15]. Colony-forming units were counted after a 3-week incubation at 37°C.
Enzyme-linked immunospot (ELISpot) assay for measuring antigen-specific T cells
To measure the numbers and interferon (IFN)–γ–production capacity of mycobacteria-specific T cells, peripheral-blood lymphocytes (PBLs) were assessed for their specific recognition of purified protein derivative (PPD) antigens by ELISpot assay, as described elsewhere [16, 24]. Data were expressed as numbers of PPD-specific IFN-γ–producing T cells per 1 × 10⁶ PBMCs.
Statistical analysis
As described elsewhere [23], Student’s t test and nonparametric test were used to examine whether any differences in the numbers of PPD-specific T cells or in the levels of individual gene transcripts identified after BCG vaccination/infection were statistically significant.
RESULTS
Selective up-regulation of many immune genes or gene networks 5 weeks after BCG vaccination/infection
Our previous studies showed that vaccine-elicited T cell responses and coincident clearance of BCG bacteria were most striking 4–8 weeks after intravenous BCG inoculation in macaques [14–16, 24]. We presumed that investigation of gene expression at these time points would allow us to optimally identify gene networks connected to the peak immune response and anti-BCG immunity. Thus, PBL samples were collected from 4 macaques at week 5 after intravenous BCG inoculation and assessed for the expression of 138 immune genes. Systemic BCG infection was generated on the basis of the consideration that blood lymphocytes, but not lung cells, could be prospectively collected from individual macaques and readily measured for transcriptional immune responses. Many immune genes in blood lymphocytes were selectively up-regulated 5 weeks after BCG vaccination/infection of macaques (table 3). Of 138 immune genes, 93 were apparently up-regulated. Of the up-regulated genes, the mean expression of 14 was increased >100-fold in circulating lymphocytes. The mean expression of 14 genes was increased 51–100-fold, that of 41 was increased 16–50-fold, and that of 24 was increased 5–15-fold. For 78 of these up-regulated genes, statistically significant differences existed relative to baseline levels (see the P values in table 3; see also table 4).
Table 4.
Longitudinal analysis of bacille Calmette-Guérin (BCG)–induced immune gene networks.
| Network, gene | W1:W0 ratio | W2:W0 ratio | W3:W0 ratio | W4:W0 ratio | W6:W0 ratio | W19:W0 ratio | ||||||
|---|---|---|---|---|---|---|---|---|---|---|---|---|
| Mean ± SD | P | Mean ± SD | P | Mean ± SD | P | Mean ± SD | P | Mean ± SD | P | Mean ± SD | P | |
| Network (i) | ||||||||||||
| IL-1α | 53.7 ± 25.5 | .049a | 9.1 ± 11.3 | .085 | 8.8 ± 15.1 | .154 | 12.4 ± 12.6 | .052 | 17.3 ± 28.6 | .140 | 0.5 ± 0.5 | .418 |
| IL-1β | 21.9 ± 1.1 | .001b | 4.4 ± 5.2 | .197 | 0.9 ± 0.6 | .137 | 9.9 ± 15.3 | .167 | 62.5 ± 62.1 | .049a | 1.0 ± 1.0 | .086 |
| IL-2 | 33.2 ± 13.9 | .041a | 8.7 ± 7.8 | .062 | 26.9 ± 24.4 | .042a | 26.2 ± 24.1 | .044a | 2.2 ± 1.4 | .285 | 1.1 ± 0.8 | .229 |
| IL-3 | 55.6 ± 18.1 | .025a | 34.1 ± 25.5 | .020a | 24.0 ± 17.4 | .019a | 26.9 ± 11.1 | .002b | 19.3 ± 16.0 | .031a | 2.0 ± 2.8 | .320 |
| IL-4 | 31.9 ± 1.3 | .005b | 3.5 ± 2.8 | .171 | 15.0 ± 26.2 | .172 | 3.5 ± 2.9 | .174 | 1.5 ± 1.7 | .482 | 0.2 ± 0.2 | .459 |
| IL-5 | 47.6 ± 10.0 | .011a | 1.9 ± 0.6 | .020a | 1.1 ± 1.1 | .497 | 3.9 ± 6.1 | .192 | 14.6 ± 25.5 | .165 | 2.9 ± 2.6 | .212 |
| IL-6 | 16.7 ± 3.5 | .011a | 17.1 ± 13.3 | .030a | 13.4 ± 20.5 | .148 | 29.7 ± 27.6 | .044a | 4.1 ± 4.3 | .172 | 4.9 ± 6.0 | .336 |
| IL-7 | 9.0 ± 8.9 | .189 | 2.9 ± 2.5 | .164 | 1.1 ± 0.8 | .333 | 11.0 ± 18.5 | .171 | 5.1 ± 8.7 | .212 | 3.2 ± 4.3 | .270 |
| IL-8 | 24.5 ± 7.0 | .021a | 44.6 ± 39.5 | .035a | 14.7 ± 17.9 | .089 | 52.9 ± 44.3 | .029a | 6.8 ± 9.0 | .125 | 1.7 ± 1.5 | .306 |
| IL-9 | 10.6 ± 13.2 | .190 | 4.3 ± 1.9 | .034a | 3.3 ± 2.2 | .087 | 5.6 ± 0.6 | .006b | 2.3 ± 1.3 | .158 | UD | UD |
| IL-15 | 15.1 ± 3.2 | .012a | 6.3 ± 5.7 | .060 | 7.1 ± 10.3 | .144 | 11.2 ± 13.8 | .097 | 2.1 ± 0.7 | .021a | 3.1 ± 4.4 | .302 |
| IL-16 | 8.2 ± 9.5 | .229 | 8.9 ± 4.3 | .013a | 6.2 ± 6.4 | .137 | 3.4 ± 2.0 | .171 | 14.5 ± 16.1 | .090 | 1.6 ± 1.3 | .180 |
| IL-18 | 65.9 ± 3.1 | .001b | 39.9 ± 34.4 | .032a | 81.4 ± 44.5 | .006b | 108.2 ± 52.5 | .003b | 46.5 ± 23.7 | .004b | 3.0 ± 4.0 | .278 |
| IL-19 | UD | UD | UD | UD | UD | UD | UD | UD | UD | UD | UD | UD |
| IL-22 | 36.7 ± 0.8 | .006b | 58.3 ± 47.0 | .028a | 22.7 ± 15.0 | .020a | 23.3 ± 4.9 | .000b | 10.0 ± 11.3 | .127 | 4.6 ± 6.6 | .257 |
| IL-23α | 9.7 ± 9.3 | .159 | 5.5 ± 2.7 | .008b | 3.0 ± 2.2 | .050 | 4.8 ± 2.0 | .004b | 1.7 ± 0.8 | .076 | 1.0 ± 1.4 | .409 |
| IFN-α | 51.6 ± 12.6 | .015a | 49.1 ± 42.7 | .032a | 21.0 ± 18.3 | .035a | 33.1 ± 25.5 | .023a | 8.8 ± 10.7 | .096 | 1.1 ± 1.6 | .425 |
| IFN-β | 50.5 ± 23.1 | .047a | 36.7 ± 21.9 | .010a | 12.3 ± 16.1 | .091 | 12.5 ± 5.0 | .003b | 3.1 ± 4.1 | .169 | UD | UD |
| IFN-γ | 20.4 ± 24.5 | .197 | 18.8 ± 15.7 | .036a | 9.1 ± 7.4 | .049a | 54.6 ± 51.6 | .043a | 9.8 ± 8.4 | .051 | 5.9 ± 6.6 | .240 |
| TNF-α | 5.7 ± 4.2 | .123 | 3.3 ± 2.5 | .211 | 3.5 ± 2.6 | .188 | 18.7 ± 21.4 | .084 | 1.4 ± 1.2 | .363 | 4.9 ± 6.9 | .369 |
| IL-2Rα | 13.4 ± 14.8 | .176 | 9.7 ± 12.8 | .110 | 16.6 ± 15.7 | .046a | 45.6 ± 40.5 | .035a | 17.4 ± 18.8 | .065 | 1.8 ± 1.0 | .177 |
| IL-2Rβ | 23.9 ± 10.6 | .047a | 12.6 ± 10.1 | .047a | 29.3 ± 19.6 | .017a | 24.3 ± 19.1 | .031a | 28.3 ± 24.9 | .042a | 5.6 ± 7.3 | .364 |
| IL-2Rγ | 20.1 ± 6.3 | .025a | 32.7 ± 29.8 | .039a | 28.3 ± 18.9 | .014a | 31.3 ± 16.2 | .005b | 17.1 ± 9.1 | .006b | 1.6 ± 1.0 | .259 |
| IL-3Rα | 25.8 ± 8.6 | .037a | 12.5 ± 8.1 | .028a | 13.6 ± 8.5 | .024a | 17.0 ± 7.2 | .004b | 9.6 ± 12.5 | .160 | 0.4 ± 0.6 | .140 |
| IL-4R | 18.5 ± 14.1 | .111 | 21.1 ± 20.3 | .048a | 23.9 ± 12.5 | .005b | 35.9 ± 25.1 | .016a | 15.0 ± 18.5 | .092 | 1.8 ± 2.5 | .358 |
| IL-6R | 58.4 ± 10.1 | .008b | 33.1 ± 30.0 | .042a | 44.8 ± 16.5 | .001b | 89.0 ± 61.0 | .015a | 48.4 ± 24.5 | .005b | 1.3 ± 1.8 | .215 |
| IL-8Rα | 78.8 ± 89.0 | .171 | 41.2 ± 28.6 | .016a | 50.7 ± 50.1 | .047a | 22.0 ± 8.4 | .001b | 23.5 ± 22.0 | .044a | 0.7 ± 1.0 | .386 |
| IL-11Rα | 33.3 ± 25.8 | .112 | 20.7 ± 8.1 | .002b | 20.9 ± 15.5 | .023a | 10.9 ± 1.5 | .000b | 19.7 ± 15.9 | .030a | 9.1 ± 12.8 | .235 |
| IL-13Rα1 | 102.0 ± 13.7 | .005b | 34.8 ± 27.5 | .025a | 23.3 ± 21.2 | .040a | 65.2 ± 58.7 | .036a | 25.3 ± 10.7 | .002b | 1.1 ± 1.5 | .494 |
| IL-17R | 15.7 ± 14.2 | .141 | 12.9 ± 9.2 | .023a | 8.3 ± 4.3 | .009b | 21.6 ± 17.4 | .029a | 9.2 ± 3.6 | .002b | 4.7 ± 6.6 | .284 |
| IL-18R1 | 47.5 ± 16.0 | .027a | 23.4 ± 19.9 | .033a | 32.7 ± 12.9 | .001b | 54.4 ± 38.8 | .017a | 25.6 ± 12.7 | .004b | 1.0 ± 0.9 | .480 |
| IFN-γR | 32.9 ± 8.6 | .017a | 17.7 ± 13.6 | .043a | 15.4 ± 3.5 | .001b | 34.3 ± 25.5 | .026a | 9.0 ± 4.5 | .044a | 0.3 ± 0.4 | .095 |
| TNFR | 16.2 ± 3.6 | .013a | 10.7 ± 14.4 | .112 | 10.9 ± 9.6 | .043a | 18.0 ± 10.7 | .009b | 8.3 ± 10.5 | .106 | 0.3 ± 0.5 | .242 |
| Network (ii) | ||||||||||||
| CCL27 | 19.7 ± 5.2 | .024a | 5.6 ± 3.0 | .025a | 2.9 ± 1.4 | .126 | 22.5 ± 30.6 | .110 | 2.0 ± 0.9 | .315 | 4.3 ± 6.0 | .262 |
| CCL28 | 58.3 ± 18.1 | .026a | 26.2 ± 29.0 | .072 | 11.4 ± 9.0 | .044a | 14.9 ± 4.9 | .002b | 4.1 ± 4.0 | .193 | 6.8 ± 9.7 | .236 |
| GCP2 | 32.9 ± 9.2 | .019a | 59.8 ± 54.8 | .038a | 23.5 ± 22.2 | .045a | 27.9 ± 11.8 | .002b | 8.0 ± 8.2 | .074 | 4.9 ± 6.9 | .288 |
| IP-10 | 33.0 ± 4.4 | .013a | 22.0 ± 26.5 | .099 | 7.1 ± 5.9 | .119 | 22.5 ± 19.6 | .047a | 7.9 ± 3.1 | .033a | 7.0 ± 9.9 | .254 |
| MCP1 | 20.6 ± 5.4 | .018a | 22.6 ± 14.5 | .013a | 9.0 ± 10.7 | .094 | 16.5 ± 20.6 | .091 | 6.9 ± 7.9 | .094 | 0.9 ± 0.8 | .454 |
| MCP2 | 15.6 ± 15.2 | .154 | 35.4 ± 33.0 | .041a | 4.9 ± 1.4 | .001b | 20.9 ± 19.2 | .042a | 6.1 ± 6.9 | .096 | 2.2 ± 2.6 | .291 |
| MDC | 25.6 ± 8.5 | .027a | 23.1 ± 20.5 | .037a | 4.5 ± 3.6 | .050 | 16.1 ± 11.9 | .022a | 3.3 ± 4.8 | .176 | 6.0 ± 8.5 | .246 |
| MIP-1β | 19.1 ± 18.6 | .151 | 15.3 ± 17.7 | .079 | 17.1 ± 19.0 | .070 | 22.1 ± 17.1 | .024a | 7.0 ± 5.9 | .044a | 0.6 ± 0.8 | .270 |
| CCR4 | 24.4 ± 18.9 | .111 | 33.5 ± 21.6 | .012a | 14.2 ± 7.4 | .006b | 16.4 ± 9.3 | .008b | 9.7 ± 7.5 | .031a | 3.6 ± 5.1 | .279 |
| CCR5 | 37.8 ± 11.6 | .032a | 42.5 ± 38.3 | .042a | 27.4 ± 23.7 | .043a | 36.4 ± 32.6 | .043a | 15.1 ± 7.3 | .011a | 1.4 ± 2.0 | .494 |
| CCR8 | 23.6 ± 0.8 | .002b | 23.6 ± 10.9 | .003b | 15.9 ± 13.9 | .040a | 16.9 ± 15.6 | .046a | 6.2 ± 9.6 | .171 | 4.3 ± 6.1 | .248 |
| CCR9 | 43.1 ± 16.0 | .036a | 19.5 ± 17.1 | .041a | 6.6 ± 5.1 | .058 | 22.3 ± 21.1 | .049a | 9.2 ± 7.6 | .049a | 1.1 ± 1.5 | .387 |
| CCR10 | 34.0 ± 13.4 | .039a | 19.0 ± 12.3 | .014a | 16.4 ± 10.1 | .013a | 14.6 ± 4.6 | .001b | 5.7 ± 6.4 | .112 | 4.5 ± 6.3 | .244 |
| CCR11 | 99.4 ± 3.4 | .002b | 24.1 ± 31.4 | .124 | 5.8 ± 5.5 | .295 | 10.8 ± 12.4 | .165 | 1.7 ± 1.9 | .223 | 2.9 ± 4.1 | .411 |
| CXCR4 | 12.2 ± 10.1 | .126 | 9.2 ± 2.3 | .000b | 6.3 ± 3.5 | .011a | 6.5 ± 2.8 | .003b | 2.7 ± 1.3 | .015a | 2.5 ± 1.3 | .141 |
| CXCR6 | 13.0 ± 7.8 | .138 | 17.8 ± 13.3 | .037a | 15.4 ± 6.8 | .007b | 16.1 ± 12.8 | .047a | 8.1 ± 8.5 | .155 | 3.9 ± 5.5 | .360 |
| XCR1 | 54.0 ± 6.9 | .009b | 12.5 ± 13.2 | .113 | 3.4 ± 2.8 | .461 | 8.8 ± 9.9 | .167 | 1.0 ± 0.5 | .194 | 3.7 ± 5.3 | .286 |
| MIF | 14.4 ± 13.2 | .144 | 12.3 ± 8.7 | .019a | 8.3 ± 4.0 | .005b | 9.2 ± 7.2 | .031a | 4.0 ± 1.6 | .004b | 1.9 ± 2.7 | .315 |
| ISG15 | 0.7 ± 0.5 | .263 | 4.0 ± 5.5 | .157 | 5.3 ± 2.0 | .003b | 5.1 ± 2.4 | .008b | 2.0 ± 2.4 | .209 | 1.0 ± 1.3 | .496 |
| Network (iii) | ||||||||||||
| B7-2 | 48.8 ± 18.3 | .039a | 51.1 ± 44.1 | .036a | 38.1 ± 17.7 | .004b | 25.5 ± 18.7 | .027a | 17.6 ± 20.5 | .102 | 8.9 ± 12.6 | .249 |
| CD28 | 79.2 ± 26.0 | .026a | 75.3 ± 30.5 | .001b | 91.7 ± 48.5 | .005b | 90.9 ± 69.6 | .021a | 39.3 ± 8.9 | .000b | 7.3 ± 10.2 | .229 |
| CTLA4 | 18.1 ± 21.6 | .191 | 7.8 ± 5.4 | .020a | 5.2 ± 3.1 | .015a | 5.3 ± 3.1 | .015a | 2.2 ± 0.6 | .014a | 2.2 ± 3.2 | .260 |
| ICOS | 10.7 ± 14.2 | .218 | 13.5 ± 8.5 | .013a | 33.9 ± 31.8 | .042a | 19.1 ± 15.2 | .027a | 8.3 ± 9.2 | .080 | 2.7 ± 3.8 | .295 |
| PDL1 | 5.4 ± 2.0 | .186 | 6.7 ± 4.1 | .031a | 51.5 ± 73.4 | .111 | 14.4 ± 8.3 | .012a | 3.8 ± 4.1 | .175 | 0.3 ± 0.3 | .377 |
| PDL2 | 42.0 ± 18.1 | .048a | 33.0 ± 31.6 | .049a | 13.9 ± 11.1 | .041a | 37.7 ± 33.9 | .040a | 7.1 ± 8.4 | .147 | 7.3 ± 10.2 | .239 |
| PD1 | 35.0 ± 39.8 | .175 | 15.7 ± 23.1 | .126 | 11.8 ± 8.2 | .019a | 12.4 ± 10.9 | .040a | 13.1 ± 18.6 | .121 | 3.0 ± 4.2 | .293 |
| Network (iv) | ||||||||||||
| C-MAF | 47.3 ± 21.1 | .045a | 28.8 ± 34.0 | .077 | 15.5 ± 17.6 | .075 | 20.4 ± 21.4 | .060 | 8.4 ± 7.6 | .049a | 1.2 ± 1.7 | .441 |
| PU.1 | 49.0 ± 20.2 | .038a | 31.8 ± 23.6 | .022a | 34.4 ± 19.4 | .008b | 47.9 ± 29.3 | .010a | 27.6 ± 24.4 | .039a | 2.3 ± 2.2 | .329 |
| SCM1 | 52.4 ± 17.4 | .027a | 13.8 ± 15.0 | .066 | 3.5 ± 2.7 | .048a | 5.9 ± 4.7 | .036a | 1.2 ± 1.0 | .250 | 1.8 ± 2.6 | .243 |
| T-bet | 13.1 ± 11.9 | .139 | 6.7 ± 5.5 | .068 | 2.8 ± 1.6 | .205 | 3.5 ± 2.3 | .125 | 1.8 ± 0.6 | .458 | 1.4 ± 0.5 | .066 |
| GATA-3 | 3.7 ± 2.6 | .233 | 3.4 ± 3.9 | .148 | 7.6 ± 10.3 | .110 | 4.7 ± 5.6 | .119 | 4.3 ± 4.9 | .118 | UD | UD |
| STAT1 | 46.1 ± 17.1 | .032a | 85.7 ± 46.1 | .005b | 75.7 ± 50.7 | .013a | 74.2 ± 37.8 | .004b | 21.4 ± 7.9 | .001b | 7.2 ± 10.1 | .239 |
| STAT6 | 12.6 ± 3.1 | .017a | 20.1 ± 16.9 | .032a | 29.5 ± 19.6 | .014a | 65.1 ± 59.7 | .038a | 22.0 ± 17.7 | .028a | 0.5 ± 0.6 | .169 |
| FoxP3 | 4.4 ± 4.0 | .391 | 2.5 ± 1.0 | .465 | 2.0 ± 0.4 | .362 | 1.7 ± 0.5 | .302 | 1.1 ± 0.1 | .209 | UD | UD |
| Network (v) | ||||||||||||
| IFN-γ | 20.4 ± 24.5 | .197 | 18.8 ± 15.7 | .036a | 9.1 ± 7.4 | .049a | 54.6 ± 51.6 | .043a | 9.8 ± 8.4 | .051 | 5.9 ± 6.6 | .240 |
| T-bet | 13.1 ± 11.9 | .139 | 6.7 ± 5.5 | .068 | 2.8 ± 1.6 | .205 | 3.5 ± 2.3 | .125 | 1.8 ± 0.6 | .458 | 1.4 ± 0.5 | .066 |
| TIM1 | 37.0 ± 14.4 | .039a | 17.6 ± 13.6 | .027a | 10.1 ± 10.7 | .073 | 20.3 ± 12.6 | .014a | 0.5 ± 0.2 | .267 | UD | UD |
| TIM3 | 26.3 ± 11.5 | .043a | 5.4 ± 2.2 | .003b | 16.6 ± 22.0 | .083 | 10.5 ± 5.7 | .008b | 2.5 ± 0.6 | .002b | UD | UD |
| IP-10 | 33.0 ± 4.4 | .013a | 22.0 ± 26.5 | .099 | 7.1 ± 5.9 | .119 | 22.5 ± 19.6 | .047a | 7.9 ± 3.1 | .033a | 7.0 ± 9.9 | .254 |
| Network (vi) | ||||||||||||
| GZMA | 70.1 ± 25.1 | .032a | 96.5 ± 92.7 | .044a | 29.0 ± 20.5 | .021a | 117.6 ± 114.5 | .045a | 8.0 ± 7.2 | .091 | 3.6 ± 3.6 | .271 |
| GZMK | 15.7 ± 15.7 | .174 | 40.0 ± 28.9 | .019a | 79.1 ± 26.5 | .001b | 149.9 ± 45.7 | .000b | 50.1 ± 42.5 | .032a | 5.0 ± 7.1 | .280 |
| Network (vii) | ||||||||||||
| TLR2 | 44.9 ± 7.3 | .007b | 16.1 ± 18.6 | .077 | 8.9 ± 4.6 | .007b | 7.8 ± 5.1 | .019a | 12.7 ± 9.1 | .021a | 3.1 ± 4.4 | .284 |
| VEGF | UD | UD | 19.8 ± 0.2 | .000b | 19.2 ± 2.6 | .000b | 15.3 ± 0.7 | .000b | 8.2 ± 3.2 | .003b | 4.9 ± 7.0 | .255 |
| MMP-9 | 12.3 ± 11.3 | .140 | 12.3 ± 10.7 | .039a | 9.1 ± 7.8 | .040a | 10.9 ± 9.6 | .042a | 1.6 ± 0.4 | .038a | 6.3 ± 8.9 | .256 |
| UBP43 | 5.6 ± 1.3 | .019a | 7.8 ± 8.3 | .076 | 4.4 ± 6.5 | .170 | 15.0 ± 20.1 | .107 | 3.2 ± 3.0 | .099 | 2.0 ± 2.0 | .285 |
| ICAM-1 | 16.0 ± 11.1 | .098 | 9.5 ± 5.9 | .014a | 7.7 ± 8.2 | .076 | 10.1 ± 7.5 | .027a | 6.8 ± 5.1 | .033a | 4.3 ± 5.9 | .261 |
| CTSG | 6.2 ± 5.0 | .327 | 58.1 ± 55.0 | .045a | 62.8 ± 61.0 | .048a | 37.0 ± 30.8 | .033a | 30.1 ± 27.8 | .048a | 8.9 ± 9.8 | .192 |
| EDN1 | 47.4 ± 20.3 | .042a | 14.7 ± 8.4 | .008b | 5.1 ± 3.2 | .021a | 8.8 ± 3.6 | .002b | 4.3 ± 4.9 | .116 | 3.5 ± 4.9 | .273 |
| SLPI | 40.4 ± 7.5 | .009a | 17.7 ± 19.1 | .066 | 5.4 ± 6.3 | .111 | 12.9 ± 10.2 | .030a | 2.4 ± 2.0 | .110 | 2.2 ± 3.1 | .329 |
NOTE. BCG-induced gene networks were detectable at 1 week after BCG vaccination/infection and were stable over time. Seventy-four genes identified in the initial experiment were longitudinally measured for their expression in peripheral-blood lymphocytes collected from an additional 4 rhesus macaques after intravenous vaccination/infection. Data were calculated as for those in table 3, except that postvaccination expression levels are for multiple time points and that no quantitation was done for genes that were not apparently up-regulated 5 weeks after BCG vaccination (table 3). UD, undetectable; W, week.
P < .05.
P < .01.
These 78 up-regulated immune genes could be grouped into at least the following gene networks, which are linked to many aspects of immune function: (i) a gene network of lymphokines and lymphokine receptors for immune activation/adaptive T cell responses—IL-3, IL-8, IL-15, IL-16, IL-18, IL-22, IL-23α, IL-27, IFN-α, IFN-β, IFN-γ, TNF-α, IL-2Rα, IL-2Rβ, IL-2Rγ, IL-3α, IL-4R, IL-6R, IL-8Rα, IL-11Rα, IL-13Rα, IL-17R, IL-18R1, IFN-γR, and TNFR (see table 4 for changes in IL-1α, IL-1β, IL-2, IL-4, IL-5, IL-6, and IL-9); (ii) a gene network of chemokines and chemokine receptors for mucosal/tissue migration and T cell activation [27, 28]—CCL27, CCL28, GCP2 (CCL6), IP-10, MCP1, MCP2, MDC, MIP-1β, CCR4, CCR5, CCR8, CCR9, CCR10, CCR11, CXCR4, CXCR6, and XCR1; (iii) a gene network of signal costimulators for vaccine-elicited T cell responses [29, 30]—B7-2, CD28, CTLA4, ICOS, PD1, PDL1, and PDL2; (iv) a gene network of transcription and trans-activation—C-MAF, PU.1, SCM1, T-bet, STAT1, and STAT6; (v) a gene network of T helper commitments—IFN-γ, T-bet, IP-10, TIM1, and TIM3; (vi) a gene network of cytotoxic effectors—GZMA, GZMB, and GZMK; and (vii) a gene network of innate and other immune factors—TLR2, VEGF, MMP-9, UBP43, ICAM-1, CTSG, EDN1, SLPI, etc. It should be pointed out that up-regulated genes in each presumed gene network would have other potential or speculated functions. Thus, these results demonstrate that many immune genes that constitute complex gene networks were selectively up-regulated at 5 weeks after BCG vaccination/infection.
Detectability at 1 week and stability at ≥6 weeks of BCG-induced gene networks after BCG vaccination/infection
Because BCG-induced gene networks composed of 78 genes were identified 5 weeks after BCG inoculation, we sought to determine whether these gene networks emerged early and stabilized over time after BCG vaccination/infection. We analyzed the expression kinetics of these up-regulated genes in an additional 4 monkeys weekly or biweekly after BCG vaccination/infection. Interestingly, systemic BCG vaccination/infection induced early and relatively stable up-regulation patterns of these selected immune genes after BCG vaccination/infection (table 4). All of these genes except ISG15 and GATA-3 exhibited up to 160-fold up-regulation 1 week after BCG vaccination/infection (table 4). These genes were remarkably up-regulated at multiple-week time points after BCG vaccination/infection (table 4). Some of these immune genes underwent short-term increases in expression in circulating lymphocytes (table 4). For example, the genes for major T cell–proliferating lymphokines, IL-2 and IL-15, were up-regulated 2–4 weeks and were back to baseline level 6 weeks after BCG vaccination/infection. The BCG-induced immune genes and gene networks returned to baseline at week 19 after BCG vaccination/infection. Importantly, a number of selected lymphokine receptors and chemokine receptors were apparently up-regulated at week 1 and were sustained through ≥6 weeks after the systemic BCG vaccination (table 4), suggesting that these immune receptors serve as transcriptional platforms for vaccine-elicited immune responses. These results, therefore, provide evidence that BCG vaccination/infection induces early and prolonged up-regulation of selected immune genes or gene networks in circulating lymphocytes.
Establishment of early activation of immune gene networks as an immune correlate of anti-BCG immunity and correlation between prolonged gene network up-regulation and the development of T cell responses
The sequential events for up-regulated gene networks, cellular immune responses, and anti-mycobacterial immunity after vaccination or infection have not been well described, although global immune activation after vaccination/infection is generally believed to drive cellular responses and immunity. To explore whether and when the early and sustained up-regulation of gene networks after BCG vaccination could be linked to the development of T cell immune responses and anti-BCG immunity, we sought to examine the correlation between up-regulated gene networks and antigen-specific cellular responses as well as between the gene networks and immune clearance of BCG bacteria in the blood after BCG vaccination/infection. We first calculated the means of fold changes in the expression of selected genes in each of the gene networks and then plotted these values over the levels of PPD-specific IFN-γ–producing T cells or BCG colony-forming units (BCG bacteremia) at each time point after BCG vaccination/infection (figure 1). The up-regulation of these gene networks occurred earlier than did PPD-specific T cell responses after BCG vaccination/infection (figure 1). One week after BCG vaccination/infection, most immune genes in the networks were up-regulated, whereas PPD-specific IFN-γ–producing T cells were detectable only 2–3 weeks after the BCG inoculation (figure 1). However, prolonged up-regulation of these genes or gene networks clearly coincided with the sustained development of PPD-specific T cell responses after BCG vaccination/infection (figure 1). Such prolonged up-regulation of immune gene networks was also associated with major expansions of CD4 T cell, CD8 T cell, and Vγ2Vδ2 T cell populations (data not shown and [16]). Interestingly, although BCG bacteremia was the driving force of the up-regulation of genes, early up-regulation of gene networks occurred coincidently with the clearance of BCG bacteremia (figure 1). Previous studies have demonstrated that the clearance of BCG bacteremia is related to the immune response, because suppression of antigen-specific T cells during simian immunodeficiency virus infection results in prolonged BCG bacteremia or persistent BCG coinfection [14]. The present findings, therefore, elucidate the in vivo event sequences for immune gene networks, an immune correlate for anti-BCG immunity, and the development of vaccine-elicited T cell responses after BCG vaccination.
Figure 1.
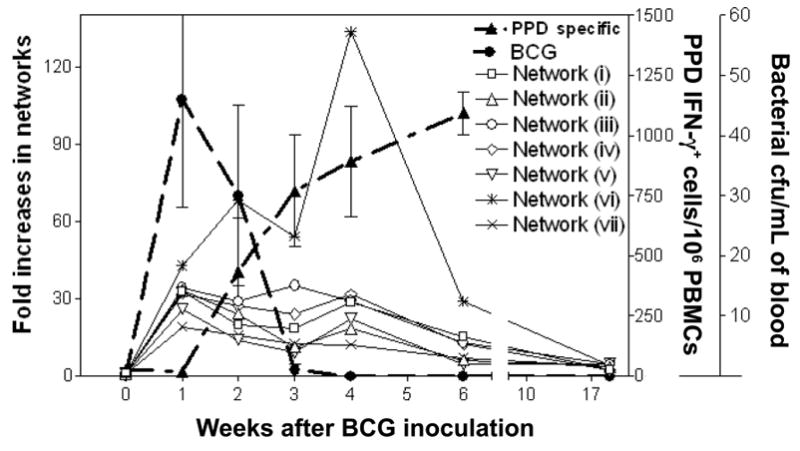
Gene networks, immune response, and bacteremia. Early and prolonged up-regulation of immune gene networks correlated with the development of vaccine-elicited T cell responses and anti–bacille Calmette-Guérin (BCG) immunity after BCG vaccination. The mean levels of expression of individual gene networks were plotted over the levels of purified protein derivative (PPD)–specific interferon (IFN)–γ–producing T cells and BCG colony-forming units at each time point after BCG vaccination/infection. The mean expression levels of individual gene networks were calculated as the means of fold changes in the expression of selected genes in each of the gene networks (i.e., the mean for a gene network is the total of the means of fold changes for the up-regulated genes divided by the no. of the up-regulated genes). The levels of BCG colony-forming units in simian immunodeficiency virus–infected monkeys were persistent and were higher than those in healthy naive monkeys [14]. Network (i) is the gene network of lymphokines and lymphokine receptors for immune activation/adaptive T cell responses; network (ii) is the gene network of chemokines and chemokine receptors for mucosal/tissue migration and T cell activation; network (iii) is the gene network of signal costimulators for vaccine-elicited T cell responses; network (iv) is the gene network of transcription and trans-activation; network (v) is the gene network of T helper commitments; network (vi) is the gene network of cytotoxic effectors; and network (vii) is the gene network of innate and other immune factors (see the first section of Results). PBMCs, peripheral-blood mononuclear cells.
DISCUSSION
In the present study, we conducted the first large-scale real-time quantitation of immune gene expression in the settings of vaccine-elicited T cell responses and immune clearance of live vaccine in the blood. Our real-time quantitative PCR system appears to be more sensitive than gene-microarray assays and can detect up to 100-fold increases in gene expression, whereas microarray assays usually allow a detection of <5-fold changes in host gene expression in most cases of infections [31–35]. The real-time quantitative PCR system may also be more specific than microarrays, which may be more likely to introduce potential artifacts or nonspecificity while analyzing wider gene profiles. Our extensive validation studies suggest that this system was reproducible and reliable. Importantly, although our real-time quantitation system revealed no significant changes in 138 analyzed immune gene transcripts in control macaques inoculated with saline (table 2), the system allowed us to identify up-regulated immune gene networks after BCG vaccination/infection in macaques. Such a large-scale real-time quantitation system may be useful for preclinical or clinical studies of immune gene networks for both vaccine-elicited immune responses and disease pathogenesis.
One of the interesting findings of the present study is the early and prolonged up-regulation of various immune genes or gene networks after BCG vaccination/infection. Some groups have reported that certain targeted cytokines are either undetectable or detectable for only a short time, coincident with antigenemia [36–38]. Our ability to identify prolonged up-regulation of immune gene networks after BCG vaccination/infection can certainly be attributed to the great sensitivity of real-time PCR–based quantitation, compared with that of conventional ELISA. BCG vaccination/infection induced transcriptional networks composed of a minimum of 78 up-regulated immune genes in circulating lymphocytes. Most of these up-regulated genes in the transcriptional networks can emerge early and sustain a high level of expression for ≥6 weeks after BCG vaccination/infection.
Another interesting observation is that BCG-elicited protective responses involve many genes or gene networks, rather than a few genes. The up-regulated genes or gene networks may act in concert to initiate and maintain translational events after BCG vaccination and likely represent the fundamental proteomes that mount the innate response and BCG-elicited T cell immune responses. Up-regulated TLR and the genes for certain lymphokines and chemokines or even some cell-surface receptors can act as innate immune components and contribute to the early containment of mycobacteria. Meanwhile, up-regulated immune genes can help to develop and sustain T cell responses. Although IL-2, IFN-γ, T-bet, IP-10, and TIM1 and TIM3 may facilitate the development of a Th1 response [39, 40], up-regulated IL-2 and IL-15 transcripts can encode the lymphokines that drive the clonal expansion of vaccine-elicited T cells in BCG-vaccinated monkeys. It is also likely that the networking effect of other up-regulated lymphokine genes—such as IL-3, IL-4, IL-8, IL-16, IL-18, IL-20, IL-22, IL-23, IFN-α, IFN-β, IFN-γ, and TNF-α—contributes to the clonal expansion of vaccine-elicited T cells. Correspondingly, the up-regulation of lymphokine receptors after BCG vaccination may provide the platforms supporting the development of adaptive immune responses of antigen-specific T cells after BCG vaccination/infection. Expression of these surface receptors on lymphocytes can certainly confer to these cells the ability to readily proliferate or expand in response to autocrine or exocrine lymphokines after BCG vaccination/infection. Likewise, the gene network of chemokine and chemokine receptors may play a role in facilitating adaptive immune responses as well. Some chemokines drive leukocyte migration along chemokine gradients; others may regulate dendritic cell (DC) maturation and direct encounters with and interactions between DCs, T cells, and B cells [27, 28]. Up-regulated chemokine receptors allow circulating lymphocytes to readily migrate to the tissue and mucosae for immune clearance of mycobacteria.
The up-regulated immune gene networks analyzed here may contribute to immunity against mycobacterial infection. Our data show a correlation between early up-regulated gene networks and immune clearance of BCG mycobacteria. The data also indicate that correlates of protection or clearance may not be attributed simply to 1–5 selected genes but, rather, to a set of coordinately regulated genes. Presumably, these up-regulated immune genes may represent gene networks of both innate and adaptive anti-mycobacterial immunity, because these networks are connected in time to early immune clearance of BCG bacteria and BCG-specific T cell responses. Given the capability of BCG to confer protection against fatal forms of M. tuberculosis infection and tuberculosis [1, 3, 8, 15], BCG-induced gene networks of immunity may provide standards for comparisons with other TB vaccines that are currently under development. On the other hand, these gene networks of adaptive immunity may be different from those profiles of inflammation or immune failures that occur as a result of tuberculosis or AIDS-related tuberculosis. Information from such comparative studies should enhance our understanding of vaccine development and the pathogenesis of tuberculosis.
Supplementary Material
Acknowledgments
We thank other members of the Chen Lab, for technical assistance.
Financial support: National Institutes of Health (R01 grants HL64560 and RR13601, both to Z.W.C.).
Footnotes
Potential conflicts of interest: none reported.
References
- 1.Soysal A, Millington KA, Bakir M, et al. Effect of BCG vaccination on risk of Mycobacterium tuberculosis infection in children with household tuberculosis contact: a prospective community-based study. Lancet. 2005;366:1443–51. doi: 10.1016/S0140-6736(05)67534-4. [DOI] [PubMed] [Google Scholar]
- 2.Colditz GA, Brewer TF, Berkey CS, et al. Efficacy of BCG vaccine in the prevention of tuberculosis: meta-analysis of the published literature. JAMA. 1994;271:698–702. [PubMed] [Google Scholar]
- 3.Rodrigues LC, Diwan VK, Wheeler JG. Protective effect of BCG against tuberculous meningitis and miliary tuberculosis: a meta-analysis. Int J Epidemiol. 1993;22:1154–8. doi: 10.1093/ije/22.6.1154. [DOI] [PubMed] [Google Scholar]
- 4.Moore ZS, Seward JF, Lane JM. Smallpox. Lancet. 2006;367:425–35. doi: 10.1016/S0140-6736(06)68143-9. [DOI] [PubMed] [Google Scholar]
- 5.Barba-Spaeth G, Longman RS, Albert ML, Rice CM. Live attenuated yellow fever 17D infects human DCs and allows for presentation of endogenous and recombinant T cell epitopes. J Exp Med. 2005;202:1179–84. doi: 10.1084/jem.20051352. [DOI] [PMC free article] [PubMed] [Google Scholar]
- 6.Eichner M, Dietz K. Eradication of poliomyelitis: when can one be sure that polio virus transmission has been terminated? Am J Epidemiol. 1996;143:816–22. doi: 10.1093/oxfordjournals.aje.a008820. [DOI] [PubMed] [Google Scholar]
- 7.Dye C, Scheele S, Dolin P, Pathania V, Raviglione MC. Consensus statement. Global burden of tuberculosis: estimated incidence, prevalence, and mortality by country. WHO Global Surveillance and Monitoring Project. JAMA. 1999;282:677–86. doi: 10.1001/jama.282.7.677. [DOI] [PubMed] [Google Scholar]
- 8.Colditz GA, Berkey CS, Mosteller F, et al. The efficacy of bacillus Calmette-Guerin vaccination of newborns and infants in the prevention of tuberculosis: meta-analyses of the published literature. Pediatrics. 1995;96:29–35. [PubMed] [Google Scholar]
- 9.Fine PE. BCG: the challenge continues. Scand J Infect Dis. 2001;33:243–5. doi: 10.1080/003655401300077144. [DOI] [PubMed] [Google Scholar]
- 10.Orme IM. Tuberculosis vaccines: current progress. Drugs. 2005;65:2437–44. doi: 10.2165/00003495-200565170-00002. [DOI] [PubMed] [Google Scholar]
- 11.Young D, Dye C. The development and impact of tuberculosis vaccines. Cell. 2006;124:683–7. doi: 10.1016/j.cell.2006.02.013. [DOI] [PubMed] [Google Scholar]
- 12.Tree JA, Elmore MJ, Javed S, Williams A, Marsh PD. Development of a guinea pig immune response-related microarray and its use to define the host response following Mycobacterium bovis BCG vaccination. Infect Immun. 2006;74:1436–41. doi: 10.1128/IAI.74.2.1436-1441.2006. [DOI] [PMC free article] [PubMed] [Google Scholar]
- 13.Mollenkopf HJ, Hahnke K, Kaufmann SH. Transcriptional responses in mouse lungs induced by vaccination with Mycobacterium bovis BCG and infection with Mycobacterium tuberculosis. Microbes Infect. 2006;8:136–44. doi: 10.1016/j.micinf.2005.06.015. [DOI] [PubMed] [Google Scholar]
- 14.Shen Y, Zhou D, Chalifoux L, et al. Induction of an AIDS virus-related tuberculosis-like disease in macaques: a model of simian immunodeficiency virus-mycobacterium coinfection. Infect Immun. 2002;70:869–77. doi: 10.1128/IAI.70.2.869-877.2002. [DOI] [PMC free article] [PubMed] [Google Scholar]
- 15.Shen Y, Zhou D, Qiu L, et al. Adaptive immune response of Vgamma2Vdelta2+ T cells during mycobacterial infections. Science. 2002;295:2255–8. doi: 10.1126/science.1068819. [DOI] [PMC free article] [PubMed] [Google Scholar]
- 16.Lai X, Shen Y, Zhou D, et al. Immune biology of macaque lymphocyte populations in a mycobacterial infection. Clin Exp Immunol. 2003;133:182–92. doi: 10.1046/j.1365-2249.2003.02209.x. [DOI] [PMC free article] [PubMed] [Google Scholar]
- 17.Barclay WR, Busey WM, Dalgard DW, et al. Protection of monkeys against airborne tuberculosis by aerosol vaccination with bacillus Calmette-Guerin. Am Rev Respir Dis. 1973;107:351–8. doi: 10.1164/arrd.1973.107.3.351. [DOI] [PubMed] [Google Scholar]
- 18.Good RC. Biology of the mycobacterioses. Simian tuberculosis: immunologic aspects. Ann NY Acad Sci. 1968;154:200–13. doi: 10.1111/j.1749-6632.1968.tb16710.x. [DOI] [PubMed] [Google Scholar]
- 19.Janicki BW, Good RC, Minden P, Affronti LF, Hymes WF. Immune responses in rhesus monkeys after bacillus Calmette-Guerin vaccination and aerosol challenge with Mycobacterium tuberculosis. Am Rev Respir Dis. 1973;107:359–66. doi: 10.1164/arrd.1973.107.3.359. [DOI] [PubMed] [Google Scholar]
- 20.Ribi E, Anacker RL, Barclay WR, et al. Efficacy of mycobacterial cell walls as a vaccine against airborne tuberculosis in the rheusus monkey. J Infect Dis. 1971;123:527–38. doi: 10.1093/infdis/123.5.527. [DOI] [PubMed] [Google Scholar]
- 21.Chen ZW, Shen L, Regan JD, Kou Z, Ghim SH, Letvin NL. The T cell receptor gene usage by simian immunodeficiency virus gag-specific cytotoxic T lymphocytes in rhesus monkeys. J Immunol. 1996;156:1469–75. [PubMed] [Google Scholar]
- 22.Shen Y, Shen L, Sehgal P, et al. Antiretroviral agents restore Mycobacterium-specific T-cell immune responses and facilitate controlling a fatal tuberculosis-like disease in macaques coinfected with simian immunodeficiency virus and Mycobacterium bovis BCG. J Virol. 2001;75:8690–6. doi: 10.1128/JVI.75.18.8690-8696.2001. [DOI] [PMC free article] [PubMed] [Google Scholar]
- 23.Zhou D, Lai X, Shen Y, et al. Inhibition of adaptive Vgamma2Vdelta2+ T-cell responses during active mycobacterial coinfection of simian immunodeficiency virus SIVmac-infected monkeys. J Virol. 2003;77:2998–3006. doi: 10.1128/JVI.77.5.2998-3006.2003. [DOI] [PMC free article] [PubMed] [Google Scholar]
- 24.Shen L, Shen Y, Huang D, et al. Development of Vγ2Vδ2+ T cell responses during active mycobacterial coinfection of simian immunodeficiency virus–infected macaques requires control of viral infection and immune competence of CD4+ T cells. J Infect Dis. 2004;190:1438–47. doi: 10.1086/423939. [DOI] [PMC free article] [PubMed] [Google Scholar]
- 25.Shen Y, Shen L, Sehgal P, et al. Clinical latency and reactivation of AIDS-related mycobacterial infections. J Virol. 2004;78:14023–32. doi: 10.1128/JVI.78.24.14023-14032.2004. [DOI] [PMC free article] [PubMed] [Google Scholar]
- 26.Du G, Qiu L, Shen L, et al. Combined megaplex TCR isolation and SMART-based real-time quantitation methods for quantitating antigen-specific T cell clones in mycobacterial infection. J Immunol Methods. 2006;308:19–35. doi: 10.1016/j.jim.2005.09.009. [DOI] [PMC free article] [PubMed] [Google Scholar]
- 27.Molon B, Gri G, Bettella M, et al. T cell costimulation by chemokine receptors. Nat Immunol. 2005;6:465–71. doi: 10.1038/ni1191. [DOI] [PubMed] [Google Scholar]
- 28.Bachmann MF, Kopf M, Marsland BJ. Chemokines: more than just road signs. Nat Rev Immunol. 2006;6:159–64. doi: 10.1038/nri1776. [DOI] [PubMed] [Google Scholar]
- 29.Carreno BM, Collins M. The B7 family of ligands and its receptors: new pathways for costimulation and inhibition of immune responses. Annu Rev Immunol. 2002;20:29–53. doi: 10.1146/annurev.immunol.20.091101.091806. [DOI] [PubMed] [Google Scholar]
- 30.Greenwald RJ, Freeman GJ, Sharpe AH. The B7 family revisited. Annu Rev Immunol. 2005;23:515–48. doi: 10.1146/annurev.immunol.23.021704.115611. [DOI] [PubMed] [Google Scholar]
- 31.George MD, Reay E, Sankaran S, Dandekar S. Early antiretroviral therapy for simian immunodeficiency virus infection leads to mucosal CD4+ T-cell restoration and enhanced gene expression regulating mucosal repair and regeneration. J Virol. 2005;79:2709–19. doi: 10.1128/JVI.79.5.2709-2719.2005. [DOI] [PMC free article] [PubMed] [Google Scholar]
- 32.Bosinger SE, Hosiawa KA, Cameron MJ, et al. Gene expression profiling of host response in models of acute HIV infection. J Immunol. 2004;173:6858–63. doi: 10.4049/jimmunol.173.11.6858. [DOI] [PubMed] [Google Scholar]
- 33.Li Q, Schacker T, Carlis J, Beilman G, Nguyen P, Haase AT. Functional genomic analysis of the response of HIV-1–infected lymphatic tissue to antiretroviral therapy. J Infect Dis. 2004;189:572–82. doi: 10.1086/381396. [DOI] [PubMed] [Google Scholar]
- 34.Baskin CR, Garcia-Sastre A, Tumpey TM, et al. Integration of clinical data, pathology, and cDNA microarrays in influenza virus-infected pigtailed macaques (Macaca nemestrina) J Virol. 2004;78:10420–32. doi: 10.1128/JVI.78.19.10420-10432.2004. [DOI] [PMC free article] [PubMed] [Google Scholar]
- 35.Sui Y, Potula R, Pinson D, et al. Microarray analysis of cytokine and chemokine genes in the brains of macaques with SHIV-encephalitis. J Med Primatol. 2003;32:229–39. doi: 10.1034/j.1600-0684.2003.00030.x. [DOI] [PubMed] [Google Scholar]
- 36.Chen ZW, Shen Y, Zhou D, et al. In vivo T-lymphocyte activation and transient reduction of viral replication in macaques infected with simian immunodeficiency virus. J Virol. 2001;75:4713–20. doi: 10.1128/JVI.75.10.4713-4720.2001. [DOI] [PMC free article] [PubMed] [Google Scholar]
- 37.Giavedoni LD, Velasquillo MC, Parodi LM, Hubbard GB, Hodara VL. Cytokine expression, natural killer cell activation, and phenotypic changes in lymphoid cells from rhesus macaques during acute infection with pathogenic simian immunodeficiency virus. J Virol. 2000;74:1648–57. doi: 10.1128/jvi.74.4.1648-1657.2000. [DOI] [PMC free article] [PubMed] [Google Scholar]
- 38.Kwofie TB, Haga T, Iida T, Hayami M, Miura T. Cytokine kinetics in the plasma of monkeys infected with pathogenic and nonpathogenic simian and human immunodeficiency chimeric viruses at an early stage of infection. Microbiol Immunol. 2001;45:399–402. doi: 10.1111/j.1348-0421.2001.tb02637.x. [DOI] [PubMed] [Google Scholar]
- 39.Way SS, Wilson CB. Cutting edge: immunity and IFN-gamma production during Listeria monocytogenes infection in the absence of T-bet. J Immunol. 2004;173:5918–22. doi: 10.4049/jimmunol.173.10.5918. [DOI] [PubMed] [Google Scholar]
- 40.Koguchi K, Anderson DE, Yang L, O’Connor KC, Kuchroo VK, Hafler DA. Dysregulated T cell expression of TIM3 in multiple sclerosis. J Exp Med. 2006;203:1413–8. doi: 10.1084/jem.20060210. [DOI] [PMC free article] [PubMed] [Google Scholar]
Associated Data
This section collects any data citations, data availability statements, or supplementary materials included in this article.