

Summary
Retinal rod and cone pigments consist of an apoprotein, opsin, covalently linked to a chromophore, 11-cis retinal. Here we demonstrate that the formation of the covalent bond between opsin and 11-cis retinal is reversible in darkness in amphibian red cones, but essentially irreversible in red rods. This dissociation, apparently a general property of cone pigments, results in a surprisingly large amount of free opsin—about 10% of total opsin—in dark-adapted red cones. We attribute this significant level of free opsin to the low concentration of intracellular free 11-cis retinal, estimated to be only a tiny fraction (~0.1 %) of the pigment content in red cones. With its constitutive transducin-stimulating activity, the free cone opsin produces an ~2-fold desensitization in red cones, equivalent to that produced by a steady light causing 500 photoisomerizations s−1. Cone pigment dissociation therefore contributes to the sensitivity difference between rods and cones.
Introduction
Rods and cones share the same principles of phototransduction (see, for example, Yau, 1994). This process begins with the activation of the visual pigment, which consists of an apoprotein (opsin) covalently attached to a chromophore (11-cis retinal). Absorption of a photon by the chromophore triggers its isomerization from the 11-cis to the all-trans state (Hubbard and Brown, 1958), leading to conformational rearrangements and activation of opsin. Through a G protein-mediated signaling pathway, this pigment activation ultimately results in the closure of cGMP-gated, nonselective cation channels on the plasma membrane of the photoreceptor outer segment and electrical hyperpolarization of the cell (see, for example, Yau, 1994; Burns and Baylor, 2001, for review). The active (meta-II) state of the pigment is terminated by phosphorylation followed by binding of a capping protein called arrestin, eventually decaying to all-trans retinal and free opsin. Free opsin shows a weak constitutive activity of triggering the phototransduction signaling pathway (Cornwall and Fain, 1994; Cornwall et al., 1995; Surya et al., 1995). All-trans retinal is enzymatically reduced to all-trans-retinol in the photoreceptor, then recycled into 11-cis retinal in the pigment epithelium. Once back in the photoreceptor, 11-cis retinal recombines spontaneously with opsin to form functional visual pigment (McBee et al., 2001). Besides sharing a common phototransduction mechanism, rods and cones employ homologous proteins in the process (for a recent review, see Pepe, 2001).
Despite their similarities, rods and cones have different response properties: cones are 25- to 100-fold less sensitive to light than rods, and their potoresponses are several-fold faster in kinetics (see, for example, Baylor, 1987, for review). One explanation for these differences, at least for amphibian red cones, is a considerably higher rate of thermal isomerization of the cone pigment in darkness (Rieke and Baylor, 2000; Kefalov et al., 2003). This spontaneous activity is equivalent to real light (Baylor et al., 1980), triggering transduction and consequently adaptation of the cell, manifested as reduced sensitivity and accelerated response kinetics. Thus, the amphibian red cone behaves to some extent like a rod that is already light adapted, even in darkness.
Another difference between rod and cone visual pigments is that, at least in solution, the covalent bond (Schiff base) between 11-cis retinal and cone opsins (but not rod opsins) can be spontaneously broken without isomerization (Matsumoto et al., 1975; Crescitelli, 1984). In other words, the covalent association between cone opsin and 11-cis retinal is reversible. While this observation has been long standing, its validity in intact cones and its physiological significance have never been examined. Because free opsin constitutively activates the phototransduction pathway, albeit weakly, we reason that its presence in any substantial amount due to pigment dissociation should trigger adaptation and reduce sensitivity. We report here experiments on salamander cones that have confirmed this idea. We find that dissociation seems to be a general property of cone pigments. The reversibility of cone pigment formation also provides a unique opportunity to estimate the concentration of free 11-cis retinal in the intact cone, an important but so far unknown parameter.
Results
Blue Shift in Absorption Spectrum of Red Cones Induced by Exogenous 9-cis Retinal
We first asked whether the formation of the covalent bond between 11-cis retinal and cone opsin is indeed reversible in intact cones. An indication of this reversibility for cone pigment in solution is the ability of exogenous chromophore to replace the native chromophore in cone pigment in darkness (Matsumoto et al., 1975). Accordingly, to check for this property in intact cells, we incubated dark-adapted salamander red cones in Ringer’s solution containing 9-cis retinal (in suspended lipid vesicles or in 0.1% ethanol, see Experimental Procedures) and examined for chromophore exchange in single red cones using microspectrophotometry. In the larval tiger salamander retina, with 11-cis 3-dehydroretinal (A2) and 11-cis retinal (A1) both present, the red cones contain a mixture of pigments: 11-cis A2 pigment with a λmax at 620 nm and 11-cis A1 pigment with a λmax at 562 nm (Hárosi, 1975; Makino and Dodd, 1996; Makino et al., 1999). Because 9-cis retinal combines with salamander red cone opsin to form a pigment with a λmax shorter than those of the 11-cis A1 and A2 pigments (Makino et al., 1999; see also later), the formation of this pigment should produce a blue shift in the absorption spectrum of the cell.
Figure 1A shows sample absorption spectra from single red cones under three conditions: (1) dark-adapted in control Ringer’s solution, (2) bleached by bright white light followed by dark incubation in Ringer’s solution containing 100 μM 9-cis retinal, and (3) dark-adapted followed by incubation for 5 hr in Ringer’s solution containing 100 μM 9-cis retinal. All three spectra in Figure 1A have been normalized to unity height at their respective λmax. The absorption spectrum of the red cone in control solution peaks at 613 ± 3 nm (mean ± SEM, n = 4). As expected, after a bleach by bright white light followed by dark incubation with 9-cis retinal, the absorption spectrum was substantially blue shifted (λmax = 531 ± 4 nm, n = 4). A comparable blue shift, however, was observed after dark incubation with 9-cis retinal without prebleaching (λmax = 526 ± 4 nm, n = 7; the difference between this value and the above value obtained after a white-light bleach and regeneration is probably not significant). Thus, there appears to be an exchange of 9-cis retinal for 11-cis retinal in the red cone pigment in darkness. The shifts in λmax in the latter two conditions were larger than expected from the λmax of 542 nm for 9-cis red cone pigment reported by Makino et al. (1999) based on electrophysiology. However, the published λmax for 9-cis red cone pigment is not hard-and-fast–two other measurements gave 500 nm (Chen et al., 1989) and 534 nm (Fukada et al., 1990), respectively, with the latter very close to ours. We have adopted our measurement of 531 nm for subsequent experiments and associated calculations (but see later).
Figure 1. Effect of 9-cis Retinal on the Absorption Spectra of Salamander Red Cones and Red Rods.

Using a microspectrophotometer, absorption spectra were taken from dark-adapted red cones (A) and red rods (B) immediately after dissection (top panels), following bleaching of the pigment and subsequent incubation with 100 μM 9-cis retinal (middle panels), and following a 5 hr dark incubation with 100 μM 9-cis retinal at room temperature (bottom panels). In all panels, the dashed line indicates the position of absorption λmax for dark-adapted red rods and red cones, respectively.
We repeated the same experiments with salamander red rods (Figure 1B). The absorption spectrum in control solution showed a λmax at 514 ± 1 nm (n = 12). A blue shift of the absorption spectrum was produced by 9-cis retinal after a bleach by bright white light, with a λmax = 481 ± 1 nm (n = 10), again similar to that found by Fukada et al. (1990) with solubilized rhodopsin. On the other hand, no shift was observed without pre-bleaching (λmax = 515 ± 0.3 nm, n = 10). Thus, red rod pigment does not dissociate in darkness, or at least does so very slowly (see also Defoe and Bok, 1983).
Blue Shift in Action Spectrum of Red Cones Induced by Exogenous 9-cis Retinal
To measure the pigment dissociation in intact cones more precisely, we monitored the spectral shift produced by 9-cis retinal (in suspended lipid vesicles or in 0.1% ethanol, as above) in individual red cones with suction-pipette recording. We measured the flash sensitivity of individual cells at two arbitrary wavelengths, 600 nm (where the difference between 11-cis and 9-cis red cone pigments is considerable) and 480 nm (near the isosbetic point, though this is not crucial; see, for example, Figure 2C). By using the ratio of sensitivities at two wavelengths, we removed any progressive change in sensitivity over time that was unrelated to chromophore exchange. First, by linearly combining the spectral templates for 11-cis A1 and A2 red cone pigments (shown normalized in Figure 2A; see Govardovskii et al., 2000; Makino et al., 1999; and Experimental Procedures) with different weighting factors, we generated a calibration curve that converts the 600 nm/480 nm sensitivity ratio (S600/S480) into an 11-cis A1/A2 pigment ratio prior to 9-cis retinal incubation (Figure 2B). The average log10(S600/S480) value from ten dark-adapted red cones was 0.54 ± 0.02 (SEM), corresponding to 48% 11-cis A1 and 52% 11-cis A2 pigments (indicated in red in Figure 2B). These values are broadly consistent with those reported in previous studies (Hárosi, 1975; Makino and Dodd, 1996).
Figure 2. Determination of Chromophore Composition in Control and 9-cis Retinal-Treated Red Cones.

(A) Spectral templates for salamander red cone pigment with 11-cis A1, 11-cis A2, and 9-cis retinal as chromophore.
(B) Calibration curve for determining the fractions of A1 and A2 chromophores in dark-adapted red cones based on their sensitivities at 600 nm and 480 nm. The spectral templates for A1 and A2 pigment were combined with different weighting factors and, for each, the predicted sensitivity ratio at 600 nm and 480 nm, log(S600/S480), was calculated (black squares; see Experimental Procedures). The solid curve is an empirical fit to the points. The average log(S600/S480) for dark-adapted red cones was 0.54, corresponding to 48% A1 and 52% A2 pigment (red circle).
(C) A composite 11-cis template was constructed consisting of 48% A1 and 52% A2 templates. This composite 11-cis template and the 9-cis template were then combined with different weighting factors and the predicted log(S600/S480) calculated (see Experimental Procedures).
(D) Calibration curve to convert log(S600/S480) into percentage of 9-cis pigment incorporated. The points are calculated from different linear combinations of the 48% 11-cis A1/52% 11-cis A2 composite template and the 9-cis template, and the curve is an empirical fit to the points. Incubation of dark-adapted red cones with 10 μM and 100 μM 9-cis retinal for 16 hr at room temperature resulted in average blue spectral shift to log(S600/S480) of 0.36 and −0.18 respectively, corresponding to 36% and 88% 9-cis pigment (red circles).
Next, by linearly combining the 48% 11-cis A1/52% 11-cis A2 composite template and the 9-cis A1 template with different weighting factors (Figure 2C), we obtained another calibration curve (Figure 2D) that converts the S600/S480 ratio in the presence of 9-cis retinal into a percentage of 9-cis pigment. The composite templates in Figure 2C show decreasing peak absorption with increasing 9-cis pigment because the quantum efficiency is lower for 9-cis pigment than for 11-cis pigment (see Experimental Procedures). To validate the calibration curve in Figure 2D (representing averaged data), we used it to calculate the level of 9-cis pigment in red cones after dark incubation with 100 μM 9-cis retinal following a bright white bleaching light, which should remove most of native 11-cis retinal from the pigment. The resulting log10(S600/S480) was −0.20 ± 0.03 (n = 9), giving 89% 9-cis pigment; the difference from 100% could be due to incomplete bleach and/or some photoregeneration during the bleach (Azuma and Azuma, 1980; Grimm et al., 2000).
With the overall strategy validated, we incubated isolated red cones in a Ringer’s solution containing 100 μM 9-cis retinal in darkness for 16 hr (room temperature) and measured the degree of spontaneous chromophore exchange. On average, log10(S600/S480) was −0.18 ± 0.03 (n = 5) at the end of the incubation, which, according to the relation in Figure 2D, corresponds to 88% chromophore exchange. Thus, given sufficient time, this exchange can potentially reach completion in darkness. Incubation of the cells with a 10-fold lower 9-cis retinal (10 μM) for the same time period produced a log10(S600/S480) of 0.36 ± 0.05 (n = 3) in red cones, corresponding to 36% 9-cis retinal incorporation into the pigment.
Time Course of Chromophore Exchange
The time course of chromophore exchange could be followed by continuously monitoring S600/S480 during exposure of an isolated red cone to 100 μM 9-cis retinal. Figure 3A shows flash intensity-response relations for the cell, measured at 600 nm and 480 nm, in control Ringer’s solution (black and red filled symbols, respectively; solid lines) and after about 3 hr of dark incubation with 100 μM 9-cis retinal (open symbols, dashed lines). Exposure to 9-cis retinal-containing solution induced a decrease in the sensitivity at 600 nm and a slight increase in the sensitivity at 480 nm, consistent with a gradual replacement of the native 11-cis retinal by 9-cis retinal in the visual pigment. Figure 3B gives the full set of measurements over time. From the calibration curve in Figure 2B, the initial, dark-adapted S600/S480 value corresponded to a 35%/65% 11-cis A1/A2 pigment ratio for this cell (note that the ratio of A1/A2 pigments varies among cells; see Makino and Dodd, 1996). With a composite spectral template constructed from these initial percentages and weighted amounts of 9-cis retinal (Figure 3C, similar in type to that in Figure 2D), the time course of S600/S480 can be converted into a percentage of 9-cis retinal incorporated over time (Figure 3D). In this cell, incubation with 100 μM 9-cis retinal for 3 hr resulted in replacement of 66% of the native chromophore. Subsequent bleaching by bright white light followed by 9-cis retinal reincubation resulted in 90% of the pigment being occupied by this chromophore (last time point in Figure 3D). A single-exponential curve fitted to this exchange time course gave a time constant of 168 min. The average time constant from five experiments was 160 ±11 min.
Figure 3. Time Course of Dark Replacement of 11-cis Retinal by 9-cis Retinal in the Pigment of Red Cones.

(A) Intensity-response relations from a dark-adapted red cone at 600 nm and 480 nm in Ringer’s solution (solid curves) and after 3 hr of incubation with 100 μM 9-cis retinal in darkness (dashed curves). The curve fits are with the Michaelis relation, r = rmax [I/(I + σ)], where σ is the half-saturating flash intensity.
(B) Time course of sensitivity change at 600 nm and 480 nm, based on the full set of data from the cell in (A). Sensitivity is given by 1/σ, where σ is the half-saturating flash intensity derived from the intensity-response curve measured at each time point.
(C) Calibration curve relating log(S600/S480) and the percentage of incorporated 9-cis retinal, computed in a way similar to that for Figure 2D but using an initial 11-cis A1/A2 pigment ratio of 35%/65% pigment [derived from the initial log(S600/S480) value for this cell].
(D) Percentage of 9-cis pigment in this cell as a function of time, obtained by reading off values from (C). The last data point was taken after bleaching with bright white light and regeneration with 9-cis retinal.
We have repeated the calculations in the experiments of Figures 2 and 3 with an absorption template of λmax = 542 nm for 9-cis red cone pigment (Makino et al., 1999). In this case, the time constant for the chromophore exchange in the experiment of Figure 3D would be 156 min instead, and the average from the five experiments would be 141 ± 15 min, not too different from the above values.
The vehicle used for delivery of the exogenous chromophore was not critical for the exchange. Thus, similar results were obtained whether 9-cis retinal was delivered in lipid vesicles or in 0.1% ethanol (data not shown). As negative controls, incubation in normal Ringer’s alone had no effect on spectral or absolute sensitivity (nine cells; data not shown).
Retinal Binding Proteins Can Remove 11-cis Retinal from Red Cone Pigment and Desensitize the Cells
The fact that the native 11-cis retinal in the pigment of dark-adapted red cones can be replaced by 9-cis retinal indicates that retinal can be released from cone pigment in darkness. To confirm that the retinal released from the pigment is in the 11-cis and not all-trans form (as would result from photic or thermal activation), we treated dark-adapted red cones with CRALBP, a retinal binding protein specific for 11-cis retinal (Saari and Bredberg, 1987). In 27 experiments, incubation with 20 or 100 μM CRALBP decreased the sensitivity of the cones and accelerated their dim-flash response kinetics (see, for example, Figures 4A and 4B). In another set of experiments, we found that the flash sensitivity of red cones decreased by 1.39 ± 0.11 log units (six cells) after incubation with 100 μM CRALBP in darkness for 24 hr (room temperature), a decrease that could be reversed by subsequent exposure with 11-cis retinal. Thus, the chromophore released from the cone pigment was 11-cis retinal, which CRALBP was able to remove in the above experiments, causing a progressive accumulation of free opsin and therefore desensitization of the cell. In effect, exposure to CRALBP in darkness converts dark-adapted cones into cones that behave as if they were bleach adapted by bright light. The level of bleaching caused by CRALBP could be estimated by comparing the CRALBP-induced desensitization with the desensitization produced in red cones by light that bleached known percentages of pigment (Figure 4C; data averaged from eight cells; post-bleach sensitivity was measured after the cell had reached steady state). In this way, a sensitivity reduction by 1.39 log units after 24 hr incubation with 100 μM CRALBP is equivalent to a 72% bleach. Generally, higher concentrations of CRALBP or longer incubation times induced higher levels of bleach (Figure 4D). The large scatter in the collected measurements with 100 μM CRALBP in Figure 4D likely reflects an unstirred layer surrounding the cell during incubation in the stationary solution containing CRALBP. The cell in Figure 4A was among those showing the fastest kinetics of retinal removal by CRALBP.
Figure 4. Removal of 11-cis Retinal from the Pigment of Red Cones in Darkness by CRALBP.

(A) Incubation of a dark-adapted red cone with 100 μM CRALBP led to a gradual loss of sensitivity. Subsequent application of 11-cis retinal reversed the effect and actually increased sensitivity beyond the initial dark-adapted level (dashed line).
(B) CRALBP accelerated the flash response (indicative of the equivalent of a light-adapted state) and 11-cis retinal reversed the effect and slowed down the response beyond its dark-adapted kinetics. Response 2 was elicited 88 min after the start of the experiment (74 min after the start of CRALBP incubation). Response 3 was elicited 164 min after the start of experiment (27 min after the start of incubation with 11-cis retinal).
(C) Calibration experiment to determine the relation between the amount of free opsin (produced by bleaching with light) and the decrease in sensitivity in red cones (see Experimental Procedures). Averaged data from eight cells.
(D) Collected results from cells treated with 20 μM CRALBP (n = 12), 100 μM CRALBP (n = 15), and 20 μM IRBP (n = 5). Same experimental procedure as in (A) and calculated from the calibration curve in (C).
(E) Time course of red cone pigment loss in vitro measured spectroscopically (see Experimental Procedures) in PBS control solution alone (two experiments), with 8.5 μM CRALBP (three experiments), and with 1% BSA (two experiments), respectively. Averaged data. The curves are single-exponential decays, with time constants of 17 min and 156 min, respectively.
Similar results were obtained when dark-adapted cones were treated with another retinal binding protein, IRBP, which binds both 11-cis and all-trans retinal (Chen and Noy, 1994) (Figure 4D). On the other hand, CRALBP had no effect on red rods even after 48 hr of incubation at room temperature (n = 2, data not shown), supporting the notion that rod pigment is much more stable.
Interestingly, lipid-free bovine serum albumin (BSA), a nonspecific lipophilic protein, did not have any effect on red cones (six cells) even at high concentration (1%) and after incubation for 4 days in darkness at 4°C (two experiments, data not shown). Thus, there appears to be a specific interaction between retinal binding proteins and the chromophore. Also, we found that CRALBP was able to remove retinal and desensitize a dark-adapted red cone even when only the cell’s inner segment was exposed to the protein (with the outer segment drawn into the recording pipette in this case; three cells, data not shown). This result is consistent with a previous observation that, in salamander red cones, free chromophore can diffuse longitudinally between the inner and outer segments (Jin et al., 1994).
The difference between CRALBP and BSA in the ability to remove chromophore from red cone pigment was confirmed by in vitro spectrophotometric measurements on recombinant red cone pigment purified from COS cells. In the experiment of Figure 4E, the visual pigment in control solution showed a slow rate of decay (with a single-exponential time constant of about 156 min), presumably reflecting slow denaturation of the protein. In the presence of 8.5 μM CRALBP, but not 1% BSA, the rate of decay of visual pigment was considerably accelerated, representing the dark dissociation of pigment, which was rendered irreversible in the presence of CRALBP. The in vitro dissociation of the pigment, with a time constant of about 19 min (equal to the reciprocal of the difference between the decline rate constants with and without CRALBP), is considerably faster than that observed in intact cones. The likely explanation is that CRALBP has more direct access to the chromophore in vitro than in intact cones.
Presence of Free Opsin in Dark-Adapted Red Cones, Blue Cones, and Green Rods
The desensitization and acceleration in response kinetics produced in red cones by CRALBP could be completely reversed by treating the cells with 11-cis retinal afterward (Figures 4A and 4B). Surprisingly, such reversal in sensitivity and response kinetics by 11-cis retinal overshot the initial dark-adapted state, suggesting the presence of free opsin already in dark-adapted red cones. Indeed, even freshly dissociated, dark-adapted red cones treated immediately with 100 μM 11-cis retinal showed an increase in flash sensitivity by 0.28 ± 0.04 log units (n = 18) (see, for example, Figure 5A). This increase in sensitivity was much faster than the time course of chromophore exchange observed with 9-cis retinal (cf. Figure 3D), and the rate was also similar to the rate of regeneration of cone pigment observed previously (Wald et al., 1955; Shichida et al., 1994; Kefalov et al., 2001). Treatment with 100 μM 11-cis A2 retinal likewise increased sensitivity by 0.19 ± 0.05 log units (n = 10; data not shown), ruling out the possibility that the increase in sensitivity merely reflected replacement of A2 chromophore by A1 chromophore in the pigment, which would result in a higher extinction coefficient (see Experimental Procedures). All-trans retinal delivered in the same way had no effect (n = 6, not shown), nor did the vehicle 0.1% EtOH (see earlier). Incidentally, the increase in flash sensitivity of dark-adapted red cones produced by 11-cis retinal was not accompanied by a decrease in dark noise (three cells; data not shown). This result demonstrates that free opsin is not a significant source of dark noise, consistent with the notion that free cone opsin elicits very small unitary responses (Cornwall et al., 1995).
Figure 5. Effect of 11-cis Retinal on Flash Sensitivity.

Treatment with 100 μM 11-cis retinal causes an increase in flash sensitivity in dark-adapted red cones (A), blue cones (C), and green rods (D), but not in red rods (B). S/S0 is ratio of sensitivity at a given time after 11-cis retinal application to control sensitivity prior to retinal application. Data from a single cell in each panel.
How much free opsin is present in dark-adapted red cones? From the measured relation between degree of desensitization and light bleach (Figure 4C), a sensitivity increase in darkness of 0.28 ± 0.04 log units by 11-cis A1 retinal indicates 12.6% ± 1.7% free opsin in the red cones in darkness. Likewise, a dark-sensitivity increase of 0.19 ± 0.05 log units produced by 11-cis A2 retinal (see above) corresponds to 8.4% ± 2.2% free opsin in darkness (n = 10). It is unlikely that the difference in percentage between A1 and A2 retinal treatments resulted merely from the higher extinction coefficient of A1 pigment, because the percentage of free opsin was too small. Possibly, the much less stable A2 retinal was delivered at an effective concentration lower than the nominal concentration and therefore led to incomplete pigment regeneration. More likely, however, the difference reflects nothing more than measurement uncertainty. At any rate, the percentage of free opsin in dark-adapted red cones appears to be ~10%. Ideally, for the purpose of estimating the amount of free opsin in a red cone, the bleaching curve to be used (instead of Figure 4C) should be obtained by first regenerating any free opsin in dark-adapted red cones with exogenous retinal before the cells were illuminated by bleaching light of different intensities. However, this procedure was not possible because the exogenous chromophore, once incorporated, tended to stay with the cell and to regenerate any light-bleached pigment (Hárosi, 1984).
In contrast to red cones, dark-adapted red rods treated with 100 μM 11-cis retinal showed no change in sensitivity, consistent with the stability of rod pigment (n = 5, see Figure 5B for example). How about blue cones and green rods? These photoreceptors are unusual in that they share the same visual pigment, namely, a blue cone pigment (Ma et al., 2001). Treatment of dark-adapted blue cones with 100 μM 11-cis retinal increased their sensitivity by 0.41 ± 0.04 log units (n = 11, see Figure 5C for example). Likewise, treatment of green rods with retinal increased their sensitivity by 0.28 ± 0.02 log units (n = 2, see Figure 5D for example). Thus, at least qualitatively similar to red cone opsin, blue cone opsin shows dissociation in darkness. Moreover, the fact that blue cones and green rods, which have the same pigment but distinct rod-versus-cone morphology and intracellular environments, both show pigment dissociation indicates that it is the pigment itself rather than unique features in cones that determines pigment stability.
Pigment Dissociation versus Thermal Isomerization in Desensitization of Dark-Adapted Red Cones
The red cone pigment has a relatively high rate of thermal isomerization. This sustained spontaneous activity desensitizes the cells and accelerates their response kinetics in darkness (Rieke and Baylor, 2000; Kefalov et al., 2003). Accordingly, we compared the desensitizing effect of pigment dissociation with that due to its thermal activation. We did this by first exposing dark-adapted red cones to 100 μM 11-cis retinal to ensure complete regeneration of the pigment and then illuminating the cells with steady light of different intensities and measuring the reduction in flash sensitivity at each background intensity. The relation between desensitization and background intensity (Figure 6, averaged from seven cells) allows conversion of dissociated pigment into an equivalent steady light by comparing their corresponding desensitizing effects. The average desensitization due to free opsin in dark-adapted red cones, measured above to be 0.24 log units (mean of 0.28 and 0.19 obtained from 11-cis A1 and A2 retinals, respectively), is thus equivalent to about 500 isomerizations (R*) s−1. Previously, we have estimated the rate of thermal isomerization of pigment in salamander red cones to be ~200 R* s−1 (Kefalov et al., 2003; see also Rieke and Baylor, 2000). Hence, the effect of dark dissociation of red cone pigment is comparable to, or larger than, the effect of thermal isomerization of the pigment.
Figure 6. Equivalent Background Light Due to Free Opsin in Dark-Adapted Red Cones.
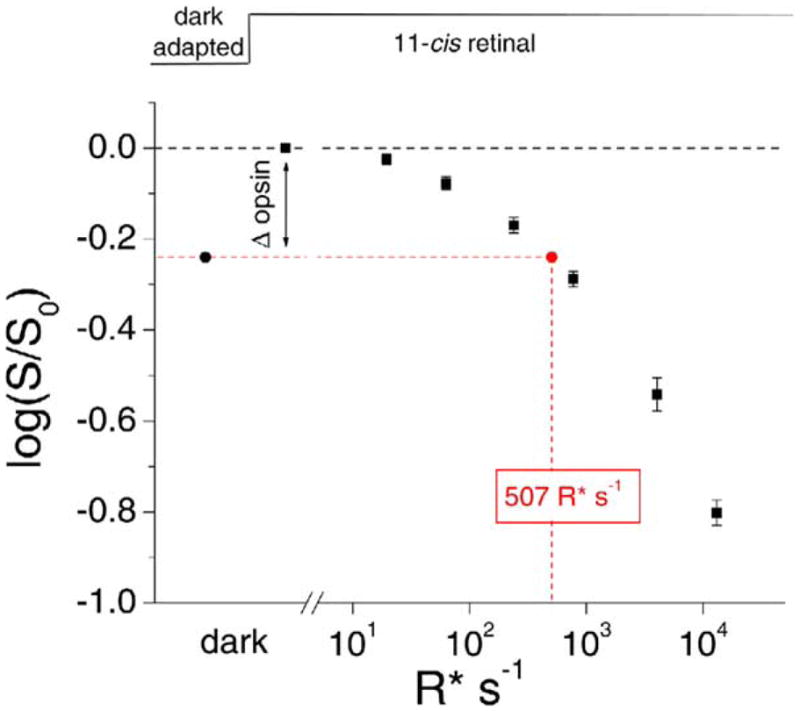
Dark-adapted red cones were first exposed to 100 μM 11-cis retinal to remove any desensitization due to free opsin in darkness. In the continued presence of 11-cis retinal, the cells were exposed to a series of background lights of increasing intensity, and the corresponding desensitization was measured (black squares). Data are mean ± SEM. By interpolation, the average loss of sensitivity due to free opsin in dark-adapted cells as revealed by treatment with 11-cis retinal (Δopsin; black circle) is equivalent to that caused by a background light producing 507 R* s−1 (red circle). Incidentally, the collective plot shows that, in the absence of dark pigment dissociation, it took 860 R* s−1 (Io; see last paragraph in Discussion) to decrease the red cone sensitivity by half.
Discussion
Dark Dissociation of Cone Pigments into Opsin and 11-cis Retinal
It has previously been reported that cone pigment in solution can dissociate into opsin and 11-cis retinal (Matsumoto et al., 1975). We have shown in this paper that the same dissociation occurs in single intact cones. This pigment instability appears to be common to at least red and blue cone pigments. Moreover, this dissociation is independent of the cellular environment, in that the blue pigment shows the same tendency to dissociate whether in blue cones or green rods (unusual rods absent in higher vertebrates), both of which naturally express this pigment. By contrast, red rod pigment does not appear to show any dissociation.
The dark dissociation of cone pigments may be a manifestation of the same molecular properties that underlie their susceptibility to chemical attack. The Schiff base between rod opsin and retinal is resistant to alum, hydroxylamine, and alkaline/acidic conditions. In contrast, the covalent bond between cone opsin and 11-cis retinal is hydrolyzed by these reagents (Wald et al., 1955; Abrahamson et al., 1974). These properties may all reflect a higher accessibility of the chromophore binding pocket in cone opsins to the external environment. The same molecular attributes may also underlie, somehow, the much faster decay of photoisomerized cone pigments compared to rod pigment as well as their subsequent rapid regeneration from free chromophore and opsin (Wald et al., 1955; Okada et al., 1994; Imai et al., 1995; Starace and Knox, 1997).
Our experiments have shed light on a long-standing controversy, namely, whether the steady desensitization of isolated photoreceptors following bright bleaching light (bleaching adaptation) results from an active complex produced by an interaction between all-trans retinal and free opsin (Fukada and Yoshizawa, 1981; Hofmann et al., 1992; Palczewski et al., 1994; however, see also Leibrock et al., 1998) or simply from free opsin itself having a weak ability to activate transducin (Okada et al., 1989; Cornwall and Fain, 1994; Cornwall et al., 1995; Surya et al., 1995; Melia et al., 1997). Our experiments with CRALBP on dark-adapted red cones clearly show that free opsin produced in darkness by pigment dissociation and without the generation of all-trans retinal is capable of causing bleaching adaptation.
Percentage of Free Opsin in Dark-Adapted Cones
The tendency of cone pigments to dissociate into chromophore and opsin means that an equilibrium exists in darkness between free and chromophore-bound opsin. For red cones, we have estimated that ~10% of their opsin does not have 11-cis retinal even under dark-adapted conditions. This high percentage is rather unexpected. We have derived this percentage from the observation that exogenously applied 11-cis retinal produced an average 2-fold increase in the flash sensitivity of dark-adapted red cones, an effect equal and opposite to that produced by a 10% bleach by light. Based on similar experiments, we conclude that free opsin is also present in dark-adapted blue cones and green rods, but not in dark-adapted red rods. This free opsin in cones is unlikely to be an artifact resulting from unintentional exposure to light, because the animals were dark-adapted overnight prior to experiments and were euthanized in very dim red light, with all subsequent procedures performed under infrared light. Moreover, the fact that free opsin was uniformly found in red cones (λmax ~620 nm), blue cones, and green rods (both λmax ~440 nm), but not red rods (λmax ~521 nm) argues against the free opsin being caused by bleaching due to red or infrared light. We have not derived the percentages of free opsin in blue cones and green rods, because we did not measure the bleaching curves (the equivalent of Figure 4C) in these cells, a requirement for converting desensitization into free-opsin content.
Free 11-cis Retinal Concentration in Dark-Adapted Red Cones
It is possible to derive a rough estimate of the concentration of native free 11-cis retinal available for pigment regeneration in dark-adapted red cones. Assuming that the concentration of exogenous 9-cis retinal (nominally 100 μM) in the chromophore-exchange experiment is high enough that the rate-limiting step in the exchange resides in the dissociation of the native chromophore from cone pigment, the off-rate (koff) is simply given by the reciprocal of the time constant of the exchange, i.e., ~1/160 min−1 (we have assumed implicitly here that 11-cis A1 and A2 retinals dissociate from cone opsin with the same rate constant). Previously, it has been shown that nominal 50 μM exogenous 11-cis retinal restores the dark-adapted state of a bleached salamander red cone with a time constant of ~1 min (see Figure 5 in Kefalov et al., 2001; the nominal 50 μM value is based on a 0.5 ml of 100 μM chromophore-containing solution being added to a bath solution of roughly equal volume in the published experiments). This time constant, τ, is given by τ = 1/([L]kon + koff), where [L] is the chromophore concentration. Thus, we get kon ~1/50 μM−1 min−1. This kon value and an [L] of 100 μM give a [L]kon that is much greater than koff, thus justifying the above estimation of koff. In steady state in darkness, we have estimated that about 10% of the pigment in a red cone is in the form of free opsin. Therefore, the concentration of native 11-cis retinal in a cone available for pigment regeneration is given by 0.9 koff/0.1 kon ~2.8 μM, or corresponding to just 0.1% of the total pigment concentration in a cone cell (3.5 mM; see Hárosi, 1975). In the last step of the above calculations, we have assumed that exogenous and native free chromophores have identical access to the opsin (i.e., similar kon’s). Considering the hydrophobicity of 11-cis retinal, this is perhaps not an unreasonable assumption.
koff can also be calculated as the reciprocal of the decay time constant of the holopigment content in a cone cell during exposure to CRALBP (Figure 4D). In these experiments, the rate of decline was rather variable from cell to cell, which we attribute to the lack of stirring of the bath solution immediately adjacent to the outer segment. The two cells with the fastest declines would give koff ~1/65 min−1, about 2-fold higher than the value derived above from the exchange experiment with 9-cis retinal. One possibility for this disparity is that, given its hydrophobicity, the chromophore molecule that has just dissociated from an opsin molecule may stay briefly in the vicinity of the binding pocket and thus may recombine with the opsin unless taken away by CRALBP. Accordingly, the koff value derived from the CRALBP experiment may be closer to the true koff. Indeed, the same CRALBP experiment in solution gave an even higher koff, about 1/19 min−1 (see Figure 4E and associated text) (a similar koff can be deduced from the in vitro data shown in Figure 1 of Matsumoto et al., 1975). Thus, the koff of 1/140 min−1 used in the above calculations is best considered as an “effective” koff, influenced by the native environment of the cone cell. Nonetheless, this is probably the more appropriate parameter to use for calculations because it reflects the native condition.
Our estimation of the concentration of free 11-cis retinal in cones is possible only because of the dissociation property of cone pigments. The very low amount of free chromophore that we have arrived at explains the lack of obvious pigment regeneration observed in isolated cones after a bleach (Jones et al., 1989). One may ask: why does the cone not increase its store of free 11-cis retinal so that all of its opsin is chromophore bound? Considering that 11-cis retinal (being an aldehyde) is highly reactive, there may be good reasons why the cones do not have a large reserve of it, relegating this storage instead to specialized cells such as the pigment epithelium. As pointed out earlier, the dissociation property of cone pigment may be an inevitable byproduct of other functionally more important properties, such as the rapid decay of its photoproducts and its rapid regeneration from 11-cis retinal and cone opsin. Although the consequence of dissociation is that a certain fraction of the cone pigment is always in the form of free opsin, this may not be critical because cones generally function in bright light anyway. On top of this, the desensitization caused by free opsin helps to lower the sensitivity of cones for functioning in the photopic range. As for rods, they may well have a low storage of 11-cis retinal like cones, but this is a nonissue because rhodopsin formation is essentially irreversible.
Overall Desensitization Due to Cone Pigment Instability
In salamander red cones, the 2-fold desensitization due to dark dissociation of the red cone pigment is equivalent to that produced by a steady light giving ~500 photoisomerizations (R*) s−1. This level of dark light is comparable to, or actually exceeds, that due to thermal isomerization of the same pigment, which we have previously estimated to be ~200 R* −1 (Kefalov et al., 2003; see also Rieke and Baylor, 2000). For blue cones, there is a remarkably similar 2-fold desensitization produced by blue pigment dissociation. With the blue cone pigment thought to have a much lower rate of thermal isomerization than red cone pigment (Rieke and Baylor, 2000), dissociation is probably the only significant mechanism by which photopigment contributes to the sensitivity difference between blue cones and (red) rods, because rod and cone pigments are otherwise known to signal indistinguishably downstream (Kefalov et al., 2003).
How much of the overall difference in sensitivity between salamander red rods and red cones in darkness can be accounted for at the pigment level? Previously, based on the idea that, except for cone pigment instability, rods and cones operate along the same light-adaptation curve, we deduced that a spontaneous isomerization rate of ~200 R* s−1 in red cones should make these cells 6- to 7-fold less sensitive than red rods (Kefalov et al., 2003). This reasoning is based on the fact that salamander green rods and blue cones, which share the same pigment, indeed have similar single-photon response amplitudes and kinetics (Ma et al., 2001; Rieke and Baylor, 2000; see also Perry and Mc-Naughton, 1991). If we include, then, the 2-fold (or less) sensitivity reduction due to pigment dissociation, the overall sensitivity difference between salamander red rods and red cones due to red cone pigment instability would be ~7 × 2 = 14-fold, close to the full 14- to 15-fold difference measured between these cells (Nakatani and Yau, 1989; Rieke and Baylor, 2000). Incidentally, the apparent paradox that an equivalent light of 500 R* s−1 due to pigment dissociation produces only 2-fold desensitization, versus the deduced 6- to 7-fold desensitization due to 200 R* −1 of spontaneous pigment isomerization, can be qualitatively reconciled by the fact that any incremental light has a progressively smaller desensitizing effect. This point can be appreciated by starting with the Weber-Fechner relation for background adaptation in rods (see, for example, Koutalos et al., 1995):
where is flash sensitivity in the absence of back-ground light, SF(IB) is flash sensitivity in the presence of a background light IB, and Io is a constant that designates the desensitizing effectiveness of background light. When IB = Io, sensitivity becomes halved; thus the smaller Io is, the more effective is a given background light. For salamander red rods, Io ~50 R* s−1 (see Figure 7 in Koutalos et al., 1995; also, for unpolarized light at λmax used in this quoted work, effective collecting area of the red rod is ~20 μm2). Applying 200 R* −1 of spontaneous pigment isomerization thus gives a 6- to 7-fold desensitization, as stated above. In the constant presence of this spontaneous isomerization, the new Weber-Fechner relation would have an Io of ~(50 + 200) or 250 R* s−1. Thus, any light (real or equivalent) in addition to spontaneous isomerization would be much less effective, requiring 250 R* −1 to decrease sensitivity by half. Our measured value of ~500 R* −1 (equivalent light due to cone pigment dissociation) is not “too far off” from this value.
Nonetheless, green rods are unusual by having a cone pigment, and these rods are not present in all vertebrates (absent in mammals, for example), so any extrapolation from the green rod/blue cone comparison to rod/cone differences at large may not be appropriate. Indeed, a very different scenario is still possible: namely, a lower amplification is built into each of the multiple stages of phototransduction in red cones (Tachibanaki et al., 2001). If so, regardless of whether the cone pigment is unstable or not, it will require a much stronger background light to produce the same desensitization in cones as in rods; in other words, they do not operate on the same basic Weber-Fechner adaptation curve. As such, the reasoning of applying the cone “dark light” to red rod adaptation as a way to calculate red cone sensitivity would no longer be justified. Put in another way, the sensitivity of salamander red cones would not necessarily increase by as much as 6- to 7-fold if their spontaneous isomerizations were removed (a situation that, unfortunately, cannot be verified experimentally at present). Instead, the sensitivity may increase by only 2-fold or less. This point can be appreciated as follows. Adopting the Weber-Fechner relation for cones (see, for example, Rieke and Baylor, 2000), we can write, by incorporating spontaneous pigment isomerization and dissociation
where Iisom and Idiss are the equivalent dark light due to spontaneous pigment isomerization and dissociation, respectively. Written in this way, it can readily be seen that, from the data in Figure 6 for red cones (where Idiss = 0 under the experimental conditions, because of excess 11-cis retinal present), Io + Iisom ~900 R* s−1 (see also Rieke and Baylor, 2000). Because Iisom ~200 R* s−1, we get Io ~700 R* s−1. Hence, in the absence of pigment instability, the salamander red cone would require a steady light of ~700 R* s−1 in order to decrease sensitivity by half. In other words, removing the spontaneous isomerization of red cone pigment (200 R* s−1) would increase the red cone sensitivity by less than 2-fold. In this situation, then, spontaneous pigment isomerization and dissociation would each contribute a 2-fold or less decrease in sensitivity, giving at most an overall ~2 × 2 = 4-fold difference in sensitivity between salamander red rods and red cones due to pigment properties. This leaves another 4-fold or more difference in sensitivity still unaccounted for.
The final settlement between the above two scenarios remains at large. In part, the overall 16-fold difference in sensitivity between salamander red cones and red rods is not quite large enough for unequivocally settling the above dilemma. This question is better addressed in the future with a genetic approach on mammals, where the rod/cone difference in sensitivity is much larger than 14- to 15-fold (e.g., Nunn et al., 1984).
Experimental Procedures
Electrophysiology
Following overnight dark adaptation, larval tiger salamanders (Ambystoma tigrinum) were decapitated in dim red light, double pithed, and the eyes enucleated and hemisected in Ringer’s solution containing 110 mM NaCl, 2.5 mM KCl, 1.6 mM MgCl2, 1.0 mM CaCl2, 10 mM dextrose, 10 mM HEPES (pH 7.8), and bovine serum albumin (100 mg/l). Under infrared light, the retina was removed and chopped finely with a razor blade. A small suspension of cells was transferred to a gravity-fed perfusion chamber on the stage of an inverted microscope (Cornwall et al., 1990). Under infrared illumination, the inner segment of a single cone or rod photoreceptor was drawn into the tip of a tight-fitting glass pipette (Baylor et al., 1979) filled with Ringer’s solution and stimulated with 20 ms flashes of unpolarized light. Different rod and cone types were identified by their characteristic shapes and spectral sensitivities. The photoreceptor current was amplified, low-pass filtered at 20 Hz (8-pole Bessel), and digitized at 100 Hz for further analysis. Light wavelength and intensity were controlled with interference and neutral density filters. The light source was calibrated before each experiment.
Microspectrophotometry
Isolated photoreceptors were prepared as described above for electrophysiology. A small aliquot of these cells was transferred into a chamber bound by two coverslips. Spectrophotometric measurements were made with a computer-controlled photon-counting microspectrophotometer as previously described (MacNichol, 1978; Levine and MacNichol, 1985). The optical density (O.D.) of a rod or cone outer segment was measured over the wavelength range of 350–700 nm with a rectangular slit smaller than the outer segment, where O.D. = log10(Io/It), where Io is the transmitted light in the absence of a sample and It is the transmitted light through the outer segment. The collected O.D. spectra for each photoreceptor were fitted by a fifth-order polynomial function to determine the wavelength at which maximum O.D. occurred. The fit range was 450–600 nm for red rods and 450–700 nm for red cones. Spectral measurements of individual rod and cone outer segments were made on dark-adapted cells or cells that had been treated, either in darkness or following exhaustive bleaching, with a solution of lipid vesicles containing 9-cis retinal. Ringer’s solutions containing chromophore were prepared daily from 300 μg dry aliquots of retinoid by dissolving the chemical in 0.1% ethanol or loading them into lipid vesicles as described previously (Cornwall et al., 2000). The final concentration of 9-cis retinal, at 10–200 μM, was estimated from the absorption spectrum.
Baseline correction of spectra was performed as described by Govardovskii et al. (2000). Briefly, a straight line was fitted to the long-wavelength region of the spectrum where no wavelength-dependant changes in the absorbance spectrum were measurable by the MSP (absorbance < ~5% of peak value). The linear trend was then subtracted from all of the data points. The difference in λmax between corrected and uncorrected data was within 5 nm.
Spectral Templates
We used the 11-cis A1 and A2 retinal spectral templates derived by Govardovskii et al. (2000) and the 9-cis A1 retinal spectral template of Makino et al. (1999). To create the calibration curve for native red cones (Figure 2B), we first created a composite spectral template by combining the A1 and A2 red cone pigment templates as x A1(λ) + 0.71 (1 − x) A2(λ), where A1(λ) and A2(λ) are the 11-cis A1 and A2 red cone pigment templates, x is a variable fraction in A1, and 0.71 is the ratio between the extinction coefficients of the two pigments, which are εA1 = 42,000 M−1 cm−1 (Hárosi, 1975) and εA2 = 30,000 M−1 cm−1 (Brown et al., 1963). The quantum efficiencies of the two 11-cis pigments are considered equal (Dartnall, 1972). From the composite template, log10(S600/S480) can be obtained at different x values to give the calibration curve in Figure 2B. Averaged measurements from dark-adapted red cones gave log10(S600/S480) = 0.54 ± 0.02 (n=10) (see Results), which, from Figure 2B, corresponds to 48% A1 and 52% A2 pigments. We used these percentages to produce one average composite 11-cis template.
To create the calibration curve with 9-cis retinal incorporation (Figure 2D), we combined the above composite 11-cis template, 11-CIS(λ), with the 9-cis red cone pigment template, 9-CIS(λ), as (1 − y) 11-CIS(λ) + 0.32 y 9-CIS(λ), where y is a variable fraction in 9-cis pigment and 11-CIS(λ) = 0.48 A1(λ) + 0.71 × 0.52 A2(λ) (see last paragraph). The factor 0.32 reflects the fact that the quantum efficiency of the 9-cis pigment is only 0.3 of the quantum efficiency of the 11-cis pigments, but it has a higher extinction coefficient ε9-cis of 45,500 M−1 cm−1 (Hubbard and Kropf, 1958). From the overall template at different y values (Figure 2C), log10(S600/S480) can be obtained to give the calibration curve of Figure 2D.
Calculations of Photobleach and Photoisomerizations
For the dependence of flash sensitivity on the percentage of pigment bleached by light (Figure 4C), a dark-adapted red cone was exposed to a series of incremental bleaches, removing 10%, 28%, 50%, 75%, 97.5%, and 99% of the chromophore. After each successive bleach, the cell was allowed to recover to a steady state before its flash sensitivity was measured. The fraction of pigment bleached was calculated as F = 1 - e−IPT, where I is the bleaching light intensity in photons (600 nm) μm−2 s−1 and T is the duration of light exposure. The P value adopted for red cones is 6.0 × 10⁻⁹ μm2 (Jones et al., 1993).
To convert light intensities to number of photoisomerized pigment molecules, we used an effective collecting area, Ac, for red cones of 1.2 μm2, calculated from Ac = 2.303πr2lQisomfα, where r and l are the radius and length of the outer segment (2 μ and 10 μ, respectively; see Nakatani and Yau, 1989), Qisom is the quantum efficiency of isomerization (0.67, Dartnall, 1972), f is a polarization factor (0.5 for unpolarized light), and α is the specific absorbance (0.012 μ −1, Hárosi, 1975). At low bleaches, the formula in the previous paragraph approximates to a linear relation and predicts a fractional bleach that is within 20% of that calculated from Ac above and a total red cone pigment content of 2.7 × 10⁸ molecules.
Application of Retinoid and Retinoid Binding Proteins
Ringer’s solutions containing retinoids used in electrophysiological experiments were prepared by the same methods as those used in microspectrophotometric experiments (see above).
Recombinant CRALBP was purified to homogeneity by Ni2+-His-tag affinity chromatography as described by Crabb et al. (1998) and kept frozen in BTP buffer (10 mM Bis-Tris Propane buffer and 250 mM NaCl, pH 8.0) at 2.2 mg ml−1. Before use, it was dialyzed overnight at 4°C in Ringer’s solution with the 3500 MWCO Slide-A-Lyzer kit (Pierce Biotechnology, Rockford, IL). Its concentration was calculated from absorption at 278 nm (ε = 24,540 M−1 cm−1) and adjusted to 20 μM or 100 μM. Bovine IRBP was kept frozen in Ringer’s solution. Before use, its concentration was measured from absorption at 280 nm (ε = 120,000 M−1 cm−1) and adjusted to 20 μM. Lipid-free bovine serum albumin (Sigma, St. Louis, MO) was directly dissolved in Ringer’s at 1% (weight-volume) final concentration. 0.5 ml of the Ringer’s containing retinal or retinal binding protein was added to the recording chamber directly with a pipette and left to sit without perturbation. Because the bath volume was also about 0.5 ml, the effective concentration was about half of the added concentration. All concentrations given in the paper are nominal values, i.e., before this dilution factor was corrected for. In Results, “11-cis retinal” automatically means 11-cis A1 retinal unless specified otherwise.
Recombinant Salamander Cone Pigments
The cDNAs for the salamander cone pigments were modified at the 3′ end to include the 1D4 epitope from rhodopsin and were sub-cloned into the pMT3 expression vector as described previously (Ma et al., 2001; Das et al., 2004). The plasmids were transiently transfected into COS cells and protein purified and reconstituted as described previously (Oprian, 1993; Ma et al., 2001). Briefly, transfected COS cells were incubated with 20 μM 11-cis retinal in PBS for 2 hr at 4°C in the dark. The cells were then solublized with 1% dodecyl maltoside for 1 hr, and the protein was immunopurified with the anti-rhodopsin 1D4 antibody (National Cell Culture Center, Minneapolis, MN) conjugated to sepharose 4B. The sepharose beads were washed extensively with 0.1% dodecyl maltoside in PBS and the pigment eluted with the same buffer containing 175 μM peptide corresponding to the final 9 amino-acid residues of rhodopsin.
UV-visible absorption spectra were recorded on pigment samples with a 1.0 cm path length at room temperature (22°C). 10 μl of BTP buffer alone or containing 8.5 μM CRALBP or 1% bovine serum albumin was added to 90 μl of pigment in 0.1% dodecyl malto-side in PBS, pH 7.0. At the end of the experiment, any residual pigment was bleached with light in order to obtain the control absorbance at 560 nm after total loss of pigment.
Acknowledgments
This paper is dedicated to the memory of Edward (Ted) MacNichol, whose apparatus was used for some of the microspectrophotometric (MSP) experiments. We thank Dr. David Cameron for help in the collection and analysis of some early MSP data and Dr. Clint Makino for the use of his MSP instrument, Dr. Barbara Wiggert for a generous gift of IRBP, and Dr. John Crabb for the gift of the CRALBP expression vector. Members of the Yau laboratory have provided invaluable comments on the work and manuscript. Supported by NIH EY 06837 and the Ruth and Milton Steinbach Fund (K.-W.Y.), EY 01157 (M.C.C.), EY 04939 (R.K.C.), EY 13748 (M.K.), and an unrestricted grant to the Department of Ophthalmology, MUSC from Research to Prevent Blindness.
References
- Abrahamson EW, Fager RS, Mason WT. Comparative properties of vertebrate and invertebrate photoreceptors. Exp Eye Res. 1974;18:51–67. doi: 10.1016/0014-4835(74)90043-8. [DOI] [PubMed] [Google Scholar]
- Azuma K, Azuma M. The regeneration of visual pigments and the change of rod hypersensitivity after irradiation by bleaching light in frog retina. Photochem Photobiol. 1980;32:529–538. doi: 10.1111/j.1751-1097.1980.tb03799.x. [DOI] [PubMed] [Google Scholar]
- Baylor DA. Photoreceptor signals and vision. Proctor lecture. Invest Ophthalmol Vis Sci. 1987;28:34–49. [PubMed] [Google Scholar]
- Baylor DA, Lamb TD, Yau KW. The membrane current of single rod outer segments. J Physiol. 1979;288:589–611. [PMC free article] [PubMed] [Google Scholar]
- Baylor DA, Matthews G, Yau KW. Two components of electrical dark noise in toad retinal rod outer segments. J Physiol. 1980;309:591–621. doi: 10.1113/jphysiol.1980.sp013529. [DOI] [PMC free article] [PubMed] [Google Scholar]
- Brown PK, Gibbons IR, Wald G. The visual cells and visual pigment of the mudpuppy, Necturus. J Cell Biol. 1963;19:79–106. doi: 10.1083/jcb.19.1.79. [DOI] [PMC free article] [PubMed] [Google Scholar]
- Burns ME, Baylor DA. Activation, deactivation, and adaptation in vertebrate photoreceptor cells. Annu Rev Neurosci. 2001;24:779–805. doi: 10.1146/annurev.neuro.24.1.779. [DOI] [PubMed] [Google Scholar]
- Chen Y, Noy N. Retinoid specificity of interphotoreceptor retinoid-binding protein. Biochemistry. 1994;33:10658–10665. doi: 10.1021/bi00201a013. [DOI] [PubMed] [Google Scholar]
- Chen JG, Nakamura T, Ebrey TG, Ok H, Konno K, Derguini F, Nakanishi K, Honig B. Wavelength regulation in iodopsin, a cone pigment. Biophys J. 1989;55:725–729. doi: 10.1016/S0006-3495(89)82871-1. [DOI] [PMC free article] [PubMed] [Google Scholar]
- Cornwall MC, Fain GL. Bleached pigment activates transduction in isolated rods of the salamander retina. J Physiol. 1994;480:261–279. doi: 10.1113/jphysiol.1994.sp020358. [DOI] [PMC free article] [PubMed] [Google Scholar]
- Cornwall MC, Fein A, MacNichol EF., Jr Cellular mechanisms that underlie bleaching and background adaptation. J Gen Physiol. 1990;96:345–372. doi: 10.1085/jgp.96.2.345. [DOI] [PMC free article] [PubMed] [Google Scholar]
- Cornwall MC, Matthews HR, Crouch RK, Fain GL. Bleached pigment activates transduction in salamander cones. J Gen Physiol. 1995;106:543–557. doi: 10.1085/jgp.106.3.543. [DOI] [PMC free article] [PubMed] [Google Scholar]
- Cornwall MC, Jones GJ, Kefalov VJ, Fain GL, Matthews HR. Electrophysiological methods for measurement of activation of phototransduction by bleached visual pigment in salamander photoreceptors. Methods Enzymol. 2000;316:224–252. doi: 10.1016/s0076-6879(00)16726-6. [DOI] [PubMed] [Google Scholar]
- Crabb JW, Chen Y, Goldflam S, West K, Kapron J. Methods for producing recombinant human cellular retinaldehyde-binding protein. Methods Mol Biol. 1998;89:91–104. doi: 10.1385/0-89603-438-0:91. [DOI] [PubMed] [Google Scholar]
- Crescitelli F. The gecko visual pigment: the dark exchange of chromophore. Vision Res. 1984;24:1551–1553. doi: 10.1016/s0042-6989(84)80004-8. [DOI] [PubMed] [Google Scholar]
- Dartnall HJA. Photosensitivity. In: Dartnall HJA, editor. Photosensitivity of Vision. New York: Springer; 1972. pp. 122–145. [Google Scholar]
- Das J, Crouch RK, Ma JX, Oprian DD, Kono M. Role of the 9-methyl group of retinal in cone visual pigments. Biochemistry. 2004;43:5532–5538. doi: 10.1021/bi036097u. [DOI] [PubMed] [Google Scholar]
- Defoe DM, Bok D. Rhodopsin chromophore exchanges among opsin molecules in the dark. Invest Ophthalmol Vis Sci. 1983;24:1211–1226. [PubMed] [Google Scholar]
- Fukada Y, Yoshizawa T. Activation of phosphodiesterase in frog rod outer segment by an intermediate of rhodopsin photolysis. II Biochim Biophys Acta. 1981;675:195–200. doi: 10.1016/0304-4165(81)90226-9. [DOI] [PubMed] [Google Scholar]
- Fukada Y, Okano T, Shichida Y, Yoshizawa T, Trehan A, Mead D, Denny M, Asato AE, Liu RSH. Comparative study on the chromophore binding sites of rod and red-sensitive cone visual pigments by use of synthetic retinal isomers and analogues. Biochemistry. 1990;29:3133–3140. doi: 10.1021/bi00464a033. [DOI] [PubMed] [Google Scholar]
- Govardovskii VI, Fyhrquist N, Reuter T, Kuzmin DG, Donner K. In search of the visual pigment template. Vis Neurosci. 2000;17:509–528. doi: 10.1017/s0952523800174036. [DOI] [PubMed] [Google Scholar]
- Grimm C, Reme CE, Rol PO, Williams TP. Blue light’s effects on rhodopsin: photoreversal of bleaching in living rat eyes. Invest Ophthalmol Vis Sci. 2000;41:3984–3990. [PubMed] [Google Scholar]
- Hárosi FI. Absorption spectra and linear dichroism of some amphibian photoreceptors. J Gen Physiol. 1975;66:357–382. doi: 10.1085/jgp.66.3.357. [DOI] [PMC free article] [PubMed] [Google Scholar]
- Hárosi FI. In vitro regeneration of visual pigment in isolated vertebrate photoreceptors. In: Borsellino A, Cervetto L, editors. Photoreceptors. New York: Plenum; 1984. pp. 41–63. [Google Scholar]
- Hofmann KP, Pulvermuller A, Buczylko J, Van Hooser P, Palczewski K. The role of arrestin and retinoids in the regeneration pathway of rhodopsin. J Biol Chem. 1992;267:15701–15706. [PubMed] [Google Scholar]
- Hubbard R, Brown PK. The action of light on rhodopsin. Proc Natl Acad Sci USA. 1958;44:130–139. doi: 10.1073/pnas.44.2.130. [DOI] [PMC free article] [PubMed] [Google Scholar]
- Hubbard R, Kropf A. The action of light on rhodopsin. Proc Natl Acad Sci USA. 1958;44:130–139. doi: 10.1073/pnas.44.2.130. [DOI] [PMC free article] [PubMed] [Google Scholar]
- Imai H, Terakita A, Tachibanaki S, Imamoto Y, Yoshizawa T, Shichida Y. Photochemical and biochemical properties of chicken blue-sensitive cone visual pigment. Biochemistry. 1995;36:12773–12779. doi: 10.1021/bi970809x. [DOI] [PubMed] [Google Scholar]
- Jin J, Jones GJ, Cornwall MC. Movement of retinal along cone and rod photoreceptors. Vis Neurosci. 1994;11:389–399. doi: 10.1017/s0952523800001735. [DOI] [PubMed] [Google Scholar]
- Jones GJ, Crouch RK, Wiggert B, Cornwall MC, Chader GJ. Retinoid requirements for recovery of sensitivity after visual-pigment bleaching in isolated photoreceptors. Proc Natl Acad Sci USA. 1989;86:9606–9610. doi: 10.1073/pnas.86.23.9606. [DOI] [PMC free article] [PubMed] [Google Scholar]
- Jones GJ, Fein A, MacNichol EF, Jr, Cornwall MC. Visual pigment bleaching in isolated salamander retinal cones. Microspectrophotometry and light adaptation. J Gen Physiol. 1993;102:483–502. doi: 10.1085/jgp.102.3.483. [DOI] [PMC free article] [PubMed] [Google Scholar]
- Kefalov VJ, Crouch RK, Cornwall MC. Role of non-covalent binding of 11-cis-retinal to opsin in dark adaptation of rod and cone photoreceptors. Neuron. 2001;29:749–755. doi: 10.1016/s0896-6273(01)00249-5. [DOI] [PubMed] [Google Scholar]
- Kefalov VJ, Fu Y, Marsh-Armstrong N, Yau KW. Role of visual pigment properties in rod and cone phototransduction. Nature. 2003;425:526–531. doi: 10.1038/nature01992. [DOI] [PMC free article] [PubMed] [Google Scholar]
- Koutalos Y, Nakatani K, Yau KW. The cGMP-phosphodiesterase and its contribution to sensitivity regulation in retinal rods. J Gen Physiol. 1995;106:891–921. doi: 10.1085/jgp.106.5.891. [DOI] [PMC free article] [PubMed] [Google Scholar]
- Leibrock CS, Reuter T, Lamb TD. Molecular basis of dark adaptation in rod photoreceptors. Eye. 1998;12:511–520. doi: 10.1038/eye.1998.139. [DOI] [PubMed] [Google Scholar]
- Levine JS, MacNichol EF., Jr . Microspectrophotometry of primate photoreceptors: art, artifact, and analysis. In: Fein A, Levine JS, editors. The Visual System. New York: Liss; 1985. pp. 73–78. [Google Scholar]
- Ma J, Znoiko S, Othersen KL, Ryan JC, Das J, Isayama T, Kono M, Oprian DD, Corson DW, Cornwall MC, et al. A visual pigment expressed in both rod and cone photoreceptors. Neuron. 2001;32:451–461. doi: 10.1016/s0896-6273(01)00482-2. [DOI] [PubMed] [Google Scholar]
- MacNichol EF., Jr . A photon-counting microspectrophotometer for the study of single vertebrate photoreceptor cells. In: Cool SJ, Smith EL, editors. Frontiers of Visual Science. Berlin: Springer; 1978. pp. 194–208. [Google Scholar]
- Makino CL, Dodd RL. Multiple visual pigments in a photoreceptor of the salamander retina. J Gen Physiol. 1996;108:27–34. doi: 10.1085/jgp.108.1.27. [DOI] [PMC free article] [PubMed] [Google Scholar]
- Makino CL, Groesbeek M, Lugtenburg J, Baylor DA. Spectral tuning in salamander visual pigments studied with dihydroretinal chromophores. Biophys J. 1999;77:1024–1035. doi: 10.1016/S0006-3495(99)76953-5. [DOI] [PMC free article] [PubMed] [Google Scholar]
- Matsumoto H, Tokunaga F, Yoshizawa T. Accessibility of the iodopsin chromophore. Biochim Biophys Acta. 1975;404:300–308. doi: 10.1016/0304-4165(75)90337-2. [DOI] [PubMed] [Google Scholar]
- McBee JK, Palczewski K, Baehr W, Pepperberg DR. Confronting complexity: the interlink of phototransduction and retinoid metabolism in the vertebrate retina. Prog Retin Eye Res. 2001;20:469–529. doi: 10.1016/s1350-9462(01)00002-7. [DOI] [PubMed] [Google Scholar]
- Melia TJ, Jr, Cowan CW, Angleson JK, Wensel TG. A comparison of the efficiency of G protein activation by ligand-free and light-activated forms of rhodopsin. Biophys J. 1997;73:3182–3191. doi: 10.1016/S0006-3495(97)78344-9. [DOI] [PMC free article] [PubMed] [Google Scholar]
- Nakatani K, Yau KW. Sodium-dependent calcium extrusion and sensitivity regulation in retinal cones of the salamander. J Physiol. 1989;409:525–548. doi: 10.1113/jphysiol.1989.sp017511. [DOI] [PMC free article] [PubMed] [Google Scholar]
- Nunn BJ, Schnapf JL, Baylor DA. Spectral sensitivity of single cones in the retina of Macaca fascicularis. Nature. 1984;309:264–266. doi: 10.1038/309264a0. [DOI] [PubMed] [Google Scholar]
- Okada D, Nakai T, Ikai A. Transducin activation by molecular species of rhodopsin other than metarhodopsin II. Photochem Photobiol. 1989;49:197–203. doi: 10.1111/j.1751-1097.1989.tb04096.x. [DOI] [PubMed] [Google Scholar]
- Okada T, Matsuda T, Kandori H, Fukada Y, Yoshizawa T, Shichida Y. Circular dichroism of metaiodopsin II and its binding to transducin: a comparative study between meta II intermediates of iodopsin and rhodopsin. Biochemistry. 1994;33:4940–4946. doi: 10.1021/bi00182a024. [DOI] [PubMed] [Google Scholar]
- Oprian DD. Expression of opsin genes in COS cells. Methods Neurosci. 1993;15:301–306. [Google Scholar]
- Palczewski K, Jager S, Buczylko J, Crouch RK, Bredberg DL, Hofmann KP, Asson-Batres MA, Saari JC. Rod outer segment retinol dehydrogenase: substrate specificity and role in phototransduction. Biochemistry. 1994;33:13741–13750. doi: 10.1021/bi00250a027. [DOI] [PubMed] [Google Scholar]
- Pepe IM. Recent advances in our understanding of rhodopsin and phototransduction. Prog Retin Eye Res. 2001;20:733–759. doi: 10.1016/s1350-9462(01)00013-1. [DOI] [PubMed] [Google Scholar]
- Perry RJ, McNaughton PA. Response properties of cones from the retina of the tiger salamander. J Physiol. 1991;433:561–587. doi: 10.1113/jphysiol.1991.sp018444. [DOI] [PMC free article] [PubMed] [Google Scholar]
- Rieke F, Baylor DA. Origin and functional impact of dark noise in retinal cones. Neuron. 2000;26:181–186. doi: 10.1016/s0896-6273(00)81148-4. [DOI] [PubMed] [Google Scholar]
- Saari JC, Bredberg DL. Photochemistry and stereo-selectivity of cellular retinaldehyde-binding protein from bovine retina. J Biol Chem. 1987;262:7618–7622. [PubMed] [Google Scholar]
- Shichida Y, Imai H, Imamoto Y, Fukada Y, Yoshizawa T. Is chicken green-sensitive cone visual pigment a rhodopsin-like pigment? A comparative study of the molecular properties between chicken green and rhodopsin. Biochemistry. 1994;33:9040–9044. doi: 10.1021/bi00197a002. [DOI] [PubMed] [Google Scholar]
- Starace DM, Knox BE. Activation of transducin by a Xenopus short wavelength visual pigment. J Biol Chem. 1997;272:1095–1100. doi: 10.1074/jbc.272.2.1095. [DOI] [PubMed] [Google Scholar]
- Surya A, Foster KW, Knox BE. Transducin activation by the bovine opsin apoprotein. J Biol Chem. 1995;270:5024–5031. doi: 10.1074/jbc.270.10.5024. [DOI] [PubMed] [Google Scholar]
- Tachibanaki S, Tsushima S, Kawamura S. Low amplification and fast visual pigment phosphorylation as mechanisms characterizing cone photoresponses. Proc Natl Acad Sci USA. 2001;98:14044–14049. doi: 10.1073/pnas.241396898. [DOI] [PMC free article] [PubMed] [Google Scholar]
- Wald G, Brown PK, Smith PH. Iodopsin. J Gen Physiol. 1955;38:623–681. doi: 10.1085/jgp.38.5.623. [DOI] [PMC free article] [PubMed] [Google Scholar]
- Yau KW. Phototransduction mechanism in retinal rods and cones. The Friedenwald Lecture. Invest Ophthalmol Vis Sci. 1994;35:9–32. [PubMed] [Google Scholar]