

Abstract
The TREK1 gene has been linked to a depression‐resistant phenotype in rodents and antidepressant response in humans, but the neural mechanisms underlying these links are unclear. Because TREK1 is expressed in reward‐related basal ganglia regions, it has been hypothesized that TREK1 genetic variation may be associated with anhedonic symptoms of depression. To investigate whether TREK1 genetic variation influences reward processing, we genotyped healthy individuals (n = 31) who completed a monetary incentive delay task during functional magnetic resonance imaging (fMRI). Three genotypes previously linked to positive antidepressant response were associated with potentiated basal ganglia activity to gains, but did not influence responses to penalties or no change feedback. TREK1 genetic variations did not affect basal ganglia volume, and fMRI group differences were confirmed when accounting for self‐report measures of anhedonia. In addition, the total number of “protective” TREK1 alleles was associated with stronger responses to gains in several other reward‐related regions, including the dorsal anterior cingulate cortex, orbitofrontal cortex, and mesial prefrontal cortex. In control analyses, associations between basal ganglia responses to gains and functional polymorphisms in the dopamine transporter (DAT1) and catechol‐O‐methyltransferase (COMT) genes were also explored. Results revealed that TREK1 and DAT/COMT genotypes were independently related to basal ganglia responses to gains. These findings indicate that TREK1 genotypes are associated with individual differences in reward‐related brain activity. Future studies in depressed samples should evaluate whether variation in neural responses to rewards may contribute to the association between TREK1 and antidepressant response in humans. Hum Brain Mapp, 2010. © 2009 Wiley‐Liss, Inc.
Keywords: anhedonia, basal ganglia, endophenotype, imaging genomics, magnetic resonance imaging
INTRODUCTION
Counted in lives lost and socioeconomic costs, major depressive disorder (MDD) is a significant public health problem [Cassano and Fava,2002]. A major goal of depression research is to determine how individual differences in genetic and neural systems contribute to MDD [Hasler et al.,2004; Tsankova et al.,2006]. The TREK1 gene, also called KCNK2, has been linked to a depression‐resistant phenotype in rodents [Heurteaux et al.,2006] and antidepressant response in humans [Perlis et al.,2008b], but the neural mechanisms associated with these effects are unclear. This study adopted an imaging genomics approach [Hariri and Weinberger,2003] to test a candidate hypothesis: that variation in TREK1 genotype is related to individual differences in reward‐related brain activity.
TREK1 is a two‐pore‐domain background potassium channel involved in regulating the excitability and resting potential of neurons [Honore',2007; Talley et al.,2001]. Notably, TREK1 knockout mice display a robust antidepressant phenotype [Heurteaux et al.,2006]. Relative to wild‐type mice, TREK1 knockouts show reduced immobility in the forced swim and tail suspension tests, weaker evidence of learned helplessness and conditioned suppression of motility following electrical shocks, and decreased release of corticosterone after restraint stress [Heurteaux et al.,2006]. In light of these results and work suggesting that the effects of selective serotonin reuptake inhibitors may depend on TREK1 inhibition [Gordon and Hen,2006; Tsai,2008], a recent study examined associations between TREK1 genetic variation and antidepressant response in MDD outpatients [Perlis et al.,2008b]. The study reported that four TREK1 single nucleotide polymorphisms (SNPs) were associated with a positive response to antidepressants (A allele of rs10494996, G allele of rs12136349, C allele of rs2841608, G allele of rs2841616).
Despite these convergent findings, the neural processes linking TREK1 genetic variation to depression and antidepressant response are unknown. The distribution pattern of TREK1 raises the possibility that individual differences in reward processing might play an important role. Across humans and rodents, TREK1 is widely expressed throughout the brain with large concentrations in basal ganglia structures, especially the nucleus accumbens (NAcc), caudate, and putamen [Hervieu et al.,2001; Medhurst et al.,2001; Talley et al.,2001]. Given the importance of these structures to reward processing [Delgado,2007; O'Doherty,2004], it has been hypothesized that TREK1 may be associated with reduced motivation and anhedonia [Heurteaux et al.,2006], which refers to lack of reactivity to pleasurable stimuli. The importance of this potential relationship is underscored by the fact that anhedonia is a cardinal symptom of MDD [American Psychiatric Association,2000] and has been related to chronic illness and poor treatment outcome [McFarland et al.,2006; Moss and Cronkite, 1999; Spijker et al.,2001]. On the basis of this convergent evidence, we reasoned that TREK1 genetic variation might be linked to individual differences in reward processing, which could, in turn, influence antidepressant response.
To test the first component of this hypothesis, genetic information was collected from healthy individuals who participated in a functional magnetic resonance imaging (fMRI) experiment featuring a monetary incentive delay (MID) task that robustly recruits basal ganglia regions [Dillon et al.,2008; Knutson et al.,2001, 2003; Pizzagalli et al.,2009]. Primary analyses focused on relationships between the four TREK1 SNPs associated with antidepressant response [Perlis et al.,2008b] and basal ganglia responses to reward‐predicting cues and gains. In addition, a hypothesis‐generating, whole‐brain regression was used to identify additional brain areas where responses to gains were positively correlated with the total number of “protective” TREK1 alleles possessed by individuals. We predicted that participants carrying TREK1 genotypes associated with better antidepressant response [Perlis et al.,2008b] would show stronger reward‐related basal ganglia activity, and that the total number of protective TREK1 alleles would be correlated with responses in several components of the brain reward system, including the orbitofrontal cortex (OFC) and dorsal anterior cingulate cortex (dACC) [O'Doherty,2004; Rushworth et al.,2007]. Finally, in light of recent work indicating that neural activity during reward processing tasks is sensitive to functional polymorphisms in dopamine transporter (DAT1) and catechol‐O‐methyltransferase (COMT) genes [Dreher et al.,2009; Forbes et al.,2009; Yacubian et al.,2007], control analyses examined whether effects of TREK1 were independent of DAT1/COMT.
MATERIALS AND METHODS
Participants
Thirty‐seven individuals participated after providing informed written consent to a protocol approved by the local IRBs. Data from five participants were excluded due to excessive head movement (i.e., incremental or cumulative movement > 3.75 mm or degrees), leaving a sample of 32 participants (16 females; mean age ± SD: 21.68 ± 3.35 years; education: 14.44 ± 1.54 years; 72% Caucasian; 97% students). The fMRI session was part of a larger project that included a separate electrophysiological component. Previous publications from this project have focused on relationships between fMRI findings and electrophysiological data collected during a different probabilistic reward task [Santesso et al.,2008] and resting states [Wacker et al.,2009]. However, the genetic analyses described here have not been reported previously. DNA was obtained from 31 participants who were right‐handed [Chapman and Chapman,1987], met standard fMRI safety criteria, and reported no history of neurological conditions. To evaluate current and past psychopathology, the Structured Clinical Interview for the DSM‐IV [SCID; First et al.,1995] was administered by trained, masters‐level clinical interviewers. With the exception of one individual with a specific phobia, participants had no current Axis I psychopathology [First et al.,1995; see Supp. Info. for further detail].
To assess current depressive symptoms, mood, and affect, participants completed the Beck Depression Inventory [BDI‐II; Beck et al.,1996], Mood and Anxiety Symptoms Questionnaire [MASQ; Watson et al.,1995], State‐Trait Anxiety Inventory [STAI; Spielberger et al.,1970], and Positive and Negative Affect Schedule [PANAS; Watson et al.,1988]. Participants received $60 for completing the session, and “earned” $20–$22 from the MID task.
Genotyping
DNA obtained from saliva samples was purified, extracted, hydrated, and stored at −80°C (Oragene, DNA Genotek; Ottawa, Ontario, Canada). SNP primers were designed using SpectroDESIGNER software (Sequenom; San Diego, CA). Following a polymerase chain reaction (PCR), an iPLEX mass EXTEND reaction was performed. A Mass ARRAY RT mass spectrometer (Sequenom) [Beutow et al., 2001] analyzed samples in an automated mode. After baseline correction and peak identification, Sequenom SPECTROTYPER software was used to analyze resulting spectra. Every participant was successfully genotyped across TREK1, and concordance for duplicate DNA (n = 8) was 100%. See Supp. Info. for additional information.
Analyses focused on the four TREK1 SNPs previously associated with antidepressant response [Perlis et al.,2008b], which were evaluated directly or imputed by tagging SNPs with r 2 of 1 (Table I). SNPs analyzed did not deviate from Hardy‐Weinberg Equilibrium, P > 0.05 (Table I). The relative location of these four SNPs and the extent of linkage disequilibrium (LD) among them are depicted in Figure 1. Following Perlis et al. [2008a], two groups were formed for each SNP: heterozygotes were grouped with minor allele homozygotes to maximize power. For each SNP, the main comparisons of interest were between‐group tests comparing individuals in the genotype group previously associated with a positive antidepressant response (i.e., the “protected” group: A allele carriers at rs10494996, G homozygotes at rs12136349 and rs2841616, C homozygotes at rs2841608) versus individuals in the other, “at‐risk,” group.
Table I.
SNPs with a priori hypotheses
| SNP | Position | Region | Polymorphism groups | HWE P‐value |
|---|---|---|---|---|
| rs2841616 | chr1:213240461 | Promoter | GG (n = 9), AA/AG (n = 22) | 0.85 |
| rs2841608 | chr1:213257870 | Intron | CC (n = 10), AA/AC (n = 21) | 1.00 |
| rs12136349 | chr1:213317850 | Intron/promoter | GG (n = 21), AG/AA (n = 10) | 0.58 |
| rs10494996 | chr1:213486294 | Downstream | AA/AG (n = 10), GG (n = 21) | 0.58 |
Note. HWE: Hardy–Weinberg Equilibrium. For each polymorphism group, the protective allele group is listed first. Position: the chromosomal and base pair location. Region: the region on the gene in which the SNP is located. Of note, rs2841608 and rs12136349 were imputed based upon rs2802643 and rs7528988, which have r 2 of 1 with the imputed SNPs; accordingly, the listed HWE statistics are for the typed SNPs rs2802643 and rs7528988.
Figure 1.
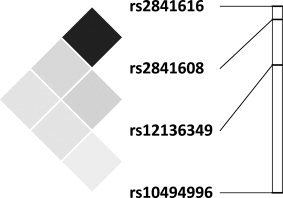
Location of and linkage disequilibrium among TREK1 SNPs. The relative locations of TREK1 SNPs are presented on the right (graphic: chromosome 1, from top to bottom: 213.225–213.501 Mb). The LD plot (presented on the left) uses r 2 as a measure of LD which ranges from 1 (or complete LD, indicated by black squares) to 0 (or absence of LD, indicated by white squares). In our sample, we observed high LD between rs2841608 and rs2841616 (r 2 = 0.80) with low LD among all others (r 2 ≤ 0.14). Plotted using Haploview [Barrett et al.,2005].
In light of reports indicating that DAT and COMT genotypes can influence basal ganglia responses to rewards and reward‐predicting cues [e.g., Dreher et al.,2009; Forbes et al.,2009; Yacubian et al.,2007], we evaluated whether significant TREK1 results might reflect overlap with these genotypes. The dopamine transporter is responsible for dopamine reuptake and is primarily concentrated in subcortical regions, including the ventral striatum [Ciliax et al.,1999]. The DAT1 gene includes a variable nucleotide tandem repeat (VNTR) polymorphism in its 15th exon; the two most common varieties are the 9‐ and 10‐repeat (9‐R and 10‐R) forms [Vandenbergh et al.,1992]. Importantly, the 9‐R allele is expressed at lower levels than the 10‐R allele, which presumably yields increased levels of intrasynaptic dopamine in 9‐R carriers due to lower levels of the dopamine transporter [VanNess et al.,2005]. In support of this hypothesis, multiple neuroimaging studies have found that 9‐R carriers have a larger basal ganglia response to rewards and/or reward‐predicting cues [Dreher et al.,2009; Forbes et al.,2009; but see Yacubian et al.,2007]. For the DAT1 VNTR, PCR amplification and denaturation was followed by capillary gel electrophoresis. The current sample included eight 9‐R carriers (9/10 heterozygotes), twenty‐two 10‐R homozygotes, and a single 10‐R/11‐R heterozygote. For analytic purposes, the 10‐R homozygotes and 10‐R/11‐R heterozygote were combined into one group while 9‐R carriers were placed in the other group.
COMT is an enzyme expressed primarily in cortex that is involved in the degradation of catecholamines, especially extracellular dopamine [Bilder et al.,2004; Matsumoto et al.,2003]. The COMT gene includes a functional polymorphism (rs4680) that codes for the substitution of valine (val; G allele) by methionine (met; A allele). Critically, the COMT val protein is more active than the COMT met protein [Weinshilboum et al.,1999], presumably leading to greater dopamine concentrations in met/met homozygotes versus val/val homozygotes. However, effects of COMT on subcortical dopamine transmission are complex, and it has been proposed that tonically increased cortical concentrations of dopamine observed in met/met individuals may actually reduce phasic dopamine bursting in subcortical regions [Bilder et al.,2004]. Limited neuroimaging work has examined the influence of the COMT val/met polymorphism on reward‐related brain activity. A recent study found no effects of COMT genotype on reward responses in the ventral striatum [Forbes et al.,2009]. However, two other fMRI studies found that met/met individuals had relatively increased activity in subcortical brain regions implicated in reward processing, including the ventral striatum and midbrain, compared to val/val individuals [Dreher et al.,2009; Yacubian et al.,2007]. To further evaluate the effects of this genotype on reward processing, the COMT val/met polymorphism was genotyped using the same method employed for TREK1. For analytic purposes, we divided the sample into three COMT groups: val/val (n = 7), val/met (n = 13), and met/met (n = 9).
MID Task
The MID task was based on prior publications [Knutson et al.,2003] but modified to permit a fully balanced design [Dillon et al.,2008; Pizzagalli et al.,2009]. Trials began with one of three visual cues (1.5 s) signaling potential outcomes (reward: +$; loss: −$; no‐incentive: 0$). Following a jittered interstimulus interval (ISI: 3–7.5 s), a red square target stimulus was presented to which participants responded with a button press. After a second ISI (4.4–8.9 s), visual feedback (1.5 s) indicated whether money had been won (gain) or lost (penalty). No gains or penalties were delivered on no‐incentive trials. Trials were separated by an inter‐trial‐interval (ITI: 3–12 s). Trial randomization and ISI/ITI durations were selected using a genetic algorithm [Wager and Nichols,2003] and optseq2 (http://surfer.nmr.mgh.harvard.edu/optseq/) to maximize statistical efficiency. Participants were told that faster reaction times (RTs) increased the probability of receiving gains and avoiding penalties. In fact, outcomes were presented in a fixed order such that 50% of reward and loss trials ended in gains (range: $1.96–$2.34; mean: $2.15) and penalties (range: −$1.81 to −$2.19; mean: −$2.00), respectively, with the remaining trials ending in “no change” feedback. Gains were larger than penalties to compensate for the fact that individuals typically assign greater weight to penalties than gains of equal size [Kahneman and Tversky,1979]. No information concerning cumulative earnings was provided. To maximize feedback believability, target durations were individually titrated based on RT data collected during a practice block (Supp. Info.).
There were five blocks of 24 trials (8 trials/cue/block), yielding 40 presentations of each cue and 20 gain and penalty outcomes per participant. After blocks two and four, participants rated the cues and outcomes for valence (1 = most negative, 5 = most positive) and arousal (1 = lowest intensity, 5 = highest intensity).
fMRI Data Acquisition
Gradient echo T2*‐weighted echoplanar images were acquired on a 1.5T Symphony/Sonata scanner (Siemens Medical Systems; Iselin, NJ), using tilted slice acquisition (30° to AC‐PC line), z‐shimming [Deichmann et al.,2003], and the following parameters: TR/TE: 2500/35 ms; FOV: 200 mm; voxel dimensions: 3.125 mm × 3.125 mm × 3 mm; 35 slices; 222 volumes. For localization purposes, a high‐resolution T1‐weighted MPRAGE volume was acquired (TR: 2730 ms; TE: 3.39 ms; FOV: 256 mm; voxel dimensions: 1 mm × 1 mm × 1.33 mm; 128 slices). Head movement was minimized with padding.
Behavioral Data Analysis
Demographics, DAT1/COMT distribution, and questionnaires
For each SNP, chi‐squares and between‐groups t‐tests assessed possible differences between TREK1 groups in self‐report measures and the distribution of DAT1 and COMT genotypes.
RT and ratings
Analysis of behavioral data was first conducted across the whole group to verify that the task worked as intended. After removal of outlier trials (log transformed RTs exceeding mean ± 3SD for a given cue), RTs were averaged and entered into an ANOVA with Cue (reward, loss, no‐incentive) and Block as factors. Arousal and valence ratings were averaged across the two assessments and entered into ANOVAs with either Cue or Outcome (gain, penalty, no change feedback on no‐incentive trials) as the within‐subjects factor. To determine whether behavior was influenced by genetic variation, these ANOVAs were repeated after adding the factor Genotype.
Neuroimaging Data Analysis
Data preprocessing
fMRI data preprocessing included motion and slice‐time correction, intensity normalization, removal of slow trends using a second‐order polynomial, and spatial smoothing (Gaussian filter, 6 mm full‐width half‐max). A gamma function (2.5 s delay to rise, 1.25 s dispersion time) convolved with stimulus onsets modeled the hemodynamic response. A temporal whitening filter corrected for autocorrelation in the noise. Motion parameters were included in the model as nuisance regressors.
fMRI analysis
Functional data were examined using the general linear model (GLM) in FS‐FAST and FreeSurfer (http://surfer.nmr.mgh.harvard.edu/). Three main analyses were conducted. First, to verify that the task recruited reward‐related circuitry, whole‐brain analyses were conducted across the entire group, irrespective of genotype. GLM analyses were run on each individual and then with group data using a random effects model. For group analyses, each participant's data were resampled to 2 mm3 voxels and registered to FreeSurfer's average template brain in MNI305 space. The main contrasts of interest were (1) reward cues minus no‐incentive cues, and (2) gains minus no‐incentive feedback. Resulting statistical maps were thresholded using a voxelwise threshold of P < 0.001, and reported clusters were significant at P < 0.05 following correction for multiple comparisons across the whole‐brain using Gaussian Random Fields [Worsley and Friston,1995]. MNI coordinates were transformed to Talairach coordinates [Brett et al.,2001].
Second, due to our a priori hypotheses, a region‐of‐interest (ROI) approach was used to investigate whether genetic variation was associated with basal ganglia reward responses. For each participant, FreeSurfer's automatic segmentation routine [Desikan et al.,2006; Fischl et al.,2002, 2004] defined the NAcc, caudate, putamen, and globus pallidus. Mean beta weights were extracted from these ROIs and entered into ANOVAs with Genotype, Cue or Outcome, Hemisphere, and Structure as factors. Tests that yielded significant Genotype differences were repeated for the DAT1 (9‐R carriers vs. 10/10s or 10/11) and COMT (val/val vs. met/met) genotypes to assess the possible influence of these variables. Given our a priori hypothesis, corrections for multiple comparisons were not applied during this analysis.
A third, exploratory analysis used a whole‐brain regression approach to identify additional brain regions where responses to rewards were associated with TREK1. For this analysis, a single “protective allele count” was computed to provide a sensitive measure of individual differences in genetic variation. The ROI results generated little evidence for an association between TREK1 genotypes and responses to reward cues, but revealed that three SNPs were associated with responses to gains (rs10494996, rs2841608, rs2841616; see Results section). For these SNPs, possession of a protective allele was coded as 1, and possession of an at‐risk allele was coded as 0. The total across all three SNPs was then summed. Thus, for each participant the protective allele count ranged from 0 (no protective alleles) to 6 (two protective alleles for each SNP). This score was regressed against whole‐brain data from the gain versus no‐incentive feedback contrast, allowing us to identify brain regions where responses to gains covaried with protective allele count. For this exploratory analysis, statistical maps were thresholded at P < 0.001, 12 voxel extent [Dillon et al.,2008].
Morphometrical analyses
Analyses focused on the volumes of the NAcc, caudate, putamen, and globus pallidus, extracted from FreeSurfer and normalized by dividing by intracranial volume [Fischl et al.,2002]. Genotype × Hemisphere × Structure ANOVAs examined whether TREK1 genetic variations were associated with basal ganglia volume.
RESULTS
Entire Sample
Because the primary goal of this study was to evaluate the effects of TREK1 genetic variations on reward processing, findings from the entire sample are presented briefly and details are provided in the Supporting Information. Behavioral data were consistent with motivated responding to obtain incentives: RT was fastest on reward trials, intermediate on loss trials, and slowest on no‐incentive trials (all P < 0.001). Reward cues and gains elicited significantly more positive valence ratings than no‐incentive cues and no change feedback on no‐incentive trials (P < 0.04), which in turn elicited significantly more positive ratings than loss cues and penalty feedback (P < 0.001). By contrast, arousal ratings were lowest for no‐incentive cues and no change feedback but did not differ between reward and loss cues (P = 0.72), or gains and penalties (P = 0.36). Most importantly, the reward cue minus no‐incentive cue contrast revealed significant, large clusters in midbrain and bilateral basal ganglia (Supp. Info. Table I), and the gain minus no change feedback contrast revealed activity in several regions associated with reward processing (e.g., bilateral inferior frontal gyrus extending into OFC, caudate, dACC, midbrain; Supp. Info. Table II). These results confirm that the MID task elicited motivated responding and effectively recruited brain reward circuitry.
Results by Genotype
Demographics, DAT1/COMT distribution, and questionnaires
There were no differences between the protected versus at‐risk groups in ethnicity, age, gender, education, distribution of DAT1/COMT genotypes, or scores on the STAI or BDI‐II for any SNP (Supp. Info. Tables III–VI). Furthermore, the PANAS and MASQ revealed no between‐group differences for rs2841608, rs2841616, or rs12136349. However, the group possessing the protective allele (i.e., A carriers) of rs10494996 reported significantly lower scores on the MASQ Anhedonic Depression (AD) and PANAS trait Negative Affect scales (Supp. Info. Table III).
RT and ratings
TREK1 genotypes did not significantly affect RT (Supp. Info. Results). Similarly, with the exception of globally decreased cue‐elicited arousal ratings in the group with the protective variant (i.e., GG homozygotes) of rs2841616 (2.65 ± 0.60) relative to A allele carriers (3.14 ± 0.61), genotypes did not affect subjective responses to cues or outcomes (Supp. Info. Results).
Cue‐elicited activity in basal ganglia ROIs
Analysis of beta weights extracted from basal ganglia ROIs provided little evidence for an association between TREK1 genotypes and responses to reward cues. For rs10494996, a Genotype × Cue × Hemisphere × Structure (NAcc, caudate, putamen, globus pallidus) ANOVA revealed a significant Genotype × Cue × Hemisphere interaction, F(2, 58) = 6.25, P = 0.006. Next, Genotype × Cue ANOVAs were conducted separately in each hemisphere to determine whether effects of TREK1 genotypes on basal ganglia responses to cues were lateralized; however, these tests were nonsignificant (Genotype × Cue interaction, P > 0.32 in both hemispheres). Additional tests revealed that the triple interaction reflected a Cue × Hemisphere effect restricted to individuals carrying the protective variant (A carriers) for this SNP, F(2, 18) = 6.77, P = 0.019 (at‐risk group, P > 0.7). Follow‐up within‐group, t‐tests conducted in A carriers compared responses to no‐incentive, loss, and reward cues in the left versus right hemispheres. The only significant difference was for reward cues, t(9) = 4.23, P = 0.002, reflecting a stronger reward cue response in the left (0.091 ± 0.09) versus right (0.038 ± 0.02) hemisphere. For the other three SNPs, similar ANOVAs revealed no significant interactions involving Genotype and Cue (all P > 0.08).
Outcome‐elicited activity in basal ganglia ROIs
Similar analyses conducted on beta weights from the gain, penalty, and no change (i.e., no‐incentive) feedback conditions revealed that three of the four TREK1 SNPs previously linked to antidepressant response [Perlis et al.,2008b] were associated with variation in basal ganglia responses to gains. Genotype × Outcome × Hemisphere × Structure ANOVAs yielded significant effects involving Genotype for rs10494996 (Genotype, F(1, 29) = 8.13, P = 0.008; Genotype × Outcome, F(2, 58) = 3.10, P = 0.053), rs2841608 (Genotype × Outcome, F(2, 58) = 6.10, P = 0.004), and rs2841616 (Genotype × Outcome, F(2, 58) = 4.33, P = 0.018). For each of these SNPs, the Genotype × Outcome interaction reflected stronger gain responses in individuals possessing the protective variant (see Fig. 2). By contrast, for rs12136349 all effects involving Genotype were nonsignificant (P > 0.54).
Figure 2.
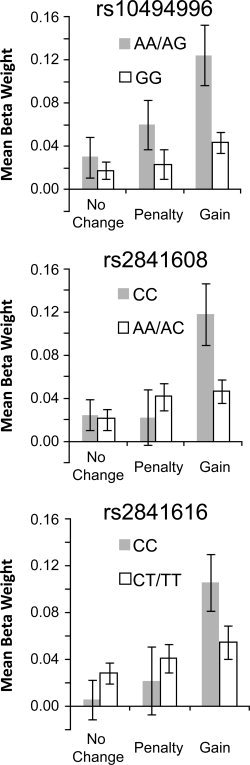
Mean basal ganglia responses to gains, penalties, and no change feedback. For the three SNPs depicted (rs10494996, rs2841608, rs2841616), gains elicited robust activation in individuals possessing two copies of an allele previously associated with antidepressant response (“protective variant”). Note that for rs10494996, individuals homozygous for this allele were grouped with heterozygotes to increase sample size in the protected group (AA homozygotes: n = 2; AG heterozygotes: n = 8; GG homozygotes: n = 21).
For the three SNPs characterized by Genotype × Outcome interactions, follow‐up t‐tests compared mean basal ganglia responses to gains, penalties, and no change feedback for the protected versus at‐risk groups, averaged across hemispheres. The between‐group comparison for gains was significant for rs10494996, t(29) = 2.71, P = 0.02, and rs2841608, t(29) = 2.86, P = 0.008, and marginal for rs2841616, t(29) = 1.88, P = 0.07. In each case, these results reflected stronger responses to gains in the protected group (see Fig. 2). Highlighting the specificity of these findings, between‐groups comparisons for penalties and no change feedback were not significant for any SNP (P > 0.14). Furthermore, between‐groups t‐tests examining gain responses were not significant for either DAT1 (9‐R carriers vs. 10/10s and 10/11), t(29) = 1.36, P = 0.21, or COMT (met/met vs. val/val), t(14) = 0.02, P = 0.98, indicating that the TREK1 results did not simply reflect overlap with these other genotypes.
Analyses controlling for affect and ethnicity
Because homozygotes for the at‐risk allele of rs10494996 reported elevated anhedonic symptoms (Supp. Info. Table III), a hierarchical regression examined whether rs10494996 group membership predicted basal ganglia responses to gains above and beyond MASQ AD scores. Mean basal ganglia response to gains was the criterion variable, and MASQ AD scores and rs10494996 group membership (0 = at‐risk, 1 = protected) were entered in the first and second steps of the model, respectively, as predictors. The model was significant, F(2, 27) = 6.05, P = 0.007, R 2 = 0.31. Importantly, rs10494996 group predicted basal ganglia response to gains after controlling for MASQ AD scores, with possession of the protective allele associated with stronger gain responses (ΔR 2 = 0.157, ΔF = 6.15, P = 0.02; rs10494996 group beta = 0.46, P = 0.02). By contrast, MASQ AD score was not a significant predictor (beta = −0.16, P = 0.40). Thus, differences in MASQ AD scores did not confound rs10494996 group differences in basal ganglia responses to gains.
Because of population stratification concerns, the ROI analyses examining responses to outcomes were repeated for Caucasian participants only (n = 22). The protective groups for rs10494996, rs2841608, and rs2841616 again showed stronger basal ganglia responses to gains than the at‐risk groups, although the critical between‐group t‐tests were no longer significant, probably due to reduced statistical power (Supp. Info. Fig. 1). Combined with the lack of differences in ethnicity for all four SNPs (Supp. Info. Tables III–VI), the similar pattern of results in Caucasians suggests that the main findings were probably not driven by the ethnic composition of the present sample. However, given variable allele frequencies reported across populations of different ancestral origin and nonsignificant results obtained when Caucasians were considered alone, these findings should be considered preliminary until replicated in a larger and more ethnically diverse sample.
Simultaneous regression with TREK1 and DAT1/COMT
Chi‐square analyses revealed no evidence that individuals carrying at‐risk versus protective alleles for TREK1 SNPs were more likely to carry particular DAT1 or COMT alleles (Supp. Info. Tables III–VI), and between‐group differences in basal ganglia gain responses were identified for three TREK1 alleles but not for DAT1 or COMT genotypes. Nonetheless, we performed a third control analysis examining whether TREK1 and DAT1/COMT made separable contributions to basal ganglia reward responses. Dreher et al. [2009] reported a DAT1/COMT interaction such that 9‐R met/met individuals showed the strongest responses to reward‐predicting cues in the ventral striatum and lateral PFC, and to actual rewards in the midbrain, lateral prefrontal cortex, and OFC. In light of these results, for each participant we coded each DAT1 allele (10 or 11 = 0, 9 = 1) and COMT allele (val = 0, met = 1) and summed them, yielding a continuous DAT1/COMT score (possible range: 0–4; actual range: 0–3; mean ± SD = 1.34 ± 0.90). Next, the continuous measure of DAT1/COMT genotype, the TREK1 protective allele count, and the MASQ AD subscale were entered into a simultaneous regression predicting responses to gains minus no change feedback, averaged across the basal ganglia. The overall model was significant, F(3, 24) = 9.39, P < 0.001, R 2 = 0.54. Importantly, TREK1 protective allele count (beta = 0.456, P = 0.005), DAT1/COMT total score (beta = 0.315, P = 0.042), and MASQ AD scores (beta = −0.339, P = 0.025) were all significant predictors. The positive association between the DAT1/COMT score and basal ganglia response to gains (versus no change feedback) is consistent with the results reported by Dreher et al. [2009]. Importantly, however, when considered along with the non‐significant chi‐square results reported in Supporting Information Tables III–VI, the fact that both the TREK1 and DAT1/COMT continuous measures were significant predictors suggests that these genotypes make unique contributions to basal ganglia reward responses (see Supp. Info. Results for a DAT1/COMT analysis using a different approach).
Whole‐brain regression with protective allele count
In a hypothesis‐generating analysis, we regressed TREK1 protective allele count (rs10494996, rs2841608, rs2841616) against whole‐brain activity for the gain minus no change feedback contrast. The regression revealed several regions previously implicated in reward processing, including the caudate, putamen, dACC, and OFC (Fig. 3; P < 0.001, 12 voxel cluster extent threshold). A 10‐voxel cluster was also significant at P < 0.001 in the mesial PFC (Fig. 3d); the most significant voxel localized to the insula (Fig. 3f). A complete list is provided in Table II.
Figure 3.
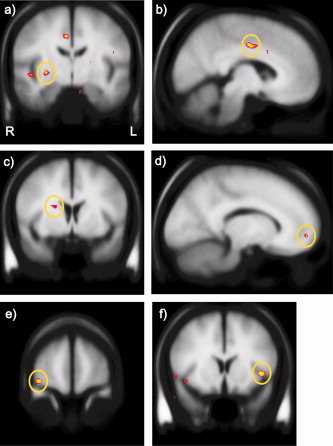
Neural regions emerging from the regression of protective allele count with whole‐brain responses to gains versus no change feedback. Depicted are the (a) right putamen, (b) dACC, (c) right dorsal caudate, (d) mesial PFC, (e) right lateral OFC, and (f) left insula. Images are thresholded at P = 0.001. Additional regions emerging from this analysis are listed in Table II. [Color figure can be viewed in the online issue, which is available at www.interscience.wiley.com.]
Table II.
Results of whole‐brain analyses regressing protective allele count against neural response to gains (minus no change feedback)
| Location of peak voxel | x | y | z | Volume (mm3) | Peak voxel P‐value |
|---|---|---|---|---|---|
| R putamen | 30 | −11 | 0 | 152 | 3.90 × 10⁻⁵ |
| R caudate | 20 | 6 | 15 | 104 | 3.55 × 10⁻⁴ |
| R dorsal anterior cingulate cortex | 6 | −7 | 36 | 344 | 4.30 × 10⁻⁵ |
| L isthmus of cingulate | −8 | −53 | 11 | 104 | 3.50 × 10⁻⁵ |
| R lateral orbital gyrus | 36 | 55 | −10 | 272 | 3.00 × 10⁻⁵ |
| L mesial prefrontal cortexa | −12 | 53 | −7 | 80 | 8.10 × 10⁻⁵ |
| L insula | −40 | 13 | 0 | 216 | 7.00 × 10⁻⁶ |
| L precentral gyrus | −46 | −6 | 20 | 96 | 6.30 × 10⁻⁵ |
| R superior temporal gyrus | 61 | −6 | 7 | 176 | 3.10 × 10⁻⁵ |
| 46 | −9 | −2 | 464 | 5.40 × 10⁻⁵ | |
| R inferior parietal lobule | 59 | −25 | 26 | 112 | 7.20 × 10⁻⁵ |
Note. L = left, R = right. Coordinates are in Talairach space.
Did not meet the extent threshold of 12 voxels (10 voxel cluster).
Finally, to cross‐validate the different analytic approaches, Pearson correlations examined the relationship between TREK1 protective allele count and mean basal ganglia responses to gains, penalties, and no change feedback. The correlation with gain responses was significant (r = 0.55, P = 0.001; Fig. 4), but correlations with responses to penalties (r = 0.04, P = 0.82) and no change feedback (r = 0.02, P = 0.94) were not. Critically, the correlation between TREK1 protective allele count and responses to gains was significantly higher than correlations with penalties (z = 2.41, P = 0.008) or no‐change feedback (z = 2.55, P = 0.005) [Meng et al.,1992].
Figure 4.
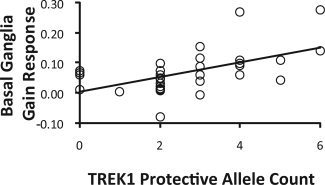
Correlation between protective allele count and mean basal ganglia response to gains (r = 0.55, P = 0.001).
Basal Ganglia Morphometry
TREK1 Genotype × Hemisphere × Structure ANOVAs revealed no significant effects or interactions involving Genotype (all P > 0.05). Accordingly, functional differences in basal ganglia activation were not confounded with group differences in volumes.
DISCUSSION
This study yielded two primary findings. First, individuals possessing rs10494996, rs2841608, and rs2841616 TREK1 genotypes previously linked to better antidepressant response [Perlis et al.,2008b] showed stronger basal ganglia responses to gains relative to individuals in the at‐risk groups. Second, a whole‐brain regression revealed that a greater number of protective alleles across these SNPs was positively correlated with neural responses to gains in several regions of the reward network, including the right caudate and right putamen but extending to the mesial PFC, OFC, and dACC. There was no evidence that TREK1 genotype was associated with demographic variables, basal ganglia volume, or behavioral performance (i.e., RT) on reward trials, and minimal evidence for association with affective ratings in response to reward cues or gains. Furthermore, there was little evidence that TREK1 genetic variation influenced self‐reported mood or neural responses to incentive cues, although the at‐risk group for rs10494996 reported significantly higher anhedonic symptoms relative to protected participants. Importantly, control analyses conducted for this SNP revealed that group differences in basal ganglia gain responses remained after adjusting for anhedonic symptoms, indicating that genotype predicted unique variance in neural activity. Finally, additional analyses indicated that TREK1 and DAT1/COMT made independent contributions to basal ganglia gain responses, ruling out a possible genetic confound. In summary, variations in TREK1 SNPs were selectively associated with neural responses to gains in this psychiatrically healthy sample.
Relevance to Depression
Although the sample was healthy, the focus on the TREK1 gene and reward processing highlights the study's relevance to depression. The initial report relating variations in TREK1 to antidepressant response [Perlis et al.,2008b] was motivated by the fact that approximately 50% of depressed individuals fail to respond to any single treatment, and many individuals fail to respond to any treatment [Hollon et al.,2002]. In addition to the problems associated with lingering depressive systems, cycling through multiple treatments in search of an adequate match is onerous for individuals and society. To address this problem, Perlis et al. [2008b] investigated whether four genes were related to antidepressant response in a large sample of MDD outpatients. Of the genes tested (TREK1, VMAT2, S100A10, and HDAC5), only TREK1 polymorphisms were associated with antidepressant response. However, the mechanism underlying this effect was not studied.
The current results suggest that certain TREK1 genotypes may promote remission from depression via their association with potentiated neural responses to gains, consistent with a hypothesis raised in a recent animal study [Heurteaux et al.,2006]. Individuals with protective genotypes for three SNPs showed significantly stronger basal ganglia responses to reward than individuals with at‐risk genotypes. Notably, this result was specific to rewards and did not extend to penalty or no‐change feedback. Furthermore, the key finding was obtained using two different analytical techniques (basal ganglia ROI analyses and whole‐brain regressions) and was not confounded by behavioral or morphometrical differences. Also, the health of the sample implies that the findings were not influenced by possible confounding variables often present in studies with clinical samples (e.g., state‐related mood effects, medication).
However, the composition of the sample also means that the relevance of these findings to depression must be considered tentative. This study establishes that genetic variation in TREK1 is associated with individual differences in neural response to reward; a critical next step will be to determine whether or not these differences mediate antidepressant response, as hypothesized. In addition, it would be valuable to follow individuals with variations in the TREK1 gene prospectively, as TREK1 SNPs may be linked to resilience in the face of stressors via their association with reward responses [Charney,2004].
Mechanism of TREK1 Effects
This study found that protective SNPs affected responses to gains more strongly than responses to reward‐predicting cues, but this result may reflect the particular paradigm used rather than any property of TREK1. The task used a balanced design in which gains were presented on 50% of reward trials, reducing the predictive value of the reward cue relative to designs in which gains are delivered more frequently [Knutson et al.,2003]. This reduction in predictive value, along with the concomitant increase in the unpredictability of gains [Delgado,2007], may have amplified neural responses to gains and weakened responses to cues, irrespective of TREK1 genotype.
The effects of TREK1 genotypes on reward were not restricted to a single neural region (see Fig. 3). Our analyses focused on the basal ganglia because it is critically implicated in reward processing and expresses TREK1 strongly across various species [Hervieu et al.,2001; Medhurst et al.,2001; Talley et al.,2001]. However, the exploratory whole‐brain regression analysis revealed effects in other regions within the mesocorticolimbic reward network. Individuals with more protective alleles showed greater responses to gains in the mesial PFC, a region implicated in processing rewarding outcomes [Knutson et al.,2003]. In addition, possession of protective alleles covaried with the strength of gain responses in the OFC, which is thought to code flexible representations of stimulus value [Holland and Gallagher,2004; O'Doherty,2004], and the dACC, a region critical for using reward history to guide adaptive action selection [Rushworth et al.,2007; Santesso et al.,2008].
It is not clear whether these findings reflect differences in TREK1 channels distributed throughout the brain or are instead an upstream consequence of variations in TREK1 in a more focal, downstream location (e.g., the midbrain). Also, initial animal work suggested that the antidepressant phenotype displayed by TREK1 knockouts was a consequence of increased firing rate of serotonergic neurons with cell bodies in the dorsal raphe nucleus [Gordon and Hen,2006; Heurteaux et al.,2006]. The link between this mechanism and the present findings is currently unclear.
Strengths, Limitations, and Future Directions
The current study features several strengths, notably the integration of genotyping and neuroimaging, the clear relevance of reward processing to depression, and the exploration of a gene (TREK1) that holds promise for improving prediction of antidepressant response. However, several limitations should be acknowledged. First, the study is limited by the fact that the sample size, while relatively large for a neuroimaging experiment, was somewhat small for genetic analyses and included only healthy participants. Future studies testing larger samples including both depressed and healthy individuals are needed. Additionally, given variable allele frequencies according to area of ancestral origin, further studies with large and ethnically diverse samples are needed to fully address potential population stratification concerns.
Second, the analyses reported here were focused on possible effects of TREK1 and were not designed to comprehensively analyze the influence of other genotypes that may influence reward processing. In particular, the analyses involving DAT1 and COMT genotypes were conducted primarily as follow‐ups to significant TREK1 results in an attempt to determine whether findings could be better explained in terms of DAT1 and/or COMT. The results of the independent analysis of DAT1 and COMT genotypes were partly consistent with the prior findings of Forbes et al. [2009], who examined ventral striatal reward responses and also found no effect of COMT genotype but reported a significantly stronger response in DAT1 9‐R carriers versus 10‐R homozygotes. There are several differences between the present study and the work of Forbes et al. [2009] that might account for the difference in DAT1 effects, including the fact that Forbes and colleagues tested a much larger sample (n = 89) and used a blocked design, which likely yielded substantially increased power to detect this type of effect. Notably, when DAT1/COMT and TREK1 genotypes were considered together in a regression model following Dreher et al. [2009], we found that possession of an increasing number of (1) DAT1 9‐R and COMT met alleles and (2) protective TREK1 alleles were both associated with a stronger basal ganglia response to gains. Accordingly, results should be interpreted as providing preliminary support for dissociable effects of TREK1 and DAT1/COMT on reward processing.
Third, because of the small sample size and the exploratory nature of this study, which is the first to investigate TREK1 genetic variations and reward processing in humans, a relatively large number of statistical tests were conducted and some results would not survive correction for multiple comparisons. Nonetheless, this study demonstrates a neural mechanism by which TREK1 may contribute to antidepressant response‐namely, three protective alleles of TREK1 SNPs are associated with strong basal ganglia responses to rewards. This finding will permit more targeted approaches in future studies.
Supporting information
Additional Supporting Information may be found in the online version of this article.
Supporting Information
Supporting Figure 1
Acknowledgements
We are grateful to Jeffrey Birk, Decklin Foster, Elena Goetz, James O'Shea, and Kyle Ratner for their skilled assistance with this study; to Drs. Lawrence L. Wald and Christopher Wiggins for their help implementing the optimized fMRI pulse sequence; to Dr. Douglas N. Greve for his expert assistance with the FS‐FAST and FreeSurfer packages; and to Priya Moorjani, Brian Galloway, Sara Rubenstein, Miles Nugent, and Boyd Gunnell for their skilled assistance with genetic analyses.
REFERENCES
- American Psychiatric Association ( 2000): Diagnostic and Statistical Manual of Mental Disorders, 4th ed. Washington, DC: American Psychiatric Association. [Google Scholar]
- Barrett JC, Fry B, Maller J, Daly MJ ( 2005): Haploview: Analysis and visualization of LD and haplotype maps. Bioinformatics 21: 263–265. [DOI] [PubMed] [Google Scholar]
- Beck AT, Steer RA, Brown GK ( 1996): Manual for the Beck Depression Inventory‐II. San Antonio, TX: Psychological Corporation. [Google Scholar]
- Bilder RM, Volavka J, Lachman HM, Grace AA ( 2004): The catechol‐O‐methyltransferase polymorphism: Relations to the tonic‐phasic dopamine hypothesis and neuropsychiatric phenotypes. Neuropsychopharmacology 29: 1943–1961. [DOI] [PubMed] [Google Scholar]
- Brett M, Christoff K, Cusack R, Lancaster J ( 2001): Using the Talairach atlas with the MNI template. NeuroImage 13: S85. [Google Scholar]
- Cassano P, Fava M ( 2002): Depression and public health: An overview. J Psychosom Res 53: 849–857. [DOI] [PubMed] [Google Scholar]
- Chapman LJ, Chapman JP ( 1987): The measurement of handedness. Brain Cogn 6: 175–183. [DOI] [PubMed] [Google Scholar]
- Charney DS ( 2004): Psychobiological mechanisms of resilience and vulnerability: Implications for successful adaptation to extreme stress. Am J Psychiatry 161: 195–216. [DOI] [PubMed] [Google Scholar]
- Ciliax BJ, Drash GW, Staley JK, Haber S, Mobley CJ, Miller GW, Mufson EJ, Mash DC, Levey AI ( 1999): Immunocytochemical localization of the dopamine transporter in human brain. J Comp Neurol 409: 38–56. [DOI] [PubMed] [Google Scholar]
- de Bakker PI, Yelensky R, Pe'er I, Gabriel SB, Daly MJ, Altshuler D ( 2005): Efficiency and power in genetic association studies. Nat Genet 37: 1217–1223. [DOI] [PubMed] [Google Scholar]
- Deichmann R, Gottfried JA, Hutton C, Turner R ( 2003): Optimized EPI for fMRI studies of the orbitofrontal cortex. NeuroImage 19: 430–441. [DOI] [PubMed] [Google Scholar]
- Delgado MR ( 2007): Reward‐related responses in the human striatum. Ann NY Acad Sci 1104: 70–88. [DOI] [PubMed] [Google Scholar]
- Desikan RS, Ségonne F, Fischl B, Quinn BT, Dickerson BC, Blacker D, Buckner RL, Dale AM, Maguire RP, Hyman BT, Albert MS, Killiany RJ ( 2006): An automated labeling system for subdividing the human cerebral cortex on MRI scans into gyral based regions of interest. NeuroImage 31: 968–980. [DOI] [PubMed] [Google Scholar]
- Dillon DG, Holmes AJ, Jahn AL, Bogdan R, Wald LL, Pizzagalli DA ( 2008): Dissociation of neural regions associated with anticipatory versus consummatory phases of incentive processing. Psychophysiology 45: 36–49. [DOI] [PMC free article] [PubMed] [Google Scholar]
- Dreher JC, Kohn P, Kolachana B, Weinberger DR, Berman KF ( 2009): Variation in dopamine genes influences responsivity of the human reward system. Proc Natl Acad Sci USA 106: 617–622. [DOI] [PMC free article] [PubMed] [Google Scholar]
- First MB, Spitzer RL, Gibbon M, Williams JBW ( 1995): Structured Clinical Interviews for DSM‐IV Axis I Disorders (SCID). Washington, DC: American Psychiatric Press. [Google Scholar]
- Fischl B, Salat DH, Busa E, Albert M, Dieterich M, Haselgrove C, van der Kouwe A, Killiany R, Kennedy D, Klaveness S, Montillo A, Makris N, Rosen B, Dale AM ( 2002): Whole brain segmentation: automated labeling of neuroanatomical structures in the human brain. Neuron 33: 341–355. [DOI] [PubMed] [Google Scholar]
- Fischl B, van der Kouwe, Destrieux C, Halgren E, Ségonne F, Salat DH, Busa E, Seidman LJ, Goldstein J, Kennedy D, Caviness V, Makris N, Rosen B, Dale AM ( 2004): Automatically parcellating the human cerebral cortex. Cereb Cortex 14: 11–22. [DOI] [PubMed] [Google Scholar]
- Forbes EE, Brown SM, Kimak M, Ferrell RE, Manuck SB, Hariri AR ( 2009): Genetic variation in components of dopamine neurotransmission impacts ventral striatal reactivity associated with impulsivity. Mol Psychiatry 14: 60–70. [DOI] [PMC free article] [PubMed] [Google Scholar]
- Gordon JA, Hen R ( 2006): TREKing toward new antidepressants. Nat Neurosci 9: 1081–1083. [DOI] [PubMed] [Google Scholar]
- Hariri AR, Weinberger DR ( 2003): Imaging genomics. Br Med Bull 65: 259–270. [DOI] [PubMed] [Google Scholar]
- Hasler G, Drevets WC, Manji HK, Charney DS ( 2004): Discovering endophenotypes for major depression. Neuropsychopharmacology 29: 1765–1781. [DOI] [PubMed] [Google Scholar]
- Hervieu GJ, Cluderay JE, Gray CW, Green PJ, Ranson JL, Randall AD, Meadows HJ ( 2001): Distribution and expression of TREK‐1, a two‐pore‐domain potassium channel, in the adult rat CNS. Neuroscience 103: 899–919. [DOI] [PubMed] [Google Scholar]
- Heurteaux C, Lucas G, Guy N, El Yacoubi M, Thümmler S, Peng XD, Noble F, Blondeau N, Widmann C, Borsotto M, Gobbi G, Vaugeois JM, Debonnel G, Lazdunski M ( 2006): Deletion of the background potassium channel TREK‐1 results in a depression‐resistant phenotype. Nat Neurosci 9: 1134–1141. [DOI] [PubMed] [Google Scholar]
- Holland PC, Gallagher M ( 2004): Amygdala‐frontal interactions and reward expectancy. Curr Opin Neurobiol 14: 148–155. [DOI] [PubMed] [Google Scholar]
- Hollon SD, Thase ME, Markowitz JC ( 2002): Treatment and prevention of depression. Psychol Sci Public Interest 3: 39–77. [DOI] [PubMed] [Google Scholar]
- Honore' E ( 2007): The neuronal background K2P channels: Focus on TREK1. Nat Rev Neurosci 8: 251–261. [DOI] [PubMed] [Google Scholar]
- Kahneman D, Tversky A ( 1979): Prospect theory: An analysis of decision under risk. Econometrica 47: 263–291. [Google Scholar]
- Knutson B, Adams CM, Fong GW, Hommer D ( 2001): Anticipation of increasing monetary reward selectively recruits nucleus accumbens. J Neurosci 21: RC159. [DOI] [PMC free article] [PubMed] [Google Scholar]
- Knutson B, Fong GW, Bennett SM, Adams CM, Hommer D ( 2003): A region of mesial prefrontal cortex tracks monetarily rewarding outcomes: Characterization with rapid event‐related fMRI. NeuroImage 18: 263–272. [DOI] [PubMed] [Google Scholar]
- Matsumoto M, Weickert CS, Akil M, Lipska BK, Hyde TM, Herman MM, Kleinman JE, Weinberger DR ( 2003): Catechol‐O‐methyltransferase mRNA expression in human and rat brain: Evidence for a role in cortical neuronal function. Neuroscience 116: 127–137. [DOI] [PubMed] [Google Scholar]
- McFarland BR, Shankman SA, Tenke CE, Bruder GE, Klein DN ( 2006): Behavioral activation system deficits predict the six‐month course of depression. J Affect Disord 91: 229–234. [DOI] [PubMed] [Google Scholar]
- Medhurst AD, Rennie G, Chapman CG, Meadows H, Duckworth MD, Kelsell RE, Gloger II, Pangalos MN ( 2001): Distribution analysis of human two pore domain potassium channels in tissues of the central nervous system and periphery. Brain Res Mol Brain Res 86: 101–114. [DOI] [PubMed] [Google Scholar]
- Meng X, Rosenthal R, Rubin DB ( 1992): Comparing correlated correlation coefficients. Psychol Bull 111: 172–175. [Google Scholar]
- Moos RH, Cronkite RC ( 1999): Symptom‐based predictors of a 10‐year chronic course of treated depression. J Nerv Ment Dis 187: 360–368. [DOI] [PubMed] [Google Scholar]
- O'Doherty JP ( 2004): Reward representations and reward‐related learning in the human brain: Insights from neuroimaging. Curr Opin Neurobiol 14: 769–776. [DOI] [PubMed] [Google Scholar]
- Perlis RH, Holt DJ, Smoller JW, Blood AJ, Lee S, Kim BW, Lee MJ, Sun M, Makris N, Kennedy DK, Rooney K, Dougherty DD, Hoge R, Rosenbaum JF, Fava M, Gusella J, Gasic GP, Breiter HC; Phenotype Genotype Project on Addiction and Mood Disorders ( 2008a): Association of a polymorphism near CREB1 with differential aversion processing in the insula of healthy participants. Arch Gen Psychiatry 65: 882–892. [DOI] [PMC free article] [PubMed] [Google Scholar]
- Perlis RH, Moorjani P, Fagerness J, Purcell S, Trivedi MH, Fava M, Rush AJ, Smoller JW ( 2008b): Pharmacogenetic analysis of genes implicated in rodent models of antidepressant response: Association of TREK1 and treatment resistance in the STAR*D study. Neuropsychopharmacology 33: 2810–2819. [DOI] [PMC free article] [PubMed] [Google Scholar]
- Pizzagalli DA, Holmes AJ, Dillon DG, Goetz EL, Birk JL, Bogdan R, Dougherty DD, Iosifescu DV, Rauch SL, Fava M ( 2009): Reduced caudate and nucleus accumbens response to rewards in unmedicated subjects with major depressive disorder. Am J Psychiatry 166: 702–710. [DOI] [PMC free article] [PubMed] [Google Scholar]
- Rushworth MF, Behrens TE, Rudebeck PH, Walton ME ( 2007): Contrasting roles for cingulate and orbitofrontal cortex in decisions and social behaviour. Trends Cogn Sci 11: 168–176. [DOI] [PubMed] [Google Scholar]
- Santesso DL, Dillon DG, Birk JL, Holmes AJ, Goetz E, Bogdan R, Pizzagalli DA ( 2008): Individual differences in reinforcement learning: Behavioral, electrophysiological, and neuroimaging correlates. NeuroImage 42: 807–816. [DOI] [PMC free article] [PubMed] [Google Scholar]
- Spielberger CD, Gorsuch RL, Lushere RE ( 1970): Manual of the State‐Trait Anxiety Inventory. Palo Alto, CA: Consulting Psychologists Press. [Google Scholar]
- Spijker J, Bijl RV, de Graaf R, Nolen WA ( 2001): Determinants of poor 1‐year outcome of DSM‐III‐R major depression in the general population: Results of the Netherlands Mental Health Survey and Incidence Study (NEMESIS). Acta Psychiatr Scand 103: 122–130. [DOI] [PubMed] [Google Scholar]
- Talley EM, Solo'rzano G, Lei Q, Kim D, Bayliss DA ( 2001): CNS distribution of members of the two‐pore‐domain (KCNK) potassium channel family. J Neurosci 21: 7491–7505. [DOI] [PMC free article] [PubMed] [Google Scholar]
- Tsai SJ ( 2008): Sipatrigine could have therapeutic potential for major depression and bipolar depression through antagonism of the two‐pore‐domain K+ channel TREK‐1. Med Hypotheses 70: 548–550. [DOI] [PubMed] [Google Scholar]
- Tsankova NM, Berton O, Renthal W, Kumar A, Neve RL, Nestler EJ ( 2006): Sustained hippocampal chromatin regulation in a mouse model of depression and antidepressant action. Nat Neurosci 9: 519–525. [DOI] [PubMed] [Google Scholar]
- Vandenbergh DJ, Persico AM, Hawkins AL, Griffin CA, Li X, Jabs EW, Uhl GR ( 1992): Human dopamine transporter gene (DAT1) maps to chromosome 5p15.3 and displays a VNTR. Genomics 14: 1104–1106. [DOI] [PubMed] [Google Scholar]
- VanNess SH, Owens MJ, Kilts CD ( 2005): The variable number of tandem repeats element in DAT1 regulates in vitro dopamine transporter density. BMC Genetics 6: 55–65. [DOI] [PMC free article] [PubMed] [Google Scholar]
- Wacker J, Dillon DG, Pizzagalli DA ( 2009): The role of the nucleus accumbens and rostral anterior cingulate cortex in anhedonia: Integration of resting EEG, fMRI, and volumetric techniques. NeuroImage 46: 327–337. [DOI] [PMC free article] [PubMed] [Google Scholar]
- Wager TD, Nichols TE ( 2003): Optimization of experimental design in fMRI: A general framework using a genetic algorithm. NeuroImage 18: 293–309. [DOI] [PubMed] [Google Scholar]
- Watson D, Clark LA, Tellegen A ( 1988): Development and validation of brief measures of positive and negative affect: The PANAS scales. J Pers Soc Psychol 54: 1063–1070. [DOI] [PubMed] [Google Scholar]
- Watson D, Weber K, Assenheimer JS, Clark LA, Strauss ME, McCormick RA ( 1995): Testing a tripartite model. I. Evaluating the convergent and discriminant validity of anxiety and depression symptom scales. J Abnorm Psychol 104: 3–14. [DOI] [PubMed] [Google Scholar]
- Weinshilboum RM, Otterness DM, Szumlanski CL ( 1999): Methylation pharmacogenetics: Catechol O‐methyltransferase, thiopurine methyltransferase, and histamine N‐methyltransferase. Annu Rev Pharmacol Toxicol 39: 19–52. [DOI] [PubMed] [Google Scholar]
- Worsley KJ, Friston KJ ( 1995): Analysis of fMRI time‐series revisited‐again. NeuroImage 2: 173–181. [DOI] [PubMed] [Google Scholar]
- Yacubian J, Sommer T, Schroeder K, Gläscher J, Kalisch R, Leuenberger B, Braus DF, Büchel C ( 2007): Gene–gene interaction associated with neural reward sensitivity. Proc Natl Acad Sci USA 104: 8125–8130. [DOI] [PMC free article] [PubMed] [Google Scholar]
Associated Data
This section collects any data citations, data availability statements, or supplementary materials included in this article.
Supplementary Materials
Additional Supporting Information may be found in the online version of this article.
Supporting Information
Supporting Figure 1