

Abstract
Epithelial ovarian cancer (EOC) ranks fifth as a cause of cancer deaths in women. Current diagnostic and monitoring markers have limited reliability for the detection of disease. We have tested the possibility of identifying candidate biomarkers present at low nanogram to picogram levels after removing both the 12 most abundant and 77 moderately abundant proteins from serum samples of EOC patients using antibody affinity columns. We showed that this approach allows the identification of proteins that are expressed at nanogram per liter levels in the serum. Using ICAT/MS/MS analysis, we identified 51 proteins that are differentially expressed by at least twofold. These proteins include leucine-rich α-2-glycoprotein, matrix metalloproteinase-9 (MMP-9), inter-α-trypsin inhibitor heavy chain H1, insulin-like growth factor-binding protein 6, insulin-like growth factor-binding protein 3, isoform 1 of epidermal growth factor receptor, angiopoietin-like protein 3 (ANGPTL3) and phosphatidylcholine-sterol acyltransferase. We confirmed the differential expression of MMP9 and ANGPTL3 in normal and ovarian cancer sera by ELISA assays. Further robust clinical evaluation of the candidate markers identified is necessary.
Keywords: Angiopoietin-like protein 3, Matrix metalloproteinase-9, MS, Ovarian cancer, Serum depletion
1 Introduction
Epithelial ovarian cancer (EOC) ranks fifth as a cause of cancer deaths in women. The American Cancer Society estimates that there will be about 21 650 new cases of ovarian cancer in 2008, and about 15 520 deaths due to this disease (www.cancer.org). The high mortality rate of EOC occurs primarily because most women are not diagnosed until late stage or advanced disease (stage III/IV), which has a 5-year survival rate of 15–20% [1]. In contrast, the small proportion of patients with accurately diagnosed stage I disease has 5-year survival rates in excess of 90% [2]. Current candidate strategies for the detection of EOC are based on the biochemical tumor markers, such as CA125, and biophysical markers assessed by ultrasound and/or Doppler imaging of the ovaries. Unfortunately, the positive predictive values of these strategies for the detection of EOC using these modalities have been consistently less than 10% [3, 4]. Attempts to improve the performance characteristics of these detection strategies in EOC have met with only limited success. These include the utilization of complex longitudinal algorithms for assessing the changing levels of CA125 [5–7], the sequential testing of CA125 [8, 9], and the validation of newer markers [10]. Therefore, there still exists an urgent need to develop novel circulating biomarker(s) for the detection of ovarian cancer.
High-throughput MS-based proteomics is an excellent tool in identifying putative biomarker candidates. The logic is to identify blood proteins that change in level during the transition from health to ovarian cancer – and presumably then change continuously during the progression of ovarian cancer. Recently, spectrometry-based proteomics has been widely used in ovarian cancer studies including attempts to discover candidate diagnostic markers and candidate therapy-response markers [11–16]. Proteomic analysis identified many candidate biomarkers for ovarian cancer including afamin [17], tumor susceptibility gene 101 [16], NM23, annexin-1, protein phosphatase-1, ferritin light chain, proteasome α-6, N-acetyl glucosamine kinase [18], isoforms of haptoglobin [19], apolipoprotein A1, a truncated form of transthyretin, a cleavage fragment of inter-α-trypsin inhibitor heavy chain H4 [20], FK506 binding protein, Rho G-protein dissociation inhibitor and glyoxalase I [21]. All of these exhibited the changes in levels of blood protein concentration described above. However, not many of these have been validated because of the lengthy time required to develop an ELISA assay.
The challenge in direct serum analysis is that the proteins in sera have a dynamic range of 1010–1012 [22] – from milligrams per milliliter (e.g. albumin) to picograms per milliliter (e.g. for some interleukins). One approach to deal with this dynamic range is to remove abundant proteins from sera. However, as MS only has a dynamic range of 104–105, even when the abundant proteins (those present at milligram per milliliter levels) are removed, the next layer of moderately abundant proteins (those present at microgram per milliliter level) can still mask the discovery of biomarkers, usually in the low nanogram or picogram levels. Recently, Qian et al [23]. showed that the application of GenWay's SuperMix system in tandem with the IgY12 immuno-depletion system resulted in enhanced detection of low-abundant proteins. They also demonstrated the reproducibility of the SuperMix partitioning method for LC-MS/MS plasma proteome profiling [23]. In the present study, we tested the possibility of identifying candidate biomarkers present at low nanogram to picogram levels using the same approach from serum samples of EOC patients. We showed that this approach allowed the identification of proteins expressed at nanogram per milliliter levels in the serum. We identified many candidate biomarkers including leucine-rich α-2-glycoprotein (LRG1), matrix metalloproteinase-9 (MMP-9), inter-α-trypsin inhibitor heavy chain H1, insulin-like growth factor-binding protein 6 (IGFBP6), IGFBP3, isoform 1 of epidermal growth factor receptor, angiopoietin-like protein 3 (ANGPTL3), phosphatidylcholine-sterol acyltransferase and many other novel and uncharacterized proteins such as IPI00026482 (10 kDa protein), IPI00374218 (hypothetical protein), IPI00784458 (312 kDa protein) and IPI00030385 (CDNA FLJ13813). We further confirmed the differential expression of MMP9 and ANGPTL3 in sera of ovarian cancer patients. These two markers can be further evaluated in a large cohort of clinical samples and potentially added to a panel of biomarkers for ovarian cancer diagnosis and prognosis.
2 Materials and methods
2.1 Sample preparation
Pre-operative serum samples of patients undergoing surgery for stage IIIc EOC at the Roswell Park Cancer Institute (RPCI) were collected under an approved IRB protocol. For controls, the sera of age-matched (range 34–82) healthy women were also collected. Within 2 h of collection of blood by venipuncture, the sera were separated by centrifugation, and aliquots were stored at −80°C until assayed. For ICAT/ MS/MS analysis, 250 μL of pooled cancer serum (N=10) and normal serum (N=10), respectively, were passed through GenWay Biotech's Seppro microbeads IgY12 column which removed the 12 most abundant proteins, according to the manufacturer's protocols. The eluted fractions from the IgY12 column were then passed through a GenWay's SuperMix column, which removed the next layer of about 77 moderately abundant proteins from the serum samples. The flow-through fractions were subjected to further ICAT/MS/MS analysis (Fig. 1).
Figure 1.
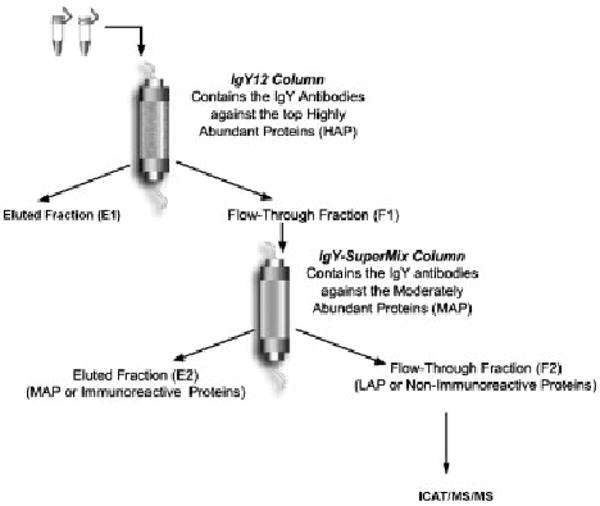
Flow chart of our analysis approach.
2.2 ICAT labeling and μLC-MS/MS analysis
For ICAT labeling, 600 μg of each from the IgY SuperMix flow through fractions from ovarian cancer pool and normal control pool were denatured with 6 M urea and 0.05% SDS and immediately reduced with 5 mM tributylphosphine. Each of the three samples was labeled with second generation ICAT reagents (acid cleavable), either in light (12C, for normal) or in heavy (13C for cancer) isotopes (Applied Biosystems, Foster City, CA, USA). Equal amounts of the two-labeled samples were combined and digested into peptides by trypsin (Promega, Madison, WI, USA). ICAT-labeled peptides were subsequently purified by cation-exchange chromatography and avidin-affinity chromatography. Peptide mixtures were analyzed by microcapillary HPLC-ESI-MS/MS using an ion-trap mass spectrometer (LTQ) (ThermoElectron) as described previously [12].
2.3 MS data analysis
The extract_msn of the BioWorks program V3.2 (Thermo Electron, Waltham, MA, USA) was used to generate the MS peak list with the default parameters. The ICIS peak-detection algorithm was used. The spectra were searched against the ipi.HUMAN.v3.24.fasta protein database (with 570, 664 entries) (http://www.ebi.ac.uk/IPI/IPIhuman.html) using the BioWorks program V3.2 (Thermo Electron). In the SEQUEST search parameter setting, the threshold for Dta generation was 10 000, and precursor mass tolerance for Dta generation was 1.4. For the SEQUEST search, peptide tolerance was set at 3 Da and fragment ions tolerance was set at 0 Da. PeptideProphetTM [24] was used to assess the MS/MS spectra quality and a threshold score for accepting individual MS/MS spectra is set at p value of 0.5, which corresponds to a 0.5% error rate in our data set. One missed tryptic cleavage was permitted. A static modification of cysteine residues of 227 Da for the light cleavable ICAT reagent labeling and a variable modification of 9 Da for cysteines for the heavy cleavable ICAT reagent labeling was included. No other modifications were included in the search parameters.
The peptides were then assigned and grouped for protein identification using the ProteinProphet software [25]. Proteins with ProteinProphet [25] p-Value greater than 0.5 and with more than two unique peptide hits were considered as true hits. In order to calculate false discovery rate (FDR), a decoy database was generated using the perl script downloaded from www.matrixscience.com/downloads/decoy.pl.gz. FDRs were calculated according to the method of Elias et al. [26] with the formula: two times the decoy hits divided by the sum of the target and decoy hits.
We used automated statistical analysis of protein abundance ratios (ASAPRatio) [27] program to calculate the ICAT ratios, and we normalized the ratios to the median of the two samples. The proteins with at least two unique peptides hits and that showed a ratio of at least twofold (normalized ASAPRatio) were considered differentially expressed.
2.4 ELISA analysis
The Quantikine MMP-9 Immunoassay kit from R & D Systems (cat # DMP900) was used. This ELISA kit is designed to measure total MMP-9 (92 kDa pro- and 82 kDa active forms) in serum samples. The ANGPTL3 ELISA kit from Immuno-Biological Laboratories was used. The ELISA analysis was performed according to manufacturer's protocols.
3 Results
3.1 Identification of proteins in the low-abundant fractions of ovarian cancer serum
We applied a tandem serum depletion approach with IgY12 and SuperMix columns (Genway Biotech) coupled with LC-MS/MS for the analysis of 250 μL of pooled cancer serum (N=10) and normal serum (N=10). Using a filter of p>0.9 for the PeptideProphet program, we obtained a total of 7728 good spectra for 2692 unique peptides. Using p>0.9 for ProteinProphet, which corresponds to an error rate of 0.5%, we obtained 252 entries. The FDR for proteins identified with a ProteinProphet p>0.9, as calculated by the decoy database search, was estimated to be 1.30%. After removing 24 protein entries with single peptide hit, and various entries corresponding to IgG isoforms, we obtained a final list of 222 proteins (Supporting Information Table 1). Supporting Information Table 1 provides the accession number of the proteins, the number of unique (in terms of amino acid sequence) peptides and total peptides identified, percent sequence coverage identified from MS/MS data and the list of peptide sequences identified. The number of peptide identified in Supporting Information Table 1 can provide a general estimate on the relative abundance of proteins identified in sera. However, it is only semi-quantitative as other factors will also affect the numbers of peptide identified for a particular protein.
We compared the number of proteins identified from LC/MS/MS with the same serum pools after passing only the IgY12 depletion column. Using p>0.9 for ProteinProphet, which corresponds to an error rate of 0.8%, we obtained 87 entries. After removing entries corresponding to various isoforms of IgG, we obtained a list of 71 proteins. Therefore, depletion of serum with the tandem IgY12 and the SuperMix columns allowed us to detect about three times (222 versus 71) more proteins than depletion with the IgY12 column alone. Among the 71 proteins identified here, 49 (69%) of them could also be identified by depletion with the tandem IgY12 and the Super-Mix columns (Supporting Information Table 3). Twenty-two proteins were identified uniquely with the IgY12 depletion alone. For the 222 proteins that were identified after the tandem IgY12 and the SuperMix depletion, 173 (78%) are new proteins that were not identified after the IgY12 depletion, suggesting that the tandem serum depletion approach significantly improved our ability to detect low-abundant proteins. The two putative biomarker candidates MMP9 and ANGPTL3 that we will describe later in the manuscript were only identified after the IgY12 and the SuperMix column depletion. Many of the proteins that we identified were previously quantified to be medium to low-abundance proteins as exemplified by MMP9 (162–236 ng/mL) [28] and ADAMTS13 (500–1000 ng/mL) [29]. There are 22 proteins that were identified uniquely in the IgY12 depletion alone, but not after the additional SuperMix column depletion. It is possible that these 22 proteins are removed together with the medium-high-abundant proteins that were removed by the SuperMix column as they bound to each other. Alternatively, this could be due to stochastic nature of different MS runs. We did not analyze the bound fraction of the proteins on the SuperMix column, and therefore could not determine what was the cause. It is possible that both factors play roles in this phenomenon.
We used ASAPRatio [27] program to calculate the quantitative differences between the normal and cancer pools. The median ratios of these 222 proteins is 0.9, we therefore normalized the ratios by this. We identified 43 proteins (all with two unique peptides hits) that are over expressed by more than twofold (normalized ASAPRatio) and eight proteins (all with two unique peptide hits) that are under expressed by twofold in the cancer serum pool compared with the normal serum pool (Table 1 and Supporting Information Table 2). Supporting Information Table 2 lists the number of peptides used for protein quantification measurement, and the mean and standard deviation of the protein quantification.
Table 1.
Serum proteins that are differentially expressed between ovarian cancer patients and normal controls
| IPI number | Normalized ASAP ratios (normal/cancer) | Ratio SD | Number of unique peptides | Total number of peptides | Description |
|---|---|---|---|---|---|
| Over expressed in cancer | |||||
| IPI00791343 | 0.00 | 0 | 2 | 2 | 261 kDa protein |
| IPI00102300 | 0.00 | 0 | 3 | 3 | Isoform 3 of platelet glycoprotein VI |
| IPI00783169 | 0.06 | 0.01 | 74 | 160 | Coagulation factor XII |
| IPI00747585 | 0.06 | 0.02 | 2 | 3 | Transketolase-like 1 |
| IPI00384040 | 0.14 | 0.17 | 2 | 5 | 58 kDa protein |
| IPI00022417 | 0.14 | 0.02 | 2 | 4 | LRG1 |
| IPI00478493 | 0.19 | 0.12 | 10 | 13 | HP protein |
| IPI00374218 | 0.23 | 0.48 | 3 | 3 | Hypothetical protein |
| IPI00303210 | 0.24 | 0.03 | 4 | 5 | Isoform 2 of ectonucleotide pyrophosphatase/phosphodiesterase 2 |
| IPI00216641 | 0.28 | 0.31 | 3 | 3 | Isoform 2 of contactin-1 |
| IPI00642425 | 0.29 | 0.04 | 5 | 6 | Cell surface glycoprotein |
| IPI00167093 | 0.29 | 0.26 | 7 | 8 | Complement factor H-related 1 |
| IPI00027509 | 0.29 | 0.1 | 4 | 6 | MMP-9 |
| IPI00029235 | 0.31 | 0.36 | 7 | 10 | IGFBP 6 |
| IPI00026482 | 0.32 | 0.17 | 2 | 2 | 10 kDa protein |
| IPI00639937 | 0.33 | 0.17 | 55 | 91 | B-factor |
| IPI00430820 | 0.34 | 0.66 | 8 | 12 | IGKV1-5 protein |
| IPI00018274 | 0.37 | 0.3 | 2 | 2 | Isoform 1 of epidermal growth factor receptor |
| IPI00022371 | 0.38 | 0.16 | 10 | 12 | Histidine-rich glycoprotein |
| IPI00642991 | 0.42 | 0.39 | 11 | 16 | Fibronectin 1 isoform 6 |
| IPI00020557 | 0.46 | 0.17 | 4 | 4 | Low-density lipoprotein receptor-related protein 1 |
| IPI00216694 | 0.49 | 0.18 | 3 | 5 | Plastin 3 |
| IPI00006114 | 0.50 | 0.16 | 10 | 16 | Pigment epithelium-derived factor |
| IPI00022488 | 0.51 | 0.25 | 150 | 453 | Hemopexin |
| IPI00784458 | 0.52 | 0.39 | 5 | 5 | 312 kDa protein |
| IPI00030385 | 0.53 | 0.08 | 2 | 2 | CDNA FLJ13813 fis |
| IPI00021727 | 0.53 | 0.13 | 23 | 33 | C4b-binding protein alpha chain |
| IPI00018305 | 0.53 | 0.73 | 10 | 24 | IGFBP 3 |
| IPI00298971 | 0.54 | 0.19 | 18 | 36 | Vitronectin |
| IPI00294004 | 0.54 | 0.17 | 6 | 6 | Vitamin K-dependent protein S |
| IPI00790993 | 0.56 | 0.19 | 12 | 15 | 104 kDa protein |
| IPI00555752 | 0.56 | 0.06 | 6 | 7 | Complement component 4 binding protein |
| IPI00297284 | 0.56 | 0.28 | 26 | 48 | IGFBP 2 |
| IPI00032220 | 0.56 | 0.25 | 15 | 24 | Angiotensinogen |
| IPI00550991 | 0.57 | 0.14 | 22 | 40 | Isoform 1 of Alpha-1-antichymotrypsin |
| IPI00022395 | 0.57 | 0.25 | 80 | 149 | Complement component C9 |
| IPI00554498 | 0.58 | 0.11 | 3 | 4 | l-lactate dehydrogenase C chain |
| IPI00743064 | 0.59 | 0.04 | 4 | 4 | 23 kDa protein |
| IPI00290571 | 0.59 | 0.33 | 2 | 2 | F-box only protein 30 |
| IPI00027780 | 0.60 | 0.42 | 6 | 7 | 72 kDa type IV collagenase |
| IPI00292530 | 0.61 | 0.17 | 11 | 13 | Inter-alpha-trypsin inhibitor heavy chain H1 |
| IPI00022331 | 0.62 | 0.06 | 3 | 3 | Phosphatidylcholine-sterol acyltransferase |
| Under expressed in cancer | |||||
| IPI00647344 | 2.58 | 0.33 | 2 | 2 | Similar to cytosolic non-specific dipeptidase |
| IPI00022434 | 2.87 | 0.41 | 7 | 9 | ALB protein |
| IPI00411302 | 3.27 | 0.81 | 2 | 2 | Transmembrane protease |
| IPI00004957 | 3.44 | 2.17 | 2 | 2 | ANGPTL3 |
| IPI00645500 | 3.60 | 0.41 | 2 | 2 | Complement component 2 |
| IPI00022432 | 6.26 | 1.03 | 15 | 29 | Transthyretin |
| IPI00514342 | 918.59 | 17.6 | 2 | 2 | Selectin E |
| IPI00025426 | 918.59 | 17.6 | 11 | 81 | Pregnancy zone protein |
Many interesting and functionally characterized proteins were identified as differentially expressed (Table 1) and these include LRG1, MMP-9, inter-α-trypsin inhibitor heavy chain H1, IGFBP6, IGFBP3, isoform 1 of epidermal growth factor receptor and phosphatidylcholine-sterol acyltransferase. Likewise, many other novel and uncharacterized proteins were also identified including IPI00026482 (10 kDa protein), IPI00374218 (hypothetical protein), IPI00784458 (312 kDa protein) and IPI00030385 (CDNA FLJ13813) (Table 1).
The proteins that were down-regulated in the cancer sera compared with normal controls include transthyretin, ANGPTL3, selectin E, pregnancy zone protein and two proteases IPI00647344 and IPI00411302. Transthyretin was previously identified by proteomics analysis [20] as being down-regulated in ovarian cancer.
3.2 Confirmation of ICAT/MS/MS data by ELISA assays
The most frequent bottleneck for high-throughput proteomic analysis is data verification using Western blot analysis and ELISA assays. However, the availability of good antibodies and ELISA assay kits is limited. We were able to find ELISA assays for human total MMP9 (R&D Systems) and ANGPTL3 (Immuno-Biological Laboratories). Using the same ten normal individual and ten ovarian cancer patient sera that we pooled for tandem IgY12 and SuperMix column depletion and ICAT/MS/MS analysis, we performed an ELISA analysis. We were able to confirm over expression of MMP9 in the ten ovarian cancer sera compared with the ten normal individuals (t-test, p = 0.011, tail 1, type 3) (Fig. 2A). We were also able to confirm that ANGPTL3 was under expressed in the ten ovarian cancer sera compared with the ten normal individuals (t-test, p = 0.0009, tail 1, type 3) (Fig. 2B).
Figure 2.
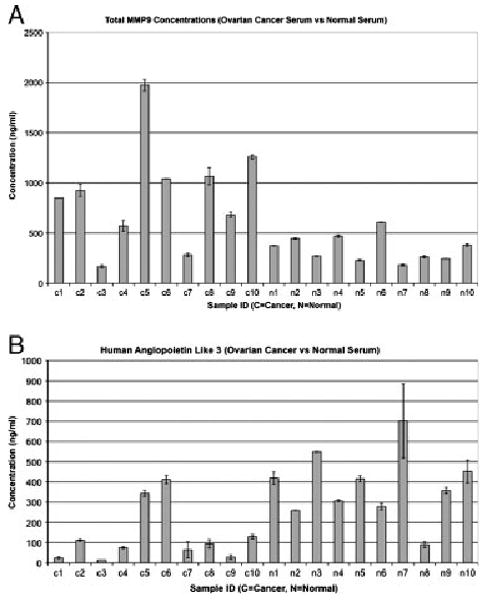
Confirmation of ICAT/MS/MS data by ELISA assays. (A) A column chart showing the expression levels of total serum MMP9 in normal individuals (N1–N10) and ovarian cancer serum samples (C1–C10). Y-axis, expression levels are measured in nanogram per milliliter. (B) A column chart showing the expression levels of serum ANGPL3 in normal individuals (N1–N10) and ovarian cancer serum samples (C1–C10). Y-axis, expression levels are measured in nanogram per milliliter.
4 Discussion
We showed that the tandem depletion of sera using both the IgY12 and the SuperMix column (Genway Biotech) greatly enhanced our ability to detect differentially expressed proteins in serum. We showed that the tandem allowed us to detect about two times (222 versus 71) more proteins than depletion with the IgY12 column alone. In addition, of the 51 differentially expressed proteins we identified using the tandem depletion approach, only three of them (complement factor H-related 1, vitamin K-dependent protein S and transthyretin) were identified using single IgY12 depletion. Our data are consistent with a recent publication by Qian et al., [23] who demonstrated that the SuperMix flow-through samples have 60–80% increase in proteome coverage compared with IgY12 flow-through samples. They showed that 42 proteins identified by this method have reported normal concentrations of ∼100 pg/mL to 100 ng/mL [23]. They reported the identification of macrophage colony-stimulating factor 1 and MMP8, for which the concentrations were at 202 ± 20 pg/mL and 12.4 ± 0.4 ng/mL, respectively, as measured by ELISA assays [23]. We showed that the proteins we identified have similar normal concentration range reported in the literature including MMP9 (162–236 ng/mL) [28] and ADAMTS13 (500–1000 ng/mL) [29]. The study by Qian et al. only used serum sample from one healthy individual to demonstrate the reproducibility of the approach. The sample was spiked with known amounts of protein standards and spectral counting was used to show the correlation between protein abundance and spectral counts [29]. Our current study is the first to couple subsequent labeled quantitative proteomic analysis (e.g. ICAT/MS/MS) to the tandem depletion approach, and we demonstrated its potential clinical application in ovarian cancer biomarker discovery.
Although our study and that of Qian et al. [23] showed the ability to identify low-abundant proteins with expression levels in the low nanogram levels in serum samples using the tandem serum depletion approach, there are still moderately abundant proteins identified in the flow-through samples after tandem depletion. This suggests that tandem depletion is not 100% complete, partially due to the capacity of the amount of antibodies in the SuperMix column. It should be noted that the SuperMix antibody column from GenWay Biotech was not packaged with individual antibody against each individual moderately abundant protein identified in the serum (Zhang, personal communication), but rather packaged with the antibody mixture derived from immunization of the collective flow-through serum proteins of the IgY12 columns. Therefore, it was not adjusted to reflect the different concentrations of the moderately abundant proteins. Future development of a SuperMix column packaged with each individual antibody against each moderately abundant protein, and with varying amounts correlated with serum abundance might be necessary to increase the efficiency of serum depletion. Although we have not analyzed the bound fractions from the antibody columns, it was previously demonstrated that non-target proteins could be found in the column-bound fractions [30]. Therefore, there is a possibility we might miss those biomarkers that are bound to antibody columns as non-target proteins. In summary, we have clearly demonstrated that the tandem serum depletion approach allowed us to identify potential low-abundant serum biomarker candidates. However, the disadvantage of serum depletion is that the cost is high, and that some non-target proteins (biomarkers) may be bound to the antibody columns and be missed from the analysis unless the bound fraction is also analyzed. However, we did not find a good way to efficiently separate non-target proteins from target proteins from the antibody column.
Many of the differentially expressed low-abundant proteins that we found in sera of EOC patients have previously been associated with cancer progression in multiple tumor types. We identified IGFBP2, 3 and 6 to be over expressed in the sera of ovarian cancer patients compared with normal individuals. Walker et al. [31] recently showed that IGFBP3 is a predictive marker for ovarian cancer progression as IGFBP3 staining was significantly higher in tumors from patients demonstrating CA125 progression compared with no CA125 progression (defined as either a CA125 reduction or a minimal increase of <50%). IGFBP2 has also been identified as a promoter of tumor invasion for ovarian cancers [32]. Recently, Mehrian-Shai et al. [33] showed that IGFBP-2 is a potential serum biomarker of PTEN status and PI3K/Akt pathway activation in prostate and glioblastoma cancer patients.
We were limited by the availability of established ELISA assays for validating many of the candidate biomarkers that we identified. For example, we identified LRG1 as over expressed in ovarian cancer patients in our analysis. LRG1 was previously identified to be over expressed in the plasma of pancreatic cancer patients compared with normal controls by 2-D gel coupled with MS analysis and validated by Western blotting [34]. Its role in ovarian cancer has not been studied. We also identified the transketolase-like protein that has been found at elevated levels in malignant cells [35] and cancers, including EOC [36]. Transketolase-like protein is the key enzyme of a recently described metabolic pathway that links the pentose phosphate pathway and the Embden–Meyerhof pathway together. It also provides a link between anerobic glucose degradation and the production of fatty acids by the usage of acetyl-CoA. This pathway could provide an avenue for ovarian cancer cells to survive conditions of hypoxia and low pH in the tumor micro-environment. Finally, Zhang et al. [20] identified a cleavage fragment of inter-α-trypsin inhibitor heavy chain H4 as over expressed in ovarian cancer sera in their proteomic analysis of sera from 153 patients with invasive EOC, 42 with other ovarian cancers, 166 with benign pelvic masses and 142 healthy women. Interestingly, the family of inter-α-trypsin inhibitors contributes to the stability of the extracellular matrix, and is involved in various acute-phase processes, such as inflammation or cancer. We identified here an over expression of inter-α-trypsin inhibitor heavy chain H1 in ovarian cancer patient sera, suggesting that more than one member of the inter-α-trypsin inhibitor heavy chain are over expressed in ovarian cancer patients. Taken together, the proteins that we have identified from the low-abundant fraction of sera of EOC patients play critical roles in cancer progression, and are relevant for additional studies as EOC biomarkers.
An interesting observation from our study is the over-representation of proteins that contribute to cancer development via interactions with the extracellular matrix, thereby facilitating cancer cell migration/invasion across tissue boundaries. These proteins include MMP9, fibronectin 1, vitronectin and connectin 1. Together, these proteins are now recognized as key regulators of various neoplastic processes by virtue of their ability to mediate differentiation, proliferation and survival of neoplastic cells [37] release mitogenic growth factors from cell surfaces and from ECM reservoirs, and regulate tumor-associated angiogenesis [38, 39].
We confirmed that MMP9 is over expressed in ovarian cancer sera compared with sera from normal individuals by an ELISA assay. MMP9 was previously identified as a potential marker for a screening test for colorectal cancer [40], and as a classification marker for benign breast disease patients and breast cancer patients [29]. In addition, increased expression of cancer cell-associated MMP9 at the tissue level has been previously demonstrated in ovarian cancer compared with normal and benign ovarian tissues [41–43]. Recently, Sillanpaa et al. [44] analyzed the expression of MMP9 by immunohistochemistry in 292 primary tumors and their 31 metastases and showed that a low proportion of strong MMP9 expression in cancer cells and higher proportion of strong stromal MMP9 expression correlated with advanced stage of the tumor (p=0.003, p=0.02, respectively). They proposed that MMP9 has a dual role in tumor progression, acting against tumor advancement when in tumor epithelium and promoting tumor progression while in the stroma [44]. Additional previous reports indicate that tissue expression of MMP9 was found essentially in all invasive human EOC, including early stage I cancers as well as metastatic implants, while normal ovarian tissue exhibited significantly lower levels of expression [41, 45] indicating that MMP9 is up-regulated early in EOC progression. However, all of the above studies were conducted at the tissue level, which require invasive procedures. We report here for the first time that MMP9 serum expression is an indicator of ovarian cancers. The potential clinical relevance of our result is further highlighted by a recent report, indicating that treatment of early-stage cancer with an MMP9 inhibitor (marimastat) might increase survival [46].
After confirming MMP9 as a protein identified as over expressed in ovarian cancer serum using our approach, we decided to see if we could also confirm a protein that was identified as under expressed in cancer serum. We found that the ELISA assay was available for ANGPTL3 and was able to confirm that it is under expressed in ovarian cancer serum samples compared with normal individuals. ANGPTL3 is a member of the angiopoietin-like family of secreted factors [47]. It has the characteristic structure of angiopoietins, consisting of a signal peptide, N-terminal coiled-coil domain and the C-terminal fibrinogen-like domain. ANGPTL3 may also play a role in the regulation of angiogenesis [47]. ANGPTL3 is a regulator of lipid metabolism [48]; however, its role in cancer was not yet studied. Interestingly, Kikuchi et al. [49] recently showed that ANGPTL2, another member of the angiopoietin-like family of secreted factors, is a tumor suppressor in ovarian cancers. They showed that ANGPTL2 methylation was frequently observed in primary OC tissues and the methylation status was inversely associated with ANGPTL2 expression levels, which were found to be frequently reduced (51 of 100 cases) using IHC analysis [49]. In the light of our finding that ANGPTL3 is under expressed in ovarian cancer serum samples compared with normal individuals, a further study of the role of ANGPTL3 in ovarian cancer is warranted.
The limitation of our study is that we have not evaluated the performance of the markers we identified in a large cohort of clinical samples, which require adequate clinical resources. In addition, many candidate markers that we identified lack ELISA assays and their performance as biomarkers could not be evaluated currently. We have decided to publish our approach and the candidate biomarker list so that others in the field can help developing the ELISA assay and/or evaluating the performance of these markers.
In summary, we showed that direct quantitative serum proteomic analysis after depleting in tandem both the abundant and the moderately abundant 89 proteins, allows the identification of more low-abundant proteins in serum compared with single depletion of a few most abundant proteins, which is often used [50, 51]. We also identified many other promising biomarkers including MMP9 and ANGPTL3 that can also be further validated after developing ELISA assays or be validated using multiple reaction monitoring coupled with MS. At the present time, there is no clearly defined precancerous phase of EOC. However, it is clear that even the detection of early asymptomatic invasive stage I/II disease could have a profound impact on clinical outcome. Therefore, the candidate biomarkers that were identified in this study, if confirmed in a large cohort of clinical samples, will be useful for the detection of stage I/II EOC in the general and high-risk populations, as we as in monitoring the course of EOC during treatment.
Supplementary Material
Acknowledgments
This work was supported by grants from the Ministry of Science and Technology, China (2006AA02Z4A2, 2006AA02A303, 2007DFC30360, 2008DFA11320 and 2006DFA2950), grant U54DA021519 to the National Center for Integrative Biomedical Informatics from NIH, USA; grant R21CA106949-01A1 from the NIH, USA, and Ovarian Cancer Working Group Grant from the Cancer Research Institute. We also thank Drs. Weiwei Zhang and Xiangming Fang at GenWay Biotech for their help in serum depletion.
Abbreviations
- ANGPTL3
angiopoietin-like protein 3
- ASAPRatio
automated statistical analysis of protein abundance ratio
- EOC
epithelial ovarian cancer
- FDR
false discovery rate
- IGFBP
insulin-like growth factor-binding protein
- LRG1
leucine-rich alpha-2-glycoprotein
- MMP-9
matrix metalloproteinase-9
Footnotes
The authors have declared no conflict of interest.
References
- 1.Greenlee RT, Hill-Harmon MB, Murray T, Thun M. Cancer statistics. CA Cancer J Clin. 2001;51:15–36. doi: 10.3322/canjclin.51.1.15. [DOI] [PubMed] [Google Scholar]
- 2.Young RC, Walton LA, Ellenberg SS, Homesley HD, et al. Adjuvant therapy in stage I and stage II epithelial ovarian cancer. Results of two prospective randomized trials. N Engl J Med. 1990;322:1021–1027. doi: 10.1056/NEJM199004123221501. [DOI] [PubMed] [Google Scholar]
- 3.van Nagell JR, Jr, DePriest PD, Reedy MB, Gallion HH, et al. The efficacy of transvaginal sonographic screening in asymptomatic women at risk for ovarian cancer. Gynecol Oncol. 2000;77:350–356. doi: 10.1006/gyno.2000.5816. [DOI] [PubMed] [Google Scholar]
- 4.Kyrgiou M, Tsoumpou I, Martin-Hirsch P, Arbyn M, et al. Ovarian cancer screening. Anticancer Res. 2006;26:4793–4801. [PubMed] [Google Scholar]
- 5.Skates SJ, Xu FJ, Yu YH, Sjovall K, et al. Toward an optimal algorithm for ovarian cancer screening with longitudinal tumor markers. Cancer. 1995;76:2004–2010. doi: 10.1002/1097-0142(19951115)76:10+<2004::aid-cncr2820761317>3.0.co;2-g. [DOI] [PubMed] [Google Scholar]
- 6.Zhang Z, Barnhill SD, Zhang H, Xu F, et al. Combination of multiple serum markers using an artificial neural network to improve specificity in discriminating malignant from benign pelvic masses. Gynecol Oncol. 1999;73:56–61. doi: 10.1006/gyno.1999.5320. [DOI] [PubMed] [Google Scholar]
- 7.McIntosh MW, Urban N, Karlan B. Generating longitudinal screening algorithms using novel biomarkers for disease. Cancer Epidemiol Biomarkers Prev. 2002;11:159–166. [PubMed] [Google Scholar]
- 8.Berek JS, Bast RC., Jr Ovarian cancer screening. The use of serial complementary tumor markers to improve sensitivity specificity for early detection. Cancer. 1995;76:2092–2096. doi: 10.1002/1097-0142(19951115)76:10+<2092::aid-cncr2820761331>3.0.co;2-t. [DOI] [PubMed] [Google Scholar]
- 9.Jacobs IJ, Skates SJ, MacDonald N, Menon U, et al. Screening for ovarian cancer: a pilot randomised controlled trial. Lancet. 1999;353:1207–1210. doi: 10.1016/S0140-6736(98)10261-1. [DOI] [PubMed] [Google Scholar]
- 10.Kim JH, Skates SJ, Uede T, Wong KK, et al. Osteopontin as a potential diagnostic biomarker for ovarian cancer. J Amer Med Assoc. 2002;287:1671–1679. doi: 10.1001/jama.287.13.1671. [DOI] [PubMed] [Google Scholar]
- 11.Gortzak-Uzan L, Ignatchenko A, Evangelou AI, Agochiya M, et al. A proteome resource of ovarian cancer ascites: integrated proteomic and bioinformatic analyses to identify putative biomarkers. J Proteome Res. 2008;7:339–351. doi: 10.1021/pr0703223. [DOI] [PubMed] [Google Scholar]
- 12.Stewart JJ, White JT, Yan X, Collins S, et al. Proteins associated with Cisplatin resistance in ovarian cancer cells identified by quantitative proteomic technology and integrated with mRNA expression levels. Mol Cell Proteomics. 2006;5:433–443. doi: 10.1074/mcp.M500140-MCP200. [DOI] [PubMed] [Google Scholar]
- 13.Le Moguen K, Lincet H, Marcelo P, Lemoisson E, et al. A proteomic kinetic analysis of IGROV1 ovarian carcinoma cell line response to cisplatin treatment. Proteomics. 2007;7:4090–4101. doi: 10.1002/pmic.200700231. [DOI] [PubMed] [Google Scholar]
- 14.Lopez MF, Mikulskis A, Kuzdzal S, Golenko E, et al. A novel, high-throughput workflow for discovery and identification of serum carrier protein-bound peptide biomarker candidates in ovarian cancer samples. Clin Chem. 2007;53:1067–1074. doi: 10.1373/clinchem.2006.080721. [DOI] [PubMed] [Google Scholar]
- 15.Bengtsson S, Krogh M, Szigyarto CA, Uhlen M, et al. Large-scale proteomics analysis of human ovarian cancer for biomarkers. J Proteome Res. 2007;6:1440–1450. doi: 10.1021/pr060593y. [DOI] [PubMed] [Google Scholar]
- 16.Young TW, Mei FC, Rosen DG, Yang G, et al. Up-regulation of tumor susceptibility gene 101 protein in ovarian carcinomas revealed by proteomics analyses. Mol Cell Proteomics. 2007;6:294–304. doi: 10.1074/mcp.M600305-MCP200. [DOI] [PubMed] [Google Scholar]
- 17.Jackson D, Craven RA, Hutson RC, Graze I, et al. Proteomic profiling identifies afamin as a potential biomarker for ovarian cancer. Clin Cancer Res. 2007;13:7370–7379. doi: 10.1158/1078-0432.CCR-07-0747. [DOI] [PubMed] [Google Scholar]
- 18.An HJ, Kim DS, Park YK, Kim SK, et al. Comparative proteomics of ovarian epithelial tumors. J Proteome Res. 2006;5:1082–1090. doi: 10.1021/pr050461p. [DOI] [PubMed] [Google Scholar]
- 19.Ahmed N, Oliva KT, Barker G, Hoffmann P, et al. Proteomic tracking of serum protein isoforms as screening biomarkers of ovarian cancer. Proteomics. 2005;5:4625–4636. doi: 10.1002/pmic.200401321. [DOI] [PubMed] [Google Scholar]
- 20.Zhang Z, Bast RC, Jr, Yu Y, Li J, et al. Three biomarkers identified from serum proteomic analysis for the detection of early stage ovarian cancer. Cancer Res. 2004;64:5882–5890. doi: 10.1158/0008-5472.CAN-04-0746. [DOI] [PubMed] [Google Scholar]
- 21.Jones MB, Krutzsch H, Shu H, Zhao Y, et al. Proteomic analysis and identification of new biomarkers and therapeutic targets for invasive ovarian cancer. Proteomics. 2002;2:76–84. [PubMed] [Google Scholar]
- 22.Anderson NL, Polanski M, Pieper R, Gatlin T, et al. The human plasma proteome: a nonredundant list developed by combination of four separate sources. Mol Cell Proteomics. 2004;3:311–326. doi: 10.1074/mcp.M300127-MCP200. [DOI] [PubMed] [Google Scholar]
- 23.Qian WJ, Kaleta DT, Petritis BO, Jiang H, et al. Enhanced detection of low abundant human plasma proteins using a tandem IgY12-supermix immunoaffinity separation strategy. Mol Cell Proteomics. 2008;7:1963–1973. doi: 10.1074/mcp.M800008-MCP200. [DOI] [PMC free article] [PubMed] [Google Scholar]
- 24.Keller A, Nesvizhskii AI, Kolker E, Aebersold R. Empirical statistical model to estimate the accuracy of peptide identifications made by MS/MS and database search. Anal Chem. 2002;74:5383–5392. doi: 10.1021/ac025747h. [DOI] [PubMed] [Google Scholar]
- 25.Nesvizhskii AI, Keller A, Kolker E, Aebersold R. A statistical model for identifying proteins by tandem mass spectrometry. Anal Chem. 2003;75:4646–4658. doi: 10.1021/ac0341261. [DOI] [PubMed] [Google Scholar]
- 26.Elias JE, Haas W, Faherty BK, Gygi SP. Comparative evaluation of mass spectrometry platforms used in large-scale proteomics investigations. Nat Methods. 2005;2:667–675. doi: 10.1038/nmeth785. [DOI] [PubMed] [Google Scholar]
- 27.Li XJ, Zhang H, Ranish JA, Aebersold R. Automated statistical analysis of protein abundance ratios from data generated by stable-isotope dilution and tandem mass spectrometry. Anal Chem. 2003;75:6648–6657. doi: 10.1021/ac034633i. [DOI] [PubMed] [Google Scholar]
- 28.Mihaylova Z, Ludovini V, Gregorg V, Floriani I, et al. Serum level changes of matrix metalloproteinases 2 and 9, vascular endothelial growth factor and epidermal growth factor receptor during platinum-based chemotherapy in advanced non-small cell lung cancer patients. J BUON. 2007;12:105–111. [PubMed] [Google Scholar]
- 29.Somiari SB, Somiari RI, Heckman CM, Olsen CH, et al. Circulating MMP2 and MMP9 in breast cancer – potential role in classification of patients into low risk, high risk, benign disease and breast cancer categories. Int J Cancer. 2006;119:1403–1411. doi: 10.1002/ijc.21989. [DOI] [PubMed] [Google Scholar]
- 30.Gong Y, Li X, Yang B, Ying W, et al. Different immunoaffinity fractionation strategies to characterize the human plasma proteome. J Proteome Res. 2006;5:1379–1387. doi: 10.1021/pr0600024. [DOI] [PubMed] [Google Scholar]
- 31.Walker G, MacLeod K, Williams AR, Cameron DA, et al. Insulin-like growth factor binding proteins IGFBP3, IGFBP4, and IGFBP5 predict endocrine responsiveness in patients with ovarian cancer. Clin Cancer Res. 2007;13:1438–1444. doi: 10.1158/1078-0432.CCR-06-2245. [DOI] [PubMed] [Google Scholar]
- 32.Lee EJ, Mircean C, Shmulevich I, Wang H, et al. Insulin-like growth factor binding protein 2 promotes ovarian cancer cell invasion. Mol Cancer. 2005;4:7. doi: 10.1186/1476-4598-4-7. [DOI] [PMC free article] [PubMed] [Google Scholar]
- 33.Mehrian-Shai R, Chen CD, Shi T, Horvath S, et al. Insulin growth factor-binding protein 2 is a candidate biomarker for PTEN status and PI3K/Akt pathway activation in glioblastoma and prostate cancer. Proc Natl Acad Sci USA. 2007;104:5563–5568. doi: 10.1073/pnas.0609139104. [DOI] [PMC free article] [PubMed] [Google Scholar]
- 34.Kakisaka T, Kondo T, Okano T, Fujii K, et al. Plasma proteomics of pancreatic cancer patients by multi-dimensional liquid chromatography and two-dimensional difference gel electrophoresis (2D-DIGE): up-regulation of leucine-rich alpha-2-glycoprotein in pancreatic cancer. J Chromatogr B Analyt Technol Biomed Life Sci. 2007;852:257–267. doi: 10.1016/j.jchromb.2007.01.029. [DOI] [PMC free article] [PubMed] [Google Scholar]
- 35.Zhang S, Yue JX, Yang JH, Cai PC, Kong WJ. Overexpression of transketolase protein TKTL1 is associated with occurrence and progression in nasopharyngeal carcinoma: a potential therapeutic target in nasopharyngeal carcinoma. Cancer Biol Ther. 2007;7:517–522. doi: 10.4161/cbt.7.4.5479. [DOI] [PubMed] [Google Scholar]
- 36.Krockenberger M, Honig A, Rieger L, Coy JF, et al. Transketolase-like 1 expression correlates with subtypes of ovarian cancer and the presence of distant metastases. Int J Gynecol Cancer. 2007;17:101–106. doi: 10.1111/j.1525-1438.2007.00799.x. [DOI] [PubMed] [Google Scholar]
- 37.Lakka SS, Gondi CS, Yanamandra N, Dinh DH, et al. Synergistic down-regulation of urokinase plasminogen activator receptor and matrix metalloproteinase-9 in SNB19 glioblastoma cells efficiently inhibits glioma cell invasion, angiogenesis, and tumor growth. Cancer Res. 2003;63:2454–2461. [PubMed] [Google Scholar]
- 38.Chantrain CF, Shimada H, Jodele S, Groshen S, et al. Stromal matrix metalloproteinase-9 regulates the vascular architecture in neuroblastoma by promoting pericyte recruitment. Cancer Res. 2004;64:1675–1686. doi: 10.1158/0008-5472.can-03-0160. [DOI] [PubMed] [Google Scholar]
- 39.Bergers G, Brekken R, McMahon G, Vu TH, et al. Matrix metalloproteinase-9 triggers the angiogenic switch during carcinogenesis. Nat Cell Biol. 2000;2:737–744. doi: 10.1038/35036374. [DOI] [PMC free article] [PubMed] [Google Scholar]
- 40.Wilson S, Wakelam MJ, Hobbs RF, Ryan AV, et al. Evaluation of the accuracy of serum MMP-9 as a test for colorectal cancer in a primary care population. BMC Cancer. 2006;6:258. doi: 10.1186/1471-2407-6-258. [DOI] [PMC free article] [PubMed] [Google Scholar]
- 41.Schmalfeldt B, Prechtel D, Harting K, Spathe K, et al. Increased expression of matrix metalloproteinases (MMP)-2, MMP-9, and the urokinase-type plasminogen activator is associated with progression from benign to advanced ovarian cancer. Clin Cancer Res. 2001;7:2396–2404. [PubMed] [Google Scholar]
- 42.Huang LW, Garrett AP, Bell DA, Welch WR, et al. Differential expression of matrix metalloproteinase-9 and tissue inhibitor of metalloproteinase-1 protein and mRNA in epithelial ovarian tumors. Gynecol Oncol. 2000;77:369–376. doi: 10.1006/gyno.2000.5806. [DOI] [PubMed] [Google Scholar]
- 43.Maatta M, Santala M, Soini Y, Talvensaari-Mattila A, Turpeenniemi-Hujanen T. Matrix metalloproteinases 2 and 9 and their tissue inhibitors in low malignant potential ovarian tumors. Tumour Biol. 2004;25:188–192. doi: 10.1159/000081101. [DOI] [PubMed] [Google Scholar]
- 44.Sillanpaa S, Anttila M, Voutilainen K, Ropponen K, et al. Prognostic significance of matrix metalloproteinase-9 (MMP-9) in epithelial ovarian cancer. Gynecol Oncol. 2007;104:296–303. doi: 10.1016/j.ygyno.2006.09.004. [DOI] [PubMed] [Google Scholar]
- 45.Lengyel E, Schmalfeldt B, Konik E, Spathe K, et al. Expression of latent matrix metalloproteinase 9 (MMP-9) predicts survival in advanced ovarian cancer. Gynecol Oncol. 2001;82:291–298. doi: 10.1006/gyno.2001.6243. [DOI] [PubMed] [Google Scholar]
- 46.Bramhall SR, Rosemurgy A, Brown PD, Bowry C, Buckels JA. Marimastat as first-line therapy for patients with unresectable pancreatic cancer: a randomized trial. J Clin Oncol. 2001;19:3447–3455. doi: 10.1200/JCO.2001.19.15.3447. [DOI] [PubMed] [Google Scholar]
- 47.Hato T, Tabata M, Oike Y. The role of angiopoietin-like proteins in angiogenesis and metabolism. Trends Cardiovasc Med. 2008;18:6–14. doi: 10.1016/j.tcm.2007.10.003. [DOI] [PubMed] [Google Scholar]
- 48.Koishi R, Ando Y, Ono M, Shimamura M, et al. Angptl3 regulates lipid metabolism in mice. Nat Genet. 2002;30:151–157. doi: 10.1038/ng814. [DOI] [PubMed] [Google Scholar]
- 49.Kikuchi R, Tsuda H, Kozaki K, Kanai Y, et al. Frequent inactivation of a putative tumor suppressor, angiopoietin-like protein 2, in ovarian cancer. Cancer Res. 2008;68:5067–5075. doi: 10.1158/0008-5472.CAN-08-0062. [DOI] [PubMed] [Google Scholar]
- 50.Zolotarjova N, Martosella J, Nicol G, Bailey J, et al. Differences among techniques for high-abundant protein depletion. Proteomics. 2005;5:3304–3313. doi: 10.1002/pmic.200402021. [DOI] [PubMed] [Google Scholar]
- 51.Whiteaker JR, Zhang H, Eng JK, Fang R, et al. Head-to-head comparison of serum fractionation techniques. J Proteome Res. 2007;6:828–836. doi: 10.1021/pr0604920. [DOI] [PubMed] [Google Scholar]
Associated Data
This section collects any data citations, data availability statements, or supplementary materials included in this article.