

Abstract
The walls of conduit arteries undergo cyclic stretching from the periodic fluctuation of arterial pressure. Atherosclerotic lesions have been shown to localize to regions of excessive stretching of the arterial wall. We employed a displacement encoding with stimulated echoes (DENSE) sequence to image the motion of the common carotid artery wall and map the two-dimensional (2D) circumferential strain. The sequence utilizes a fully-balanced steady-state free-precession (SSFP) readout with 0.60 mm in-plane resolution. Preliminary results in volunteers at 1.5T (N = 4) and 3.0T (N = 17) are compared to measurements of the lumen circumference from cine images. The agreement between the two independent measurements at both field strengths (P ≤ 0.001) supports the use of DENSE as a means to map the pulsatile strain in the carotid artery wall.
Stroke is the leading cause of serious, long-term disability in the United States, with over 700,000 cases each year. Furthermore, nearly 40% of these “brain attacks” result in death, making it the third leading cause of death (1). The most common cause of stroke is the formation of atherosclerotic plaques; these can grow large enough to block the flow of blood through the vessel (stenosis) or can rupture, causing blood clots (thrombosis) to form in the arteries that supply blood and oxygen to the brain (2).
Changes of arterial wall strain pattern may be associated with this process in several ways. First, the arterial wall may harden or stiffen due to atherosclerotic plaque formation (3). The hardening of the wall leads to a reduction of the pressure-driven cyclic stretching, or strain, which lends itself to characterization by displacement-based strain mapping; Excessive stretching at branching and curved locations of the arterial tree may also be a relevant mechanical factor in the development of atherosclerosis (4). This is empirically supported by surgical evidence that the distribution of atherosclerotic plaques predominates at bifurcation points, such as the carotid arteries (5). Once the plaques are formed, 70% of them tend to rupture (6). The rupture event may also be related to mechanical weakening and excessive strain in the plaque under arterial pressure loading. Evidence to support this connection has been shown with intravenous ultrasound (IVUS) in excised atherosclerotic coronary segments under pulsatile pressure loading (7). The IVUS measurements show increased strain that extends in-depth beneath the thin cap of the plaques that rupture. In vivo IVUS studies of the culprit segment in patients with acute coronary syndrome also showed a clear separation of low vs. high strain in patients with stable symptoms vs. those with unstable chest pain or postmyocardial infarction (8). For these reasons, noninvasive imaging of the arterial wall strain pattern may provide additional information on the risk of atherosclerosis and the classification of plaques.
Further evidence that strain in the carotid wall may be relevant to atherogenesis comes from finite element analysis generated from IVUS (9–11) and MRI (12,13) images. The results of these studies show that high strain can be found at regions of the carotid bifurcation that correlate with sites of early atherosclerotic inflammation (13). Focal regions of high strain in the fibrous cap not only correlate with plaque rupture locations but are also predictive of where the rupture will occur (11,12). While these studies are illuminating and informative, they remain computational models in need of corroboration from direct measurements of strain.
The only means for mapping strain in the arterial wall that we are aware of is intravascular ultrasound, an invasive technique. We adapted a displacement encoding with stimulated echoes (DENSE) (14 –16) pulse sequence to measure the two-dimensional (2D) displacement vectors of the carotid artery wall and the surrounding tissue and calculated circumferential strain distribution. DENSE has primarily been used to track motion of the myocardial wall and, more recently, brain tissue (17), producing color-coded strain maps that represent active contraction or passive deformation. The purpose of this study is to test the ability of DENSE to map the carotid wall strain distribution (18) and to validate the results in normal volunteers at 1.5T and 3.0T against measurements of lumen circumference from cine scans.
MATERIALS AND METHODS
The DENSE sequence with balanced steady-state free-precession (SSFP), or true fast imaging with steady precession (trueFISP) readout is illustrated in Fig. 1. The DENSE method takes advantage of the stimulated echo that maintains phase information in the longitudinal direction, which does not decay as quickly as in the transverse plane. The encoding and decoding gradient pulses are separated by the mixing time Tm, so that spin displacement during this time causes a phase shift in the acquired image that is proportional to the net displacement in the direction of the gradient. A detailed explanation of this idea is given in the literature (16,19). One benefit of using stimulated echoes at long Tm periods is that it provides inherent black-blood contrast in the images. This is due to rapid motion of blood during the displacement encoding period that results in severe intravoxel dephasing and signal loss, thus providing inherent contrast between the vessel wall and blood flow. In the application of DENSE to the carotid artery we needed to achieve sufficient signal level at a relatively high spatial resolution in the carotid wall, and we opted for the balanced SSFP readout (20–22).
FIG. 1.
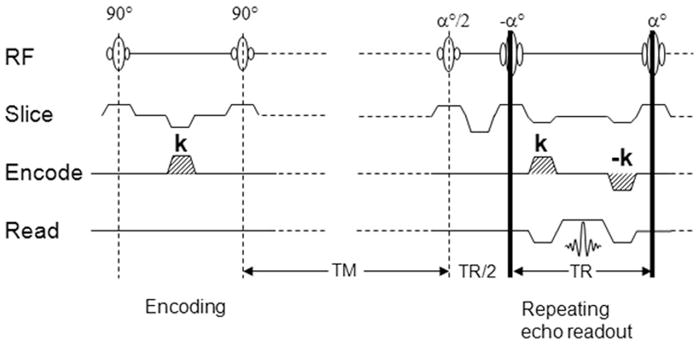
Illustration of the DENSE with balanced-SSFP readout pulse sequence. The gradient pulse k encodes spin displacement into a phase shift of the image. TR is the repetition time of the readout, and Tm is the mixing time allowing spin displacement to occur.
Referring to Fig. 1, the displacement-encoding section is followed by a train of trueFISP readout segments, each acquiring a k-space line. The flip angles of the train are ramped to equalize the signal amplitudes (20,22). It is important to note that trueFISP sequences are more dependent on B0 uniformity. Additional shimming is necessary, especially at 3.0T, at which B0 susceptibility is more pronounced, as described below. Signal averaging in the form of phase cycling was used to improve the signal-to-noise ratio (SNR) and remove the unwanted FID and stimulated antiecho signals (23–25).
Normal volunteer scans were performed at 1.5T (N = 4, all male, age range: 29–37 years) using a four-channel carotid coil pair (MachNet, The Netherlands), and at 3T (N = 17, seven males. 10 females, age range: 18 – 66 years) using a surface coil (NOVA, Boston, MA, USA). Scans were conducted under Institutional Review Board (IRB)-approved volunteer protocols (National Heart, Lung, and Blood Institute [NHLBI] MRI Technical Development Protocol for 1.5T and California Institute of Technology [Caltech] SF-88 for 3T) and informed consent was obtained. The same scan parameters were used at both field strengths. Initial three-plane scout images were acquired to localize the left and/or right carotid artery and optimize coil location. 2D time-of-flight (TOF) images were acquired and maximum image projections (MIPs) were used for slice positioning. Three slices were positioned at the common carotid artery such that the superior slice was placed 10 mm below the bifurcation point. An ECG-gated cine scan was acquired at the same location and resolution as DENSE images to determine the time points of maximum and minimum lumen diameter. DENSE images were acquired using a matrix size = 256 × 192 to provide a resolution = 0.60 × 0.60 × 4 mm. A bandwidth = 585 Hz per pixel was used with a trueFISP readout = 32 k-space lines per heartbeat, and TR/TE = 4.8/2.4 ms. Signal averaging or phase cycling = 10 was used. Displacement encoding was acquired in three oblique directions ([0, 1, 1], [0, −1, 1], [1, 0, 1]) to produced a pixel-by-pixel 2D displacement map. In DENSE measurements, the number of phase maps with independent displacement encoding directions is one more than the desired displacement components, so that one phase map serves as a reference map that is subtracted from the other two encoding maps to remove phase errors associated with B0 field homogeneity and other sources of phase variation (14,24). The encoding gradient area was 0.60 π/mm in-plane. The scans were triggered by the R-wave of the ECG, and image acquisition was consistently placed at the time of maximum lumen diameter judging from the cine scans, while in two separate scans the encoding portion was placed at 40 ms and 80 ms after the R-wave to capture the maximum wall strain and intermediate strain (Fig. 2). At 1.5T, three slices were acquired from both the left and right carotid arteries at maximum strain and at intermediate strain, which resulted in a total of 51 DENSE strain measurements in the four volunteers. At 3.0T, the single surface coil had a limited FOV and only allowed a single side of the neck to be scanned, resulting in a single slice acquired separately at maximum and intermediate strain for a total of 34 strain data points in the 17 volunteers. The total scan time for a slice was 6 min. Total protocol scan time was less than 45 min. Vacuum fixation cushions (VacFix; PAR Scientific, Denmark) were utilized to minimize movement effects due to swallowing.
FIG. 2.
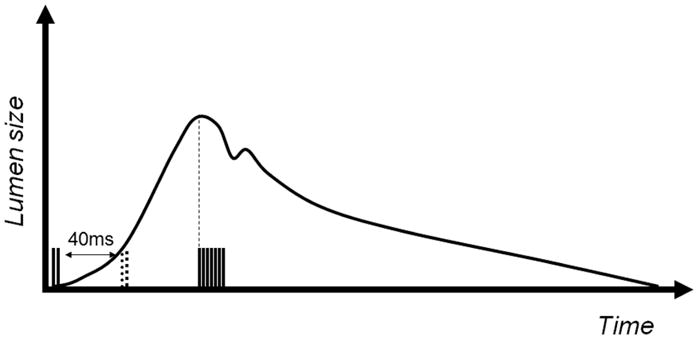
DENSE pulse sequence timing shown with lumen diameter changes from systole to diastole. The scans were triggered by the R-wave of the ECG, and image acquisition was consistently placed at the time of maximum lumen diameter judging from the cine scans, while in two separate scans the encoding portion was placed at 40 ms and 80 ms (dotted) after the R-wave to capture the maximum wall strain and intermediate strain. The readout remains the same in both scans.
While the 1.5T scans were relatively routine, imaging at 3.0T introduced technical issues, such as the lack of U.S. Food and Drug Administration (FDA)-approved dual surface coils, increased sensitivity to off-resonance effects from the trueFISP readout, and increased artifacts in the ECG signal. These obstructions were surmounted by optimizing coil placement, manually setting the shim volume, and centralizing the lead placement, respectively. Manual shim volume setting was completed by using localized shim volumes surrounding the scanned region and applying automated shimming, which was often repeated twice to achieve optimal shim.
For postprocessing, DENSE-MRI strain measurements were calculated taking all quadrilateral elements of neighboring pixels. The circumferential strain (Ecc) is a projection of 1 the Lagrangian strain tensor (26): , where E is the tissue deformation matrix from the in-plane displacement (Dx, Dy) of each quadrilateral element:
| [1] |
The elements of the matrix are calculated from linear regression of the displacement vectors relative to the coordinates of the pixels in the image. The circumferential strain is the projection of the strain tensor onto the circumferential direction ec:
| [2] |
The ec direction is based on a manually drawn contour of the vessel wall. Once the Ecc strain map is obtained, the mean Ecc strain value around the lumen, or <Ecc>, is calculated as the average of the pixel values over the contour, as shown in Fig. 3. The variance of the strain value around the lumen was also obtained. These measurements are semiautomated using software (DENSE-view) written for DENSE strain measurements.
FIG. 3.

DENSE strain measurements. Left: Displacement map generated from the phase images acquired at 1.5T. Right: Ecc strain map that is derived from the displacement vectors as described in Materials and Methods. Dotted line indicates the contour from which average strain is calculated.
For comparison with an independent measurement, we note that the mean circumferential strain around the lumen of the artery is effectively the fractional change of its circumference, which can be measured in cine MR images using the circumference of the lumen at the initial and end time points of the DENSE mixing time. In the cine images, the lumen boundary was drawn manually for the frames corresponding to the initial and end time points. The irregular shape of the cross-section at the bifurcation would make the lumen circumference unreliable; therefore, slices in the common carotid artery were used for cine measurements. The fractional change of the circumference was then used to provide the mean Ecc′ measurement by cine:
| [3] |
To compare the mean Ecc from the DENSE <Ecc> and CINE <Ecc′> measurements, we performed correlation and Bland-Altman analysis at both field strengths between the two techniques. The correlation and Bland-Altman included all data using both peak strain (40 ms after the R-wave) and intermediary strain (80 ms after the R-wave) measured by DENSE, with corresponding strain measured from cine. Additionally, we also measured the SNR of the DENSE data in the carotid wall for 1.5T and 3T separately.
RESULTS
Figure 4 shows the slice location and region of strain analysis around the carotid arteries using the DENSE technique. At 1.5T the average SNR ratio of the DENSE images among the volunteers was 2.6 in the segment of the wall bordering the jugular vein, 4.6 in the opposite segment, and 3.4 over the whole circumference. Correspondingly, the pixelwise displacement noise was between 44 and 78 μm, and the pixelwise Ecc strain noise was between 0.10 and 0.18, with an average of 0.14. At 3.0T, the average SNR ranged from 1.9 in the segment farthest from the surface coil to 14.9 in the most superficial segment, and 6.3 over the circumference. The corresponding pixelwise strain noise is between 0.032 and 0.25, with an average of 0.076. The variation of SNR matches the sensitivity profile of the single surface coil used for 3T imaging.
FIG. 4.

DENSE MRI. a: Slice locations (dotted lines) and shim volume (rectangle) of the DENSE and CINE MRI are indicated on maximum intensity projection images of 2D TOF MRI. Arrow indicates the carotid bifurcation used as a landmark. b: Raw DENSE phase image acquired at 1.5T. The rectangular volume indicates the area that is postprocessed using the DENSEview software. c: Three slices of the DENSE MRI acquired at 1.5T starting at the top from the inferior portion of the common carotid to just below the bifurcation. d: Three slices of the DENSE MRI acquired at 3.0T in the same order.
The average Ecc strain around the carotid circumference between diastole and systole represents the total distension of the circumference. In the 1.5T group this was 0.076 ± 0.006 (mean ± SD) by DENSE (<Ecc>) and 0.079 ± 0.007 by cine (<Ecc′>). In the 3T group <Ecc> was 0.072 ± 0.039 and <Ecc′> was 0.071 ± 0.031. The two groups consisted of different volunteers, and as a result have different ranges of Ecc strain. However, they were not statistically different from each other (P = 0.77). The average <Ecc> of both groups combined is 0.072 ± 0.026 by DENSE.
The correlation between DENSE <Ecc> and CINE <Ecc′> measurements show good agreement (Fig. 5). The mean and 95% confidence level of the correlation coefficient are 1.051 and 0.78–1.29 at 1.5T (R2 = 0.58), and 1.040 and 0.88–1.20 at 3T (R2 = 0.84), respectively. Paired t-tests between cine and DENSE values show no statistical difference between the two at both 1.5T and 3T (P = 0.45 and 0.50, respectively).
FIG. 5.
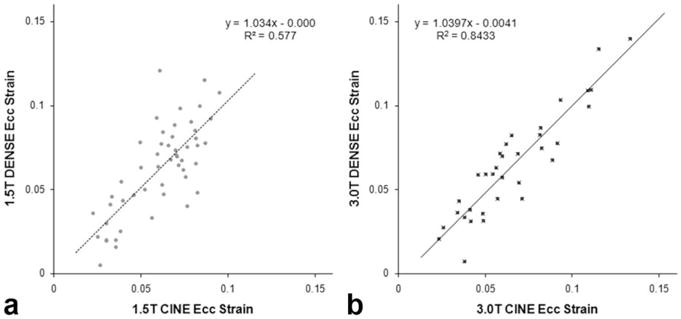
Cine and DENSE correlation at (a) 1.5T and (b) 3.0T. The results of the least squares linear fit are shown for both field strengths.
The Bland-Altman analysis (Fig. 6) indicates that the variance of the difference between DENSE <Ecc> and CINE <Ecc′> is 0.035 at 1.5T and 0.025 at 3T. The mean of the difference between these two methods is 0.002 at 1.5T and − 0.001 at 3T. The latter represents systematic biases of DENSE relative to cine, and are not statistically significant at either field strength (P = 0.45 and 0.50, respectively).
FIG. 6.
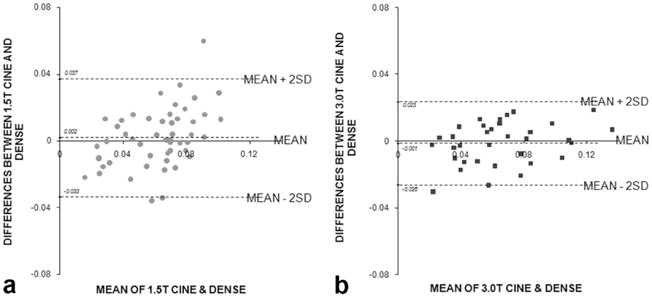
Bland-Altman graphs at (a) 1.5T and (b) 3.0T. The Bland-Altman graphs compare difference between the DENSE and cine strain measurements plotted against the mean of the two measurements. Mean ± 2SD are indicated by the dotted lines to show the 95% confidence interval.
It is important to note that DENSE provides Ecc on a pixelwise basis, a regional measure of strain that is different from the global mean <Ecc′> made from cine measurements. Since an equivalent noninvasive measurement of regional strain currently does not exist, it is informative to investigate the spatial variation of the strains measured. Figure 7 plots the variance of strain around the lumen circumference vs. the mean strain level. The results show that variance increases linearly with the mean strain. This indicates that there exists a spatial heterogeneity of strain that scales with the mean strain and contributes to the measured variance, in addition to any random noise that is independent from the mean strain. In the 1.5T group, the amplitude of the spatial variance is 50% of mean strain, whereas in the 3.0T group it is 35% of the mean strain. This difference, which may be due to the different age ranges of the two groups, warrants further study.
FIG. 7.
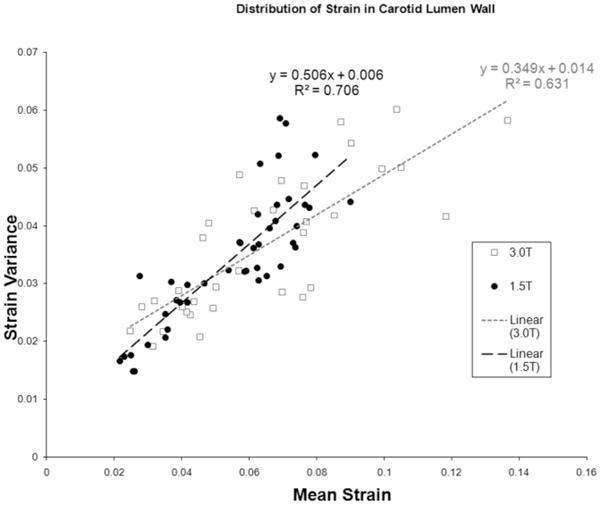
Spatial variance of strain at 1.5T and 3.0T. The DENSE strain variance around the lumen wall is correlated linearly with the mean DENSE strain measurements, indicating a real spatial heterogeneity in addition to random noise variation.
DISCUSSION
The results of the correlation analysis demonstrate that there is good agreement between DENSE strain and cine lumen size measurements at both 1.5T and 3.0T. The Bland-Altman plots show that the variability of DENSE values relative to cine is lower at 3.0T than at 1.5T. The increased SNR at 3.0T is the likely reason for the lower variability.
Previous studies have shown that direct lumen measurements from cine MRI show excellent agreement with lumen wall distention measurements using ultrasound (27,28). Crowe et al (27) measured the area distension of the common carotid lumen between diastole and systole in a group of volunteers using cine MRI and found it to be 15.1% ± 5.1%. This translates to a circumferential distension of 0.072 ± 0.021, which is in good agreement with our result of 0.072 ± 0.026. Using similar calculations from lumen area and/or diameter, other studies show a range of circumferential distension in normal subjects using MRI (0.103 in Ref. 28; 0.152 in Ref. 29) or ultrasound (0.052 in Ref. 30, 0.056 in Ref. 30, 0.086 in Ref. 28, and 0.088 in Ref. 27); our DENSE results are within the range.
Theoretically, there is an expected 2× signal gain when moving from 1.5T to 3.0T. However, the SNR comparisons at both fields show that while there is SNR gain in the segment closest to the surface coil, there is also signal loss in the distal segment due to the sensitivity profile of the single surface coil used at 3.0T. We also observed that the signal dropoff was greatly influenced by the wide range of the subjects’s neck geometries. The surface coil was the only commercially available coil approved for 3.0T use at the time of our study. Future array coils for neck imaging at 3T should rectify these shortcomings. Currently, the resolution of the images is 0.6 mm in-plane at 4-mm slice thickness. To improve the spatial resolution will require a tradeoff of SNR or scan time. The SNR increase at 3T compared to 1.5T implies that this limitation should be eased by the use of array coils at 3T. This will allow for higher resolution images for future studies in patients with known atherosclerosis.
It should be noted that DENSE strain measurements are localized, such that regional strain differences can be measured as opposed to cine or ultrasound lumen measurements, which provide global strain and by inference the average stiffness. While the average carotid arterial wall stiffness has been implicated in a broad range of neurological and cardiovascular diseases, including stroke (31), hypertension (32), myocardial infarction (3), inflammatory disease (33), and cognitive impairment (34), regional measurement may improve the specificity and sensitivity of this test, similar to what has been shown in strain mapping with IVUS (8).
This preliminary study provides the groundwork for future studies, which will compare regional strain values to a reference standard. Current IVUS strain mapping only provides radial strain but not circumferential distension, and cannot yet be compared with the DENSE technique. Similarly, a recent study using transcutaneous ultrasound (35) could measure circumferential strain only in some segments and was not quantified for in vivo studies, making it difficult to provide a direct comparison to DENSE. The rapid development of IVUS, ultrasound, and optical tomography imaging may soon provide an independent imaging technique as a reference standard.
Acknowledgments
National Institutes of Health; American Heart Association; Gordon and Betty Moore Foundation; Rudi Schulte Research Institutes.
References
- 1.Rosamond W, Flegal K, Friday G, Furie K, Go A, Greenlund K, Haase N, Ho M, Howard V, Kissela B, Kittner S, Lloyd-Jones D, McDermott M, Meigs J, Moy C, Nichol G, O’Donnell CJ, Roger V, Rumsfeld J, Sorlie P, Steinberger J, Thom T, Wasserthiel-Smoller S, Hong Y. Heart disease and stroke statistics—2007 update: a report from the American Heart Association Statistics Committee and Stroke Statistics Subcommittee. Circulation. 2007;115:e69–e171. doi: 10.1161/CIRCULATIONAHA.106.179918. [DOI] [PubMed] [Google Scholar]
- 2.Atherosclerosis. Heart and Stroke Encyclopedia. Vol. 2007. American Heart Association; 2007. [Google Scholar]
- 3.van Popele NM, Grobbee DE, Bots ML, Asmar R, Topouchian J, Reneman RS, Hoeks AP, van der Kuip DA, Hofman A, Witteman JC. Association between arterial stiffness and atherosclerosis: the Rotterdam Study. Stroke. 2001;32:454–460. doi: 10.1161/01.str.32.2.454. [DOI] [PubMed] [Google Scholar]
- 4.Thubrikar MJ, Robicsek F. Pressure-induced arterial wall stress and atherosclerosis. Ann Thorac Surg. 1995;59:1594–1603. doi: 10.1016/0003-4975(94)01037-d. [DOI] [PubMed] [Google Scholar]
- 5.DeBakey ME, Lawrie GM, Glaeser DH. Patterns of atherosclerosis and their surgical significance. Ann Surg. 1985;201:115–131. doi: 10.1097/00000658-198502000-00001. [DOI] [PMC free article] [PubMed] [Google Scholar]
- 6.Naghavi M, Libby P, Falk E, Casscells SW, Litovsky S, Rumberger J, Badimon JJ, Stefanadis C, Moreno P, Pasterkamp G, Fayad Z, Stone PH, Waxman S, Raggi P, Madjid M, Zarrabi A, Burke A, Yuan C, Fitzgerald PJ, Siscovick DS, de Korte CL, Aikawa M, Juhani Airaksinen KE, Assmann G, Becker CR, Chesebro JH, Farb A, Galis ZS, Jackson C, Jang IK, Koenig W, Lodder RA, March K, Demirovic J, Navab M, Priori SG, Rekhter MD, Bahr R, Grundy SM, Mehran R, Colombo A, Boerwinkle E, Ballantyne C, Insull W, Jr, Schwartz RS, Vogel R, Serruys PW, Hansson GK, Faxon DP, Kaul S, Drexler H, Greenland P, Muller JE, Virmani R, Ridker PM, Zipes DP, Shah PK, Willerson JT. From vulnerable plaque to vulnerable patient: a call for new definitions and risk assessment strategies: Part I. Circulation. 2003;108:1664–1672. doi: 10.1161/01.CIR.0000087480.94275.97. [DOI] [PubMed] [Google Scholar]
- 7.Schaar JA, De Korte CL, Mastik F, Strijder C, Pasterkamp G, Boersma E, Serruys PW, Van Der Steen AF. Characterizing vulnerable plaque features with intravascular elastography. Circulation. 2003;108:2636–2641. doi: 10.1161/01.CIR.0000097067.96619.1F. [DOI] [PubMed] [Google Scholar]
- 8.Schaar JA, Regar E, Mastik F, McFadden EP, Saia F, Disco C, de Korte CL, de Feyter PJ, van der Steen AF, Serruys PW. Incidence of high-strain patterns in human coronary arteries: assessment with three-dimensional intravascular palpography and correlation with clinical presentation. Circulation. 2004;109:2716–2719. doi: 10.1161/01.CIR.0000131887.65955.3B. [DOI] [PubMed] [Google Scholar]
- 9.Baldewsing RA, Schaar JA, Mastik F, Oomens CW, van der Steen AF. Assessment of vulnerable plaque composition by matching the deformation of a parametric plaque model to measured plaque deformation. IEEE Trans Med Imaging. 2005;24:514–528. doi: 10.1109/tmi.2005.844170. [DOI] [PubMed] [Google Scholar]
- 10.Lee RT, Loree HM, Cheng GC, Lieberman EH, Jaramillo N, Schoen FJ. Computational structural analysis based on intravascular ultrasound imaging before in vitro angioplasty: prediction of plaque fracture locations. J Am Coll Cardiol. 1993;21:777–782. doi: 10.1016/0735-1097(93)90112-e. [DOI] [PubMed] [Google Scholar]
- 11.Ohayon J, Teppaz P, Finet G, Rioufol G. In-vivo prediction of human coronary plaque rupture location using intravascular ultrasound and the finite element method. Coron Artery Dis. 2001;12:655–663. doi: 10.1097/00019501-200112000-00009. [DOI] [PubMed] [Google Scholar]
- 12.Li ZY, Howarth S, Trivedi RA, JMUK-I, Graves MJ, Brown A, Wang L, Gillard JH. Stress analysis of carotid plaque rupture based on in vivo high resolution MRI. J Biomech. 2006;39:2611–2622. doi: 10.1016/j.jbiomech.2005.08.022. [DOI] [PubMed] [Google Scholar]
- 13.Younis HF, Kaazempur-Mofrad MR, Chan RC, Isasi AG, Hinton DP, Chau AH, Kim LA, Kamm RD. Hemodynamics and wall mechanics in human carotid bifurcation and its consequences for atherogenesis: investigation of inter-individual variation. Biomech Model Mechanobiol. 2004;3:17–32. doi: 10.1007/s10237-004-0046-7. [DOI] [PubMed] [Google Scholar]
- 14.Aletras AH, Ding S, Balaban RS, Wen H. Displacement encoding in cardiac functional MRI. Proceedings of the 6th Annual Meeting of ISMRM; Sydney, Australia. 1998. (Abstract 281) [Google Scholar]
- 15.Aletras AH, Balaban RS, Wen H. High-resolution strain analysis of the human heart with fast-DENSE. J Magn Reson. 1999;140:41–57. doi: 10.1006/jmre.1999.1821. [DOI] [PubMed] [Google Scholar]
- 16.Aletras AH, Ding S, Balaban RS, Wen H. DENSE: displacement encoding with stimulated echoes in cardiac functional MRI. J Magn Reson. 1999;137:247–252. doi: 10.1006/jmre.1998.1676. [DOI] [PMC free article] [PubMed] [Google Scholar]
- 17.Soellinger M, Rutz AK, Kozerke S, Boesiger P. Time-resolved, three-dimensional brain motion measurements using 3D-DENSE. Proceedings of the 15th Annual Meeting of ISMRM; Berlin, Germany. 2007. (Abstract 3005) [Google Scholar]
- 18.Wen H, Vignaud A, Rodriquez I. Regional strain mapping of the carotid artery wall in Humans using DENSE. MAGMA. 2005;18:S60–S61. [Google Scholar]
- 19.Aletras AH, Wen H. Mixed echo train acquisition displacement encoding with stimulated echoes: an optimized DENSE method for in vivo functional imaging of the human heart. Magn Reson Med. 2001;46:523–534. doi: 10.1002/mrm.1223. [DOI] [PMC free article] [PubMed] [Google Scholar]
- 20.Bennett E, Pai VM, Wen H. Ultrafast dense technique for mapping the volumetric 3D wall motion of the left ventricle. Proceedings of the 10th Annual Meeting of ISMRM; Honolulu, HI, USA. 2002. (Abstract 775) [Google Scholar]
- 21.Kim D, Kellman P. Improved cine displacement-encoded MRI using balanced steady-state free precession and time-adaptive sensitivity encoding parallel imaging at 3 T. NMR Biomed. 2007;20:591–601. doi: 10.1002/nbm.1126. [DOI] [PubMed] [Google Scholar]
- 22.Wen H, Rodriquez I, Bennett E, Vignaud A. Optimization of DENSE Sequence for imaging regional strain distribution in the carotid artery wall and preliminary tests in humans. J Cardiovasc Magn Reson. 2006;8:153–154. [Google Scholar]
- 23.Callot V, Bennett E, Decking UK, Balaban RS, Wen H. In vivo study of microcirculation in canine myocardium using the IVIM method. Magn Reson Med. 2003;50:531–540. doi: 10.1002/mrm.10568. [DOI] [PMC free article] [PubMed] [Google Scholar]
- 24.Epstein FH, Gilson WD. Displacement-encoded cardiac MRI using cosine and sine modulation to eliminate (CANSEL) artifact-generating echoes. Magn Reson Med. 2004;52:774–781. doi: 10.1002/mrm.20232. [DOI] [PubMed] [Google Scholar]
- 25.Bennett E, Spottiswoode B, Lorenz CH, Wen H. Optimal combination of phase cycling and gradient spoiling in DENSE displacement mapping. Proceedings of the 14th Annual Meeting of ISMRM; Seattle, WA, USA. 2006. (Abstract 1649) [Google Scholar]
- 26.Fung YC. Biomechanics: mechanical properties of living tissues. New York: Springer-Verlag; 1993. p. 568. [Google Scholar]
- 27.Crowe LA, Ariff B, Keegan J, Mohiaddin RH, Yang GZ, Hughes AD, Mc GTSA, Firmin DN. Comparison between three-dimensional volume-selective turbo spin-echo imaging and two-dimensional ultrasound for assessing carotid artery structure and function. J Magn Reson Imaging. 2005;21:282–289. doi: 10.1002/jmri.20257. [DOI] [PubMed] [Google Scholar]
- 28.Leeson CP, Robinson M, Francis JM, Robson MD, Channon KM, Neubauer S, Wiesmann F. Cardiovascular magnetic resonance imaging for non-invasive assessment of vascular function: validation against ultrasound. J Cardiovasc Magn Reson. 2006;8:381–387. doi: 10.1080/10976640500526993. [DOI] [PubMed] [Google Scholar]
- 29.Oyre S, Ringgaard S, Kozerke S, Paaske WP, Erlandsen M, Boesiger P, Pedersen EM. Accurate noninvasive quantitation of blood flow, cross-sectional lumen vessel area and wall shear stress by three-dimensional paraboloid modeling of magnetic resonance imaging velocity data. J Am Coll Cardiol. 1998;32:128–134. doi: 10.1016/s0735-1097(98)00207-1. [DOI] [PubMed] [Google Scholar]
- 30.Riley WA, Evans GW, Sharrett AR, Burke GL, Barnes RW. Variation of common carotid artery elasticity with intimal-medial thickness: the ARIC Study. Atherosclerosis Risk in Communities. Ultrasound Med Biol. 1997;23:157–164. doi: 10.1016/s0301-5629(96)00211-6. [DOI] [PubMed] [Google Scholar]
- 31.Dijk JM, Algra A, van der Graaf Y, Grobbee DE, Bots ML. Carotid stiffness and the risk of new vascular events in patients with manifest cardiovascular disease. The SMART study. Eur Heart J. 2005;26:1213–1220. doi: 10.1093/eurheartj/ehi254. [DOI] [PubMed] [Google Scholar]
- 32.Safar ME, Blacher J, Mourad JJ, London GM. Stiffness of carotid artery wall material and blood pressure in humans: application to antihypertensive therapy and stroke prevention. Stroke. 2000;31:782–790. doi: 10.1161/01.str.31.3.782. [DOI] [PubMed] [Google Scholar]
- 33.Roman MJ, Devereux RB, Schwartz JE, Lockshin MD, Paget SA, Davis A, Crow MK, Sammaritano L, Levine DM, Shankar BA, Moeller E, Salmon JE. Arterial stiffness in chronic inflammatory diseases. Hypertension. 2005;46:194–199. doi: 10.1161/01.HYP.0000168055.89955.db. [DOI] [PubMed] [Google Scholar]
- 34.Scuteri A, Brancati AM, Gianni W, Assisi A, Volpe M. Arterial stiffness is an independent risk factor for cognitive impairment in the elderly: a pilot study. J Hypertens. 2005;23:1211–1216. doi: 10.1097/01.hjh.0000170384.38708.b7. [DOI] [PubMed] [Google Scholar]
- 35.Ribbers H, Lopata RG, Holewijn S, Pasterkamp G, Blankensteijn JD, de Korte CL. Noninvasive two-dimensional strain imaging of arteries: validation in phantoms and preliminary experience in carotid arteries in vivo. Ultrasound Med Biol. 2007;33:530–540. doi: 10.1016/j.ultrasmedbio.2006.09.009. [DOI] [PubMed] [Google Scholar]