

Abstract
The multicopper oxidase Fet3p catalyzes the four-electron reduction of dioxygen to water, coupled to the one-electron oxidation of four equivalents of substrate. To carry out this process the enzyme utilizes four Cu atoms: a type 1, a type 2, and a coupled binuclear, type 3 site. Substrates are oxidized at the T1 Cu, which rapidly transfers electrons, 13 Å away, to a trinuclear copper cluster composed of the T2 and T3 sites where dioxygen is reduced to water in two sequential 2e− steps. This study focuses on two variants of Fet3p, H126Q and H483Q, that perturb the two T3 Cu's, T3α and T3β, respectively. The variants have been isolated in both holo and type 1 depleted (T1D) forms, T1DT3αQ and T1DT3βQ, and their trinuclear copper clusters have been characterized in their oxidized and reduced states. While the variants are only mildly perturbed relative to T1D in the resting oxidized state, in contrast to T1D they are both found to have lost a ligand in their reduced states. Importantly, T1DT3αQ reacts with O2 but T1DT3βQ does not. Thus loss of a ligand at T3β, but not at T3α, turns off O2 reactivity, indicating that T3β and T2 are required for the 2e− reduction of O2 to form the peroxide intermediate (PI), whereas T3α remains reduced. This is supported by the spectroscopic features of PI in T1DT3αQ, which are identical to T1D PI. This selective redox activity of one edge of the trinuclear cluster demonstrates its asymmetry in O2 reactivity. The structural origin of this asymmetry between the T3α and T3β is discussed as is its contribution to reactivity.
1. Introduction
Nature has evolved two enzymatic systems capable of reducing dioxygen by four electrons to water, the multicopper oxidases (MCOs) and cytochrome c oxidase.1 This process is coupled to proton pumping and ATP synthesis in cytochrome c oxidase, while in the MCO's, which are the focus of this study, it is coupled to the one-electron oxidation of four equivalents of substrate. The MCO family can be divided into two groups based upon the nature of their substrates. The first oxidizes organic substrates, and includes the plant and fungal laccases,2,3 ascorbate oxidase,4 and CotA.5 The second group oxidizes metal ions: Fet3p6 and ceruloplasmin,7 which are ferroxidases, CueO,8 and MnxG.9
The MCO's require a minimum of four Cu ions, which are classified into three types based upon their spectroscopic properties.1,10 A type 1 (T1), or blue Cu center, is coordinated by two His, one Cys, and in some cases an axial Met ligand in a trigonally distorted tetrahedral geometry. T1 Cu(II) is characterized by an intense Cys-S to Cu(II) charge transfer (CT) transition at ~600 nm in its absorption (Abs) spectrum and a small hyperfine splitting in its electron paramagnetic resonance (EPR) spectrum (30–100 × 10−4 cm−1).11 Type 2 (T2), or normal, Cu(II) is coordinated in a T-shaped geometry by two His and a hydroxide ligand. It does not have any characteristic features in the near UV and visible region of the Abs spectrum and has a typical tetragonal Cu hyperfine splitting in EPR (150–200 × 10−4 cm−1).12,13 The T3, or coupled binuclear, Cu pair is coordinated by three His residues on each of the two Cu atoms, denoted T3α and T3β, respectively, and is bridged by a hydroxide ligand. The site is characterized by the bridging hydroxide to Cu(II) CT transition at 330 nm and is antiferromagnetically coupled via this bridging hydroxide, leading to an S = 0 ground state.12,13 Spectroscopic studies have shown that the T2 and T3 Cu sites are in close proximity to each other and together form a trinuclear cluster.14,15 This was later confirmed by crystallographic studies.16 Intermolecular e-transfer from substrates occurs to the T1 Cu site followed by intramolecular e-transfer via a T1 Cu(II)-Cys-His-Cu(II)T3 electron transfer (ET) pathway, to the trinuclear cluster where O2 is reduced to H2O.17
The molecular mechanism of O2 reduction to H2O by the MCO's has been elucidated through a combination of spectroscopic, kinetic, and theoretical studies.17 When all four Cu sites of the MCO are reduced, O2 is reduced in two, two-electron steps, the first generating a peroxide intermediate (PI) and the second generating the native intermediate (NI).18 The first two-electron reduction is rate limiting while the conversion of PI to NI is very fast in the holo enzyme, >350 s−1, making reduction of O2 effectively a four-electron process.19 As a result, in the holo enzyme PI cannot be trapped. However, when the T1 Cu is removed through chemical replacement with a redox inactive mercuric ion20 or biochemical substitution of the Cys ligand with a Ser,21 PI conversion to NI is decreased by a factor of >106, allowing PI to be trapped for spectroscopic characterization. These studies have shown the trinuclear cluster in PI to have two Cu atoms that are oxidized and antiferromagnetically coupled, one Cu that is reduced, and peroxide bridging all three Cu atoms in the cluster.22,23 NI has been trapped and characterized in the holo form of the enzyme. It is fully oxidized, thus all four Cu atoms have transferred their electrons to O2,24 with the dioxygen reduction products remaining bound to the trinuclear cluster as briding μ3-oxo and μ2-hydroxo ligands.25,26 In the absence of reductant, NI decays to the resting oxidized form of the enzyme.27,28 However, decay of NI is slower than the rate of turnover and thus cannot be catalytically relevant.26 Therefore, NI is the catalytically relevant, fully oxidized form of the MCO's, and is rapidly reduced in the catalytic cycle.
The role played by each of the three Cu's of the trinuclear cluster in the catalytic cycle remains to be elucidated. The studies that have been done in this regard has focused primarily on the type 2 depleted (T2D) form of laccase,29 the impact of second coordination sphere residues near the trinuclear cluster,30,31 and computational studies of the mechanism of dioxygen reduction. In T2D laccase, there is only a binuclear T3 Cu site remaining at the trinuclear cluster, making it similar to other binuclear T3 Cu containing enzymes such as hemocyanin.1 However, while the T3 site in hemocyanin has been shown to reversibly bind O2 as peroxide,32,33 the reduced T3 site in T2D laccase does not react with O2.29,34 As mentioned above, studies have also focused on the impact of second coordination sphere residues, specifically D94 (located on the edge of the trinuclear cluster between the T2 and the T3β Cu(II)) and E487 (located near the two T3 Cu's) which are shown in Figure 1. A mutant study has shown that the D94 carboxylate is required for reaction of the trinuclear cluster with O2 and that E487 donates a proton during reductive cleavage of the O-O bond.30,31 Computational studies have proposed that the T2 and T3β Cu's are involved in the first step of O2 reduction but this has not been experimentally confirmed.35
Figure 1.

Active site structure of a resting oxidized MCO. The His residues that are the focus of this study are depicted in red, and other Cu coordinating residues in green. (Structure is obtained from resting oxidized ascorbate oxidase16 and amino acid numbers correlate to Fet3p36, which does not have a resting oxidized crystal structure.)
In this study we use mutagenesis to systematically perturb the trinuclear cluster in Fet3p, to experimentally evaluate the specific role of each Cu in O2 reactivity. There are eight His residues coordinating the three Cu's of the trinuclear cluster, as shown in Figure 1.36 Each has now been individually mutated to Gln with the goal of creating a perturbed, but stable and intact trinuclear cluster. Gln was chosen as the replacement for His in order to minimize disruption of the trinuclear cluster, as it does not introduce charge, is similar in size to His, and has the ability to coordinate to Cu through its carbonyl oxygen, a weaker potential Cu ligand. Of the eight mutants screened below, three have intact trinuclear cluster's and were also isolated in their type 1 depleted (T1D) forms to eliminate the intense spectroscopic features of the T1 Cu. Two of them, T1DH483Q and T1DH418Q, coordinate the T3β Cu and the other, T1DH126Q, coordinates the T3α Cu. The geometric and electronic structures of the resting oxidized and reduced trinuclear cluster's have been spectroscopically characterized, and their differences in O2 reactivity have been defined, and correlated with these structural pertubations. These studies demonstrate the asymmetry of the trinuclear cluster with respect to each Cu's contribution to the O2 reactivity and suggest possible structural origins and functional contributions of this asymmetry.
2. Experimental
Water was purified to a resistivity of 15 – 17 MΩ cm−1 using a Barnstead Nanopure deionizing system. All chemicals were of reagent grade and used without further purification. The mutant FET3 alleles were constructed directly in pDY148 by site directed mutagenesis using the QuickChange kit from Strategene. T1D, H81Q, H416Q, H83Q, H126Q, H485Q, H418Q, H128Q, and H483Q mutants were generated using complementary primers in PCR amplification of the vector. The following double mutants (T1D, indicating removal of the T1 Cu, and mutation of a trinuclear cluster residue) were generated in two sequential rounds of mutagenesis: T1DH126Q, T1DH418Q, and T1DH483Q. Sequences of Fet3p mutants were confirmed by automated fluorescence sequencing using an ABI PRISM 377 instrument. The vectors expressing the mutant proteins were transformed into yeast strain M2* for soluble protein expression. Then WT, T1D, H81Q, H416Q, H83Q, H126Q, T1DH126Q, H485Q, H418Q, T1DH418Q, H128Q, H483Q and T1DH483Q mutant proteins were expressed, isolated, and purified as previously described.37,38
Prior to characterization, protein samples were oxidized to the fullest extent possible using up to 30-fold excess of H2O2, at which point the protein starts to denature. Protein concentrations were determined using the Bradford dye-binding assay,39 and copper content was determined spectrophotometrically with 2,2-biquinoline.40 Spin quantitation of EPR spectra used a 1.0 mM CuSO4·5H2O, 2 mM HCl, and 2 M NaClO4 standard solution to determine the concentration of paramagnetic copper.41
UV–visible absorption spectra were obtained with an Agilent 8453 diode array spectrophotometer. EPR spectra were obtained with a Bruker EMX spectrometer, an ER 041 XG microwave bridge, and an ER 4102ST cavity. A sample temperature of 77 K was maintained using a liquid nitrogen finger dewar. EPR simulations were done using XSophe (Bruker). UV–visible circular dichroism (CD), at room temperature, and magnetic circular dichroism (MCD), at 5 K, were measured with a Jasco J-810-150S spectrapolarimeter coupled with an S-20 photomultiplier tube and an Oxford SM4000-8T magnet. For measurements in the near-IR region, CD and MCD spectra were measured with either a Jasco 200-D or J-730 spectrapolarimeter and a liquid nitrogen cooled InSb detector with either an Oxford SM4000-7T or SM40008T magnet. Protein samples were buffer exchanged into 100 mM deuterated potassium phosphate at pD 7.5 for CD and then mixed with 50% (v/v) glycerol-d3, to obtain high quality glasses for MCD. CD spectra were measured in a 1.0 or 0.5 cm quartz cuvette. MCD spectra were measured using cells fitted with two quartz disks and a 3-mm rubber spacer. Zero-field baseline effects were eliminated in MCD by taking an average of the +7 T and −7 T scans, [7 – (−7)]/2 T. Gaussian fitting of the absorption, CD, and MCD data was done using PeakFit 4.0 (Jandel).
Cu K-edge X-ray absorption spectra were measured at the Stanford Synchrotron Radiation Lightsource (SSRL) on the focused 16-pole, 2.0-T wiggler beam line 9–3 under standard ring conditions of 3 GeV and 85–100 mA. A Si(220) double crystal monochromator was used for energy selection. A Rh-coated collimating premonochromator mirror was used for harmonic rejection, while a cylindrical Rh-coated bent post-monochromator mirror was used for focusing. The protein samples were prepared as solutions with ~20% glycerol and loaded into 1 mm Lucite XAS cells with 38 μm Kapton windows. The samples were immediately frozen and stored under liquid nitrogen. The samples were maintained at a constant temperature of ~10 K during data collection using an Oxford Instruments CF 1208 continuous flow liquid helium cryostat. Data were measured in fluorescence mode using a Canberra Ge 30-element array detector. Internal energy calibration was accomplished by simultaneous measurement of the absorption of a Cu-foil placed between two ionization chambers situated after the sample. The first inflection point of the foil spectrum was assigned to 8980.3 eV. The energy-calibrated data from 8675 to 9350 eV (k = 9.5 Å−1) were processed by fitting a second-order polynomial to the pre-edge region and subtracting this from the entire spectrum as a background. A one-region spline of order 2 was used to model the smoothly decaying post-edge region background. Normalization of the data was achieved by scaling the spline function and data such that the value of the spline equals 1.0 at 9000 eV. This background subtraction and normalization was done using PySpline.42 For each sample, several scans from 8675–9350 eV were collected and normalized in PySpline. Several faster scans starting from 8970 eV with shorter energy range were also collected for the oxidized samples to reduce photoreduction in the beam. Subsequent scans collected over time on the same sample spot revealed an isosbestic point around ~8994 eV. The post-edge of the shorter scans were normalized in KaleidaGraph by maintaining the same isosbestic point as the data normalized using PySpline of the longer scans from 8675–9350 eV. The pre-edge of the shorter scans were processed to match the pre-edge of the longer PySpline-processed data. Data presented here are the first scans of each data set to eliminate spectral changes from photoreduction.
For single turnover reactions with O2, protein solutions were first deoxygenated on a Schlenk line and then transferred to an N2 atmosphere glove box where they were reduced with a 10-fold excess of sodium dithionite over protein. Excess dithionite was then washed out with pH 6 MES buffer using 30,000 MW cutoff Amicon concentrators. The protein was then reacted with an equal volume of oxygen saturated buffer to achieve final protein concentrations of ~200 μM and O2 concentrations of ~500 μM.
Reduction titrations were performed by adding 2.5 μL of a concentrated stock solution of sodium dithionite, dissolved in pH 6 MES buffer, into 200 μL of a deoxygenated 200 μM solution of protein, also in pH 6 MES buffer. The reaction of protein with sodium dithionite was allowed to reach equilibrium and then absorption and EPR spectra were measured using an anaerobic cuvette and EPR tube, respectively. A fresh solution of dithionite was used for each titration point.
3. Results and Analysis
3.1 Isolation and Analysis of Fet3p Variants
3.1a Holo Variants
Each of the eight His residues coordinating the trinuclear cluster Cu sites in Fet3p (Figure 1) was mutated to Gln, generating the following variants: H81Q, H416Q, H83Q, H126Q, H485Q, H418Q, H128Q, and H483Q. Like wild type Fet3p (WT), H126Q, H418Q, and H483Q all load a full compliment of ~4 Cu's per protein (Table 1) and the protein yield was similar to that previously reported for Fet3p variants.43 H81Q and H485Q load only ~3 Cu's per protein. H83Q and H128Q both load ≤ 3 Cu's and purify with an extremely low yield, while H416Q did not yield protein. To evaluate the role of each of the Cu sites in the trinuclear cluster, only the mutants that load a full compliment of four Cu's, H126Q, H483Q, and H418Q, were selected for further study.
Table 1.
Cu quantitation of Fet3p variants
| Mutation | Quantitation | Analysis | ||||
|---|---|---|---|---|---|---|
| Fet3p Variant | Cu Site Mutated | Cu/Proteina | Spins/Proteinb | Reduced Cu/proteinc | T1 Cu | trinuclear cluster |
| WT | NA | 4.2 | 1.8 | 0 | Cu(II) | 3 × Cu(II) |
| H81Q | T2 | 3.0 | NA | NA | NA | NA |
| H416Q | T2 | NA | NA | NA | NA | NA |
| H83Q | T3α | 2.7 | NA | NA | NA | NA |
| H126Q | T3α | 3.6 | 1.6 | 0 | Cu(II) | 3 × Cu(II) |
| H485Q | T3α | 3.2 | NA | NA | NA | NA |
| H418Q | T3β | 3.8 | 1.8 | 2 | Cu(II) | 1 × Cu(II), 2 × Cu(I) |
| H128Q | T3β | 2.8 | NA | NA | NA | NA |
| H483Q | T3β | 3.9 | 1.2 | 3 | Cu(II) | 3 × Cu(I) |
| T1DWT | NA | 3.2 | 1.1 | 0 | NA | 3 × Cu(II) |
| T1DH126Q | T3α | 2.8 | 0.9 | 0 | NA | 3 × Cu(II) |
| T1DH418Q | T3β | 2.6 | 0.9 | 2 | NA | 1 × Cu(II), 2 × Cu(I) |
| T1DH483Q | T3β | 2.6 | 0.7 | 0.3 – 0.5 | NA | 3 × Cu(II) |
biquiniline assay
spin quantification of EPR
XAS K-edge.
EPR, Abs, and Cu K-edge XAS were used to verify the presence of and determine the oxidation state of each of the four Cu atoms in the variants (after reaction with < 30-fold excess H2O2 to assure oxidation of all Cu capable of being oxidized). Spin quantification of the EPR spectrum of WT demonstrates that this protein has ~2 spins/protein molecule (the T1 and T2 Cu sites). Spin quantification values for H126Q and H418Q are also ~2 spins/protein, while H483Q exhibits ~1 spin/protein (Table 1 and Supporting Information, Figure S1A). The Abs spectrum of WT and all three variants contains the Cys-S to Cu(II) CT transition at ~600 nm with ε ≅ 5,000 M−1 cm−1 characteristic of the T1 Cu(II) (Supporting Information, Figure S1B). This confirms that the single spin in H483Q is on the T1 Cu(II). As mentioned in the Introduction, the oxidized T3 site is characterized by a CT transition at 330 nm (ε ≅ 5,000 M−1 cm−1). This is present in both WT and H126Q, but not in H418Q or H483Q (Supporting Information, Figure S1B). Cu K-edge XAS was used to quantify the amount of reduced Cu remaining in the four protein species even after peroxide treatment. Both WT and H126Q were found to be fully oxidized, while H418Q and H483Q contained two and three reduced Cu's, respectively, which are consistent with the EPR spin quantifications and Abs spectra (Table 1 and Supporting Information, Figure S2). Therefore, peroxide-treated WT and H126Q have all four Cu's oxidized H418Q has two reduced and one oxidized Cu atoms in the trinuclear cluster, and an oxidized T1 Cu; and H483Q has a completely reduced trinuclear cluster and an oxidized T1 Cu (Table 1, Analysis columns).
3.1b T1D Variants
WT and the three variants that were fully loaded with Cu were also prepared in the T1D form, in which the T1 Cu Cys ligand is mutated to Ser (C484S), rendering this site unable to bind the T1 Cu.21 The T1DWT, T1DH126Q, T1DH418Q, and T1DH483Q species were all found to load ~3 Cu's/protein indicating that the only difference between these and the above Fet3p forms was the lack of the T1Cu(II) as expected. Correspondingly, the EPR spectra of all four species spin quantitate to ~1 spin/protein (Table 1 and Figure 2). Cu K-edge XAS of T1DWT, T1DH126Q, and T1DH483Q indicate that all Cu sites were oxidized (a small amount of reduced Cu, ~10–17% of total Cu, is present in T1DH483Q), while T1DH418Q has 2 reduced Cu/protein (Table 1, Figure 3). It is worth noting that T1DH483Q purifies (no peroxide treatment) with a close to fully oxidized trinuclear cluster, while holo H483Q is isolated with the trinuclear cluster fully reduced; possibly a result of the fact that physiological reductants, most likely Fe(II), can no longer reduce the trinuclear cluster when the T1 is not present. This study focuses on T1DWT (referred to hereon as T1D), T1DH126Q (T1DT3αQ), and T1DH483Q (T1DT3βQ). H418Q, that has a Gln at the T3β site in parallel to H483Q, could only be obtained with two Cu's of its trinuclear cluster reduced. When fully reduced, it exhibits reactivity similar to H483Q. Its further characterization is presented in Supporting Information, Figure S3.
Figure 2.

X-band EPR spectra of T1D (red), T1DH126Q (blue), T1DH483Q (green) and T1DH418Q (black). * denotes a small amount (<10 % of total paramagnetic Cu by EPR simulation) of extraneously bound Cu in T1D and T1DH483Q. All spectra were obtained at 9.4 GHz microwave frequency, 10 mW microwave power, 100 kHz modulation frequency, 20 G modulation amplitude, 327 ms time constant, and 81.92 ms conversion time
Figure 3.

Cu K-edge XAS of T1D (A), T1DH126Q (B), T1DH483Q (C), and T1DH418Q (D) with data in red and fits in blue. T1D and T1DH126Q do not show a peak at 8984 eV, indicative of their trinuclear cluster being fully oxidized, which is consistent with Abs and EPR spin quantitation, and are fit with three Cu(II) sites. Each spectrum is simulated with 33% CuFe(fsaen)Cl2.5H2O34 (for T2 Cu) and 67% methemocyanin55 (for T3 Cu's) to give a total of 3 × Cu(II) sites. T1DH483Q and T1DH418Q do show peaks at 8984 eV indicative of reduced Cu. T1DH483Q photoreduces rapidly in the synchrotron beam. Its spectrum can be fit with 0.5 × 2-coordinate Cu(I) (17% [Cu2(EDTB)](ClO4)234 and 83% T1D), which is slightly greater than the ~0.3 × Cu(I) from spin quantitation of EPR and Abs intensity. T1DH418Q is fit with ~2 × 3-coordinate Cu(I) (60% Cu2ISOIM(t-Bu)2(pz)34) and ~1 × Cu(II) (40% T1D). This is consistent with EPR spin quantitation and Abs.
3.2 Spectroscopic Characterization of the trinuclear cluster
3.2a Oxidized T3 Cu Site: Absorption and CD
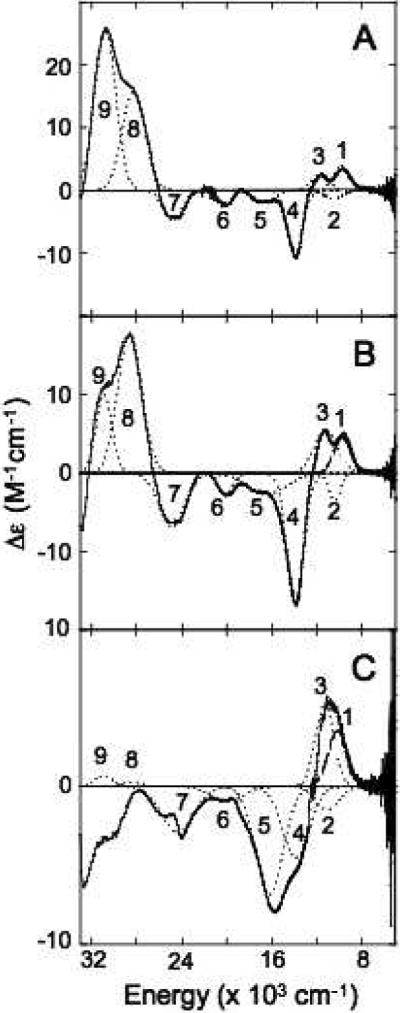
The T3 Cu site is antiferromagnetically coupled with an S = 0 ground state. Consequently, it is silent in EPR and LTMCD. However, previous studies have shown that its spectroscopic features can be observed in Abs and CD, along with those of the T1 Cu, which is not present in T1D variants.12,23 (While the T2 Cu exhibits CT and LF transitions, they are much weaker than those of the T3 Cu's and cannot be distinguished in Abs and CD.12) Figure 4 shows the Abs and CD spectra and Table 2 the energies of individual Gaussian bands for T1D, T1DT3αQ, and T1DT3βQ. The Abs spectrum of T1D is dominated by an intense (ε ~ 5000 M−1cm−1) band at ~30,300 cm−1, which has been assigned as a CT transition from the bridging hydroxide ligand to the oxidized T3 Cu's. In the CD spectrum this band can be further resolved into two CT transitions (bands 8 and 9), one to each of the two T3 Cu's.13 Clearly the hydroxide bridge has remained intact in both variants, as their Abs spectra contain CT transitions at similar energy and intensity to T1D. In the CD spectra, however, differences in the energy and intensity of bands 8 and 9, as well as 7 (a His to T3Cu(II) CT13) are observed, indicating that the ligand fields of the T3 Cu's have been slightly perturbed in the variants. These differences are particularly noticeable in T1DT3β, where bands 7 and 8 shift down in energy by ~1000 cm−1. Based on this, bands 7 and 8 are assigned as His and hydroxide to T3β Cu(II) CT transitions and band 9 as a hydroxide to T3α Cu(II) CT transition.
Figure 4.

Room temperature absorption spectra of T1D (A), T1DT3αQ (B), and T1DT3βQ (C) and room temperature CD spectra of T1D (D), T1DT3αQ (E), and T1DT3βQ (F). Individual Gaussian bands from a simultaneous fit of Abs and CD are shown in dotted lines and energies are provided in Table 2.
Table 2.
Simultaneous Gaussian fit parameters for Abs and CD spectra.
| transitiona | T1D energy (cm−1) | T1DT3αQ energy (cm−1) | T1DT3βQ energy (cm−1) |
|---|---|---|---|
| 1-LF | (+) 10200 | (+) 10170 | (+) 10000 |
| 2-LF | (−) 12500 | (−) 12300 | (−) 12560 |
| 3-LF | (+) 14080 | (+) 14800 | (+) 14100 |
| 4-LF | (−) 15120 | (−) 15300 | (−) 15190 |
| 5-LF | (+) 17300 | (+) 17460 | (+) 16630 |
| 6-LF | (+) 19630 | (+) 19700 | (+) 18950 |
| 7-His π CT | (−) 24770 | (−) 24700 | (−) 23440 |
| 8-μOH CT | (+) 28000 | (+) 28000 | (+) 26950 |
| 9-μOH CT | (−) 30400 | (−) 30350 | (−) 30650 |
Assigned from reference 30.
A second band can be observed in the Abs spectrum of T1D and both variants at ~14,300 cm−1 with ε ~ 800 M−1cm−1 (Figure 4 A–C, bands 1–6) due to the LF transitions of the T3 Cu's. The magnetic dipole selection rules and signs in CD spectroscopy result in the LF transitions being more intense and more easily resolved than in Abs. There are six LF transitions, bands 1–6, required to fit the CD spectra below 22,000 cm−1 (Figure 4 D–F and Table 2).13 The shapes of the spectra are similar in this region, indicating that the coordination number and geometry of the oxidized T3 sites have not been changed significantly in the variants relative to T1D, and that the new Gln ligand in both of the variants must be coordinating to Cu(II). However, small perturbations are apparent. Based on simultaneous fits of the Abs and CD spectra, in T1DT3βQ bands 5 and 6 (Figure 4F) shift down in energy by ~700 cm−1 and band 1 shows a large increase in intensity. This indicates that bands 1, 5 and 6 are LF transitions of the T3β Cu. Given the similarity in energy and intensity of bands 2, 3, and 4 in T1DT3αQ and T1DT3bQ relative to T1D, they cannot be assigned to a specific T3 Cu.
3.2b Oxidized T2 Cu Site: EPR and MCD
As mentioned above, in T1D and the two variants the T3 Cu hydroxide bridge is intact, which results in an EPR silent, S = 0 ground state. Consequently, removal of the T1 Cu atom allows the remaining paramagnetic T2 Cu atom to probed by EPR. The X-band EPR spectra of T1D, T1DT3αQ, and T1DT3βQ are presented in Figure 2 and parameters from simulations of these spectra are given in Table 3 (Simulated EPR spectra are shown in Supporting Information, Figure S4). All three spectra are typical of T2 or normal Cu sites with gz > gx,y > 2.00, indicative of a dx2–y2 ground state. While the overall features of both variants are similar to T1D, slight increases in g-values are observed; more so for T1DT3βQ than T1DT3αQ (Table 3). This is indicative of either a decrease in the LF strength at the T2 Cu site, or a decrease in metal-ligand covalency (increase in metal character in the LF orbitals). From MCD, the changes in LF strength of the T2 Cu(II) site are not sufficient to account for the changes in g-value for either variant (vide infra), suggesting that the covalency of the T2 Cu sites has decreased in the variants relative to T1D. Both variants also show a small decrease in their hyperfine coupling constants (A values) compared to T1D, as shown in Table 3, again a larger effect for T1DT3βQ than T1DT3αQ. This is accounted for by the small increase in g-values, which increases the orbital dipolar contribution (which is positive) to the A-value (which is negative), resulting in a decrease of the A-values. If the other contributions to the A value remain constant, the changes in g-value do quantitatively agree with the observed decrease in A values for both T1DT3αQ and T1DT3βQ. It is important to note that these small changes to the T2 Cu reflect the interconnectivity of the trinuclear cluster. Residues H126 (T3α) and H483 (T3β) are connected to the T2 through similar H-bonds to its His ligands. Furthermore, one of the T3β ligands, H418, has an H-bond to residue D94 (Figure 1), mutations of which have been shown to perturb the T2 Cu site.30 This likely accounts for the larger change observed in T1DT3βQ relative to T1DT3αQ, and for the LF and CT transition changes at the T2 Cu associated with perturbation of the T3β Cu, presented below.
Table 3.
EPR simulation parameters, A values are reported as absolute values and in units of ×10−4 cm−1. (Simulated spectra are provided in Supporting Information, Figure S4.)
| T1D | T1DT3αQ | T1DT3βQ | |
|---|---|---|---|
| gx | 2.041 | 2.052 | 2.058 |
| gy | 2.055 | 2.063 | 2.065 |
| gz | 2.243 | 2.253 | 2.274 |
| Ax | 15 | 8 | 8 |
| Ay | 17 | 10 | 10 |
| Az | 190 | 183 | 175 |
Low temperature magnetic circular dichroism (MCD) spectroscopy follows C-term selection rules and specifically probes the paramagnetic T2 Cu(II) site over the antiferromagnetically coupled, diamagnetic T3 Cu(II) site. The MCD spectra of T1D, T1DT3αQ, and T1DT3βQ are shown in Figure 5 (Gaussian fit parameters are summarized in Table 4). Bands 1–4 are the four LF transitions of the T2 Cu site44 and are at similar energies in T1D and the variants, indicating that the T2 Cu geometry has not changed significantly. Band 3 shifts slightly down in energy in both variants, reflecting the similar H-bonds between the mutated residues and the T2 ligands. The larger change in shape of the LF region of the MCD spectrum of T1DT3βQ, relative to that of T1DT3αQ, can be accounted for by the shift up in energy of bands 1 and 2, and, as mentioned above, is likely a result of the perturbation of the H-bond network from the T3β Cu to the T2 Cu through D94.30
Figure 5.
MCD Spectra of T1D (A), T1DT3αQ (B), and T1DT3βQ (C) obtained at 5 K and 7T. Individual Gaussian fit bands are shown in dotted black lines and energies are provided in Table 4.
Table 4.
Gaussian fit energies for MCD spectra.
| transitiona | T1D energy (cm−1) | T1DT3αQ energy (cm−1) | T1DT3βQ energy (cm−1) |
|---|---|---|---|
| 1-xy | (+) 9800 | (+) 9770 | (+) 10160 |
| 2-z2 | (−) 10540 | (−) 10400 | (−) 11063 |
| 3-xz | (+) 11700 | (+) 11210 | (+) 11296 |
| 4-yz | (−) 13940 | (−) 13890 | (−) 13837 |
| 5-His π | (−) 16700 | (−) 16440 | (−) 16200 |
| 6-OH π | (−) 20140 | (−) 20100 | (−) 19940 |
| 7-His π | (−) 24800 | (−) 24870 | (−) 24270 |
| 8-His π | (+) 28270 | (+) 28620 | (+) 28400 |
| 9-His π | (+) 30800 | (+) 30910 | (+) 31000 |
Assigned from reference 30.
Bands 5, and 7–9 in the MCD spectrum are His π to T2 Cu(II) CT transitions and band 6 is a hydroxide π to T2 Cu(II) CT transition.44 These bands are found at similar energy in T1DT3αQ relative to T1D. The most obvious difference is a decrease in intensity around 31,000 cm−1. Considering the change in g-values, observed in EPR, changes in the MCD spectrum are not surprising. The CT region of the MCD spectrum of T1DT3βQ exhibits larger differences relative to T1D. The CT transitions shift in energy by a small amount but show a fairly large redistribution of intensity, with band 5 increasing and bands 6–9 decreasing. (The peak of band 9 appears below zero, likely due to overlap of a negative transition in that region, the maximum of which lies in the region obscured by the interference of the 280 nm protein transition.) These changes in CT intensity indicate that the interaction of the T2 Cu with its ligands has been perturbed in T1DT3βQ more so than in T1DT3αQ. This correlates with its greater decrease in site covalency observed in EPR and the connectivity of the T3β to the T2 Cu through residue D94.
Finally, the oxidized trinuclear cluster of the MCO's exhibits high affinity (K ~ 40,000 M−1)45 binding of fluoride; ~105-fold greater than the binding constant for fluoride to aqueous Cu(II).46 This is unique among Cu sites in inorganic chemistry and has been explained by the ability of the negatively charged fluoride ion to help neutralize the high positive charge at the resting oxidized trinuclear cluster.44 This binding is best probed by EPR. Upon addition of a stoichiometric amount of sodium fluoride a large fluoride superhyperfine splitting (A∥F) is observed in the g⊥ region of the T2 Cu signal, as shown in Figure 6. The EPR spectra of T1DT3αQ and T1DT3βQ after addition of one mole equivalent of sodium fluoride are also shown in Figure 6. Both variants exhibit superhyperfine splittings similar to those of T1D, indicating that fluoride has bound with high affinity and confirming that both variants have valid, fully oxidized trinuclear cluster sites.
Figure 6.

X-band EPR spectra exhibiting high affinity binding of fluoride to the trinuclear cluster of T1D (red), T1DT3αQ (blue), and T1DT3βQ (green) obtained at 77 K.
3.2c Reduced trinuclear cluster: Cu K-edge XAS
While Abs, CD, MCD, and EPR spectra are useful for probing oxidized, Cu(II), sites, they do not probe reduced, closed shell Cu(I), sites. X-ray absorption spectroscopy (XAS), however, does probe both Cu(II) and Cu(I) sites. The Cu K-edge XAS spectra of reduced T1D, T1DT3αQ, and T1DT3βQ are presented in Figure 7. All three are characterized by an intense feature at 8983.8 eV. Studies of copper model complexes have shown that the K-edge XAS spectrum of a Cu(I) species is distinguished by an intense transition at ~8984 eV arising from excitation of an electron from the 1s to the 4p orbitals of Cu.34 The presence and intensity of this peak in figure 7 confirm that T1D, T1DT3αQ, and T1DT3βQ are all fully reduced. It is interesting to note that this edge transition for T1DT3αQ and T1DT3βQ is more intense relative to T1D. The energy and intensity of the 1s → 4p transition is related to the coordination geometry of the Cu(I) site. Fits of these XAS spectra (Supporting Information, Figure S5) show that the increased intensity for both variants can be fit with one of the T3 Cu atoms in the reduced trinuclear cluster changing from 3-coordinate in T1D to 2-coordinate and linear in the variants. This decrease in coordination number indicates that while the three His ligands on each T3 Cu in T1D remain bound upon reduction, the Gln substitution is no longer able to bind to its reduced Cu center in each of the two variants.
Figure 7.

Cu K-edge XAS spectra of reduced T1DWT (red), T1DT3αQ (blue), and T1DT3βQ (green).
To summarize, resting oxidized forms of both T1DT3αQ and T1DT3βQ variants show small perturbations to the T3 and T2 Cu sites, as would be expected given mutation of a ligand at the T3 site and the interconnectivity of the Cu's in the trinuclear cluster. However, the T3 hydroxide bridge remains intact, the carbonyl oxygen from the glutamine residue is bound to Cu(II) [but not Cu(I)], and both T3 and T2 Cu atoms possess similar ligand fields and geometric structures relative to T1D. High affinity fluoride binding to the resting oxidized sites is also maintained in both variants, confirming the integrity of their trinuclear clusters. It should also be noted that since different hydroxide to Cu(II) CT transitions can be resolved for each T3 Cu and six LF transitions are observed, the T3 Cu sites are inherently asymmetric. Finally, the substituted Gln ligand does not bind to Cu in the reduced state of either variant, resulting in a linear, two-coordinate geometry for that T3 Cu center.
3.3 O2 Reactivity of Perturbed trinuclear cluster's
The reaction of the fully reduced trinuclear cluster in T1D Fet3p with O2 leads to rapid formation of PI.13 This species has been shown to have one reduced Cu and two oxidized and antiferrogmagnetically coupled Cu's, leading to its S = 0 ground state. PI is thus EPR and MCD silent but does exhibit LF and CT transitions that can be observed in both Abs and CD spectroscopies.22 In T1D MCOs, PI is found to form very rapidly followed by slow decay, particularly at high pH, allowing it to be easily trapped for spectroscopic study.31
When reduced, T1DT3αQ reacts with O2 to form T1DT3αQ PI. Its Abs spectrum is shown in Figure 8 along with that of T1D PI. By contrast, T1DT3βQ does not react with O2 to form PI (Figure 8, green). (Reduced T1DT3βQ was allowed to react with O2 for up to two days with < 10% increase in the Abs spectrum. This corresponds to a rate of PI formation of < 6 × 10⁻⁷ s−1, as compared to ~600 s−1 in T1D.) This is particularly interesting in that spectroscopic characterization of both the resting oxidized and reduced trinuclear cluster sites in T1DT3αQ and T1DT3βQ shows they are intact and have similar geometric and electronic structures. It follows, that similar perturbations of the different T3 Cu centers within the trinuclear cluster can have different impacts upon its reactivity. This directly demonstrates asymmetry in the reactivity of the trinuclear cluster and will be addressed in the Discussion.
Figure 8.

Room temperature absorption spectra of T1D (red), T1DT3αQ (blue), and T1DT3βQ (green) after being reduced and reacted with O2. T1D and T1DT3αQ react to form PI, while T1DT3βQ does not react with O2 to form PI.
The CD spectra of PI in T1D and T1DT3αQ are shown in Figure 9. A simultaneous fit of these spectra with their corresponding Abs spectra requires four peroxide to Cu(II) CT transitions, bands 6–9, and five Cu(II) LF transitions, bands 1–5 (Band 1 has been previously shown to be present in PI, but is below the energy cutoff of the instrument used to acquire the data presented here. Gaussian fits of the Abs spectra are shown in Supporting Information, Figure S6 and Table S1).13 Comparison of these CD spectra shows that the two PI species contain identical oxidized Cu sites. As described in section 3.2a, a change of His to Gln on the T3α Cu leads to changes in the resting oxidized CD spectrum (Figure 4E vs 4D). Therefore, if the T3α Cu is oxidized in PI, similar changes to the CD spectrum would be expected. Based on this, we conclude that the T3α Cu is reduced in PI and the two oxidized Cu's that contribute to the CD spectrum, in PI must be the T3β and T2 sites. This conclusion based upon these experimental reactivity and spectroscopic data is consistent with results of DFT calculations that indicate PI possess a structure with the T2 and T3β sites oxidized, the T3α reduced, and peroxide bound to the cluster in a μ3-1,1,2 bridging mode.35
Figure 9.
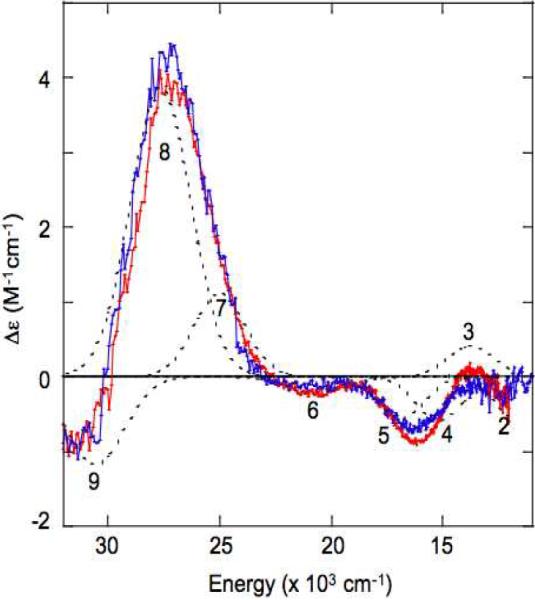
CD spectra of PI in T1D (red) and T1DT3αQ (blue). Individual Gaussian bands are shown in dotted black lines. Bands 6–9 have previously been assigned as peroxide π*v and π*σ to Cu(II) CT transitions and bands 1–5 as Cu(II) LF transitions.13 (Band 1 is located below the energy cutoff for the instrument used to aquire these data. The Abs spectra of T1DPI and T1DT3αQ PI, with Gaussian fits are available in Supporting Information, Figure S6. A summary of the Gaussian fit energies is provided in Supporting Information, Table S1.)
3.4 Reduction Titrations
Reduction titrations with sodium dithionite were performed to evaluate the impact of the His to Gln mutation on the reduction potential of the T3 Cu site. EPR spectra were used to track the loss of the T2 Cu(II) and to observe any other paramagnetic species that might appear during the titration, while the disappearance of the oxidized T3 Cu site was followed by the 330 nm band in Abs. Plots for the titration of T1D are shown in Supporting Information Figures S7–9. Sodium dithionite can act as a one (SO2−) or two-electron (S2O42−) donor, with both species having sufficiently low reduction potentials to stoichiometrically reduce the Cu's in the trinuclear cluster.47 While reduction of the isolated T2 Cu should involve the one-electron donor species, the stoichiometry of the reduction of the T3 site could involve either a one or two-electron process. It has been shown that disappearance of the 330 nm band will occur with a one-electron reduction of a single T3 Cu; however, this generates a new EPR signal from the paramagnetic half-met T3 site.48 There is no evidence of a new EPR signal appearing during the reduction titration of T1D or either of the variants. This indicates that the T3 site is not functioning as two sequential one-electron acceptors, but rather as a single two-electron acceptor. This behavior is in agreement with previous reduction potential determinations of the T3 Cu site in various holo MCO's.49,50
Since sodium dithionite stoichiometrically reduces the Cu atoms in the trinuclear cluster, the relevant redox equilibrium is between the T2 (1e−) and T3 (2e−) Cu sites. The titration data were fit to the Nernst equation to determine their relative reduction potentials, shown in Figure 10 and summarized in Table 5. In T1D, the T2 Cu site reduces first (Figure 10A, red) and from a fit of the data is ~15 mV higher in potential than the T3 Cu site. However, in both T1DT3αQ and T1DT3βQ (Figure 10, B and C, respectively) the T3 Cu site reduces first in the titration. This indicates that upon mutation of His to Gln, the reduction potential of the T3 Cu site has been raised relative to the T2 Cu site. Assuming that the reduction potential of the T2 Cu site is similar in the variants (a reasonable assumption given that there is no perturbation of the reduced T2 Cu(I), section 3.2c, and only limited perturbations of the T2 Cu(II) spectral features, section 3.2b), it follows that in T1DT3αQ the reduction potential of the T3 site has risen by ~50 mV (~35 mV higher than the T2 Cu) and in T1DT3βQ by ~100 mV (~85 mV higher than the T2 Cu). An increase in reduction potential is reasonable for these mutations. Gln is a weaker donor than His in the Cu(II) and should thus decrease the stability of the oxidzed form of the T3 Cu site in both variants. Furthermore, the lack of coordination of Gln to Cu(I) should stabilize the reduced sites of the variants. Further, as will be discussed below, in the wild type trinuclear cluster, the reduced T3β Cu is less energetically stable than the reduced T3α Cu. Therefore, the similar linear structure that is found to be present in the reduced form of both variants should stabilize the reduced state of T1DT3βQ more than T1DT3αQ. This accounts for the larger increase in the T3 Cu reduction potential in T1DT3βQ relative to T1DT3αQ.
Figure 10.

Plots of reduction titrations of T1D(A), T1DT3αQ (B), and T1DT3βQ (C). The T2 Cu site is shown in red and the T3 Cu site (two electron acceptor) in blue with lines depicting the best fit of the data using the Nernst Equation.
Table 5.
Summary of reduction potentials of the T3 Cu site in T1D, T1DT3α, and T1DT3β
| Fet3p species | E°T3 relative toE°T2 | Change in E°T3 relative to T1D |
|---|---|---|
| T1D | −15 mV | - |
| T1DT3αQ | +35 mV | +50 mV |
| T1DT3βQ | +85 mV | +100 mV |
4. Discussion
This study has focused on two His to Gln mutations in the first coordination sphere of the trinuclear cluster of Fet3p, one at the T3α Cu, H126Q, and one at the T3β Cu, H483Q (Figure 1), and their impact upon structure and reactivity. Structurally, these two residues are mirrors of each other in the trinuclear cluster, each with backbone N-H H-bonds to the backbone C=O of one of the T2 Cu coordinating His ligands, i.e. H126 N-H to H81 C=O, and H483 N-H to H416 C=O.
The resting oxidized trinuclear cluster's in both T1DT3αQ and T1DT3βQ have been spectroscopically characterized, and it was found that the His to Gln mutation causes minor perturbations of the T3 Cu at which the mutation is made. The T3 Cu atoms in both mutants are still antiferromagnetically coupled by a bridging hydroxide and maintain their four-coordinate geometry. The T2 Cu site has also been perturbed in these variants, an indication of the interconnectivity of the Cu atoms within the trinuclear cluster. The T2 site in the variants has, however, maintained a T-shaped geometry similar to that of the T2 Cu in T1D and WT. Both variants also maintain the high affinity fluoride binding that is characteristic of an intact fully oxidized trinuclear cluster of MCO proteins. The largest structural perturbation introduced by these mutations occurs upon reduction of the trinuclear cluster. Cu K-edge XAS spectra of both variants (Figure 7) show that the introduced Gln residue does not coordinate to its mutated T3 Cu(I), leaving it two-coordinate and linear. Importantly, when these similarly perturbed, reduced trinuclear cluster's are exposed to O2, only T1DT3αQ reacts to form PI.
Spectroscopic characterization of PI in T1DT3αQ relative to T1D has allowed for experimental verification of the oxidation state of each of its Cu's. While the LF region of the CD spectrum of resting oxidized T1DT3αQ shows perturbations of the T3α Cu relative to resting T1D (Figure 4, D vs E), the CD spectrum of the PI in T1DT3αQ is identical to the CD spectrum of the PI in T1D (Figure 9). This establishes that the T3α Cu must be reduced in both PI's and that its CD spectrum probes the T3β Cu(II) and T2 Cu(II) sites. It is this T3β-T2 edge, as opposed to the T3α-T3β or T3α-T2 edge, of the trinuclear cluster that has transferred two electrons to reduce dioxygen to peroxide. The T3β and T2 Cu sites lie in close proximity to residue D94, that has been shown experimentally and computationally to provide a negative charge necessary for the reaction of the trinuclear cluster with O2.30,31,35 This negative charge is one contribution to the asymmetry in the trinuclear cluster and lowers the potential of the T3β-T2 edge to drive the first two-electron step of O2 reduction.
Considering that it is necessary for the trinuclear cluster to have a properly tuned reduction potential to reduce O2, changes in potential of the T3 Cu atoms in T1DT3αQ and T1DT3βQ should impact reactivity. Substitution of a His ligand with a Gln that is a weaker donor in the Cu(II) state and does not coordinate in the Cu(I) state would be expected to stabilize Cu(I) over Cu(II) and raise the reduction potential of the site. Reductive titrations, summarized in Table 5, show that the potentials of the T3 Cu sites increase in both T1DT3αQ and T1DT3βQ, by 50 and 100 mV relative to T1D, respectively. This study has established that the T3α Cu does not transfer an electron during the first two-electron step of O2 reduction. Therefore, the change of potential observed in T1DT3αQ should not affect dioxygen reduction to peroxide and experimentally it is found that the PI forms with similar rates in both T1D and T1DT3αQ.13 However, the 100 mV increase in reduction potential of the T3 Cu in T1DT3βQ should impact this reaction. The expected change in ET rate due to a change in reduction potential can be estimated using Marcus-Hush Theory for inner sphere ET.51,52 The 100 mV increase in potential predicts an ~100-fold decrease in rate.53 Thus, this redox potential increase (decrease in ET driving force) is not sufficient to explain why the rate of PI formation goes from ~600 s−1 in T1D to < 6 × 10⁻⁷ s−1 in T1DT3βQ.
Asymmetry of the trinuclear cluster
As the increase in reduction potential does not fully account for the lack of PI formation in T1DT3βQ, we also consider a structural component to the two-electron reduction of O2 that occurs selectively at the T3β-T2 edge (predicted in DFT-calculations35 and observed experimentally in this study) and its perturbation in T1DT3βQ. Analysis of the crystal structures of fully reduced MCO's5,54 shows that the two T3 Cu's are structurally asymmetric. The T3β Cu is held ~0.3 Å out of the plane of its three coordinating N atoms, resulting in a trigonal pyramidal geometry. The T3α Cu, on the other hand, is located in the plane of its three coordinating N atoms, with a trigonal planar geometry (Supporting Information, Figure S10). Computational studies have shown that this difference in geometry is a consequence of the T3β Cu being coordinated by the ε2N of each of its three His ligands, while one His ligand, H83, of the T3α Cu is coordinated through the δ1N.55 This allows the T3α Cu(I) more flexibility to adopt the planar geometry (Supporting Information, Figure S10), which is energetically stabilized relative to the trigonal pyramidal Cu(I) structure of T3β, and therefore less reactive toward binding a fourth ligand. This is clear from our earlier computational studies which showed that O2 would bind to the reduced T3β Cu but not the reduced T3α Cu in a T2D structure.55 Therefore, in a wild type trinuclear cluster, the T3β Cu is activated to react with O2 along the T3β-T2 edge, where the negative charge of D94 provides the driving force necessary to reduce O2 by two electrons. In T1DT3αQ, the T3β Cu(I) is unperturbed and remains activated for reaction with O2. However, in T1DT3βQ the T3β Cu(I) is now two-coordinate and linear, as the Gln ligand does not bind to the Cu(I) (from XAS in Figure 7), and is no longer activated to react with O2.
A model for how the structural asymmetry of the trinuclear cluster promotes rapid and efficient reduction of O2 to H2O can now be proposed, as outlined in Figure 11. The reduced T3β Cu is activated towards reaction with O2 relative to the reduced T3α Cu, which is stabilized by its planar structure due to coordination by the δ1N of a His ligand. Residue D94 provides a negative charge near the T3β-T2 Cu edge, which will lower the potential of these two Cu's. This provides the driving force necessary to reduce O2 by two electrons, thereby forming PI. In PI, peroxide is bound tightly to the trinuclear cluster as it is coordinated side-on to the T3β Cu(II) and also has strong end-on bonds with both the T2 Cu(II) and T3α Cu(I).35 This helps to prevent loss of peroxide and is facilitated by the structural flexibility of the T3α-T3β edge, which moves from > 5Å apart in the reduced state5,47 to ~4 Å apart in PI.35
Figure 11.

Mechanism depicting the role of trinuclear cluster asymmetry in the catalytic cycle of the MCO's.
The next step of the mechanism, cleavage of the O-O bond to form NI, is initiated by ET from the T1 Cu to PI at the trinuclear cluster. We have shown that in PI the T3β Cu is oxidized. This allows for a T1-Cys-His-T3β superexchange pathway, through which rapid ET is assisted by an H-bond shunt between the carbonyl oxygen on the T1 Cu Cys ligand and the δ1N on the His 483 ligand of the T3β Cu.16,36,43 The T1-Cys-His-T3α pathway, on the other hand, does not have a comparable H-bond. ET from the T1 Cu to the trinuclear cluster generates a one electron reduced form of PI, referred to as PI+e.35 The O-O bond of peroxide will then be cleaved to form NI with a low barrier, according to the frontier molecular orbital mechanism previously determined by both experimental and computational studies.31,35 Finally, once NI has formed, it must be reduced, and in that process two molecules of water are released. Here, the flexibility of the T3α-T3β edge will facilitate an increase in the Cu-Cu distance from <3.5 Å in NI26 back to >5 Å in the reduced form, opening the trinuclear cluster to facilitate elimination of water. The sequence of reduction of the trinuclear cluster Cu sites and the associated proton transfer will determine the exit channel for water and remains a topic of further study.
In summary, study of the T1DT3αQ and T1DT3βQ variants has provided insight into the asymmetry of the trinuclear cluster and its role in the reduction of O2 to H2O. Cu K-edge XAS has shown that in the reduced form of each of the two variants, the mutated ligand no longer coordinates to Cu. However, T1DT3αQ still reacts with O2 to form PI while T1DT3βQ does not. Furthermore, comparison of the CD spectra of PI in T1D and T1DT3αQ shows that these species have identical oxidized Cu sites. Together, these results provide experimental proof that the oxidized Cu sites in PI are the T2 and T3β. Thus these two Cu's are required for the first two-electron reduction of O2. The lack of reactivity in T1DT3βQ cannot be explained by the increase in reduction potential associated with a T3βQ Cu ligand. Therefore, it is ascribed to the fact that the T3β Cu's trigonal pyramidal geometry activates it to react with O2, while the planar T3α Cu and mutated, linear T3β Cu of T1DT3βQ are stabilized as Cu(I) such that they do not react with O2. Given the spectroscopic similarity of trinuclear cluster's, in both the organic substrate and metal ion substrate oxidizing classes,13,44 it is likely that these insights are transferable throughout the MCO family of enzymes.
Supplementary Material
5. Acknowledgements
This research was supported by NIH grants DK31450 (to E.I.S.), RR-01209 (to K.O.H.) and DK53820 (to D.J.K.). SSRL operations are funded by the Department of Energy, Office of Basic Energy Sciences. The SSRL Structural Molecular Biology program is supported by the National Institutes of Health, National Center for Research Resources, Biomedical Technology Program and by the Department of Energy, Office of Biological and Environmental Research.
This publication was made possible by Grant Number 5 P41 RR001209 from the National Center for Research Resources (NCRR), a component of the National Institutes of Health (NIH). Its contents are soley the responsibility of the authors and do not necessarily represent the official view of NCRR or NIH.
Footnotes
Supporting Information Available X-band EPR and room temperate absorption sprectra of holo proteins; Cu K-edge XAS spectra and fits of holo proteins; room temperature absorption spectrum of resting and reoxidized T1DH418Q and Cu K-edge XAS spectrum and fit of reduced T1DH418Q; fits of X-band EPR for T1D, T1DT3αQ and T1DT3βQ; fits of Cu K-edge XAS spectra for T1D, T1DT3αQ and T1DT3βQ; Gaussian fit and individual band energies for the room temperature absorption spectrum of T1D PI and T1DT3αQ PI; absorption and EPR spectra of T1D, T1DT3αQ and T1DT3βQ reduction titrations; structure of the fully reduced T3 Cu site. This material is available free of change via the Internet at http://pubs.acs.org.
6. References and Notes
- (1).Solomon EI, Sundaram UM, Machonkin TE. Chem. Rev. 1996;96:2563–2605. doi: 10.1021/cr950046o. [DOI] [PubMed] [Google Scholar]
- (2).Nitta K, Kataoka K, Sakurai T. J. Inorg. Biochem. 2002;91:125–131. doi: 10.1016/s0162-0134(02)00440-3. [DOI] [PubMed] [Google Scholar]
- (3).Jonsson L, Sjöström K, Häggström I, Nyman PO. Biochim. Biophys. Acta. 1995;1251:210–215. doi: 10.1016/0167-4838(95)00104-3. [DOI] [PubMed] [Google Scholar]
- (4).Messerschmidt A, Rossi A, Ladenstein R, Huber R, Bolognesi M, Guiseppina G, Marchesini A, Petruzzelli R, Finazzi-Agro A. J. Mol. Biol. 1989;206:513–529. doi: 10.1016/0022-2836(89)90498-1. [DOI] [PubMed] [Google Scholar]
- (5).Bento I, Martins LO, Lopes GG, Carrondo MA, Lindley PF. Dalton Transactions. 2005:3507–3513. doi: 10.1039/b504806k. [DOI] [PubMed] [Google Scholar]
- (6).de Silva D, Askwith CC, Eide D, Kaplan J. J. Biol. Chem. 1995;270:1098–1101. doi: 10.1074/jbc.270.3.1098. [DOI] [PubMed] [Google Scholar]
- (7).Zaitseva I, Zaitsev V, Card G, Moshkov K, Bax B, Ralph A, Lindley P. J. Biol. Inorg. Chem. 1996;1:15–23. [Google Scholar]
- (8).Roberts S, Weichsel A, Grass G, Thakali K, Hazzard J, Tollin G, Rensing C, Montfort W. Proc. Natl. Acad. Sci. U.S.A. 2002;99:2766–2771. doi: 10.1073/pnas.052710499. [DOI] [PMC free article] [PubMed] [Google Scholar]
- (9).Francis CA, Casciotti KL, Tebo BM. Arch. Microbiol. 2002;178:450–456. doi: 10.1007/s00203-002-0472-9. [DOI] [PubMed] [Google Scholar]
- (10).Malkin R, Malmström BG. Adv. Enzymol. 1970;33:177–243. doi: 10.1002/9780470122785.ch4. [DOI] [PubMed] [Google Scholar]
- (11).Gewirth AA, Solomon EI. J. Am. Chem. Soc. 1988;110:3811–3819. [Google Scholar]
- (12).Cole JL, Clark PA, Solomon EI. J. Am. Chem. Soc. 1990;112:9534–9548. [Google Scholar]
- (13).Palmer AE, Quintanar L, Severance S, Wang T-P, Kosman DJ, Solomon EI. Biochemistry. 2002;41:6438–6448. doi: 10.1021/bi011979j. [DOI] [PubMed] [Google Scholar]
- (14).Allendorf MD, Spira DJ, Solomon EI. Proc. Natl. Acad. Sci. U.S.A. 1985;82:3063. doi: 10.1073/pnas.82.10.3063. [DOI] [PMC free article] [PubMed] [Google Scholar]
- (15).Spira-Solomon DJ, Allendorf MD, Solomon EI. J. Am. Chem. Soc. 1986;108:5318. [Google Scholar]
- (16).Messerschmidt A, Ladenstein R, Huber R, Bolognesi M, Avigliano L, Petruzzelli R, Rossi A, Finazzi-Agro A. J. Mol. Biol. 1992;224:179–205. doi: 10.1016/0022-2836(92)90583-6. [DOI] [PubMed] [Google Scholar]
- (17).Solomon EI, Augustine AJ, Yoon J. Dalton Trans. 2008;30:3921–3932. doi: 10.1039/b800799c. [DOI] [PMC free article] [PubMed] [Google Scholar]
- (18).Solomon EI, Chen P, Metz M, Lee S-K, Palmer AE. Angew. Chem., Int. Ed. 2001;40:4570–4590. doi: 10.1002/1521-3773(20011217)40:24<4570::aid-anie4570>3.0.co;2-4. [DOI] [PubMed] [Google Scholar]
- (19).Palmer AE, Lee S-K, Solomon EI. J. Am. Chem. Soc. 2001;123:6591–6599. doi: 10.1021/ja010365z. [DOI] [PubMed] [Google Scholar]
- (20).Morie-Bebel MM, Morris MC, Menzie JL, McMillin DR. J. Am. Chem. Soc. 1984;106:3677. [Google Scholar]
- (21).Blackburn NJ, Ralle M, Hassell R, Kosman DJ. Biochemistry. 2000;39:2316–2324. doi: 10.1021/bi992334a. [DOI] [PubMed] [Google Scholar]
- (22).Shin W, Sundaram UM, Cole JL, Zhang HH, Hedman B, Hodgson KO, Solomon EI. J. Am. Chem. Soc. 1996;118:3202–3215. [Google Scholar]
- (23).Sundaram UM, Zhang HH, Hedman B, Hodgson KO, Solomon EI. J. Am. Chem. Soc. 1997;119:12525–12540. [Google Scholar]
- (24).Lee SK, George SD, Antholine WE, Hedman B, Hodgson KO, Solomon EI. J. Am. Chem. Soc. 2002;124:6180–6193. doi: 10.1021/ja0114052. [DOI] [PubMed] [Google Scholar]
- (25).Yoon J, Mirica LM, Stack TDP, Solomon EI. J. Am. Chem. Soc. 2005;127:13680–13693. doi: 10.1021/ja0525152. [DOI] [PubMed] [Google Scholar]
- (26).Yoon J, Liboiron BD, Sarangi R, Hodgson KO, Hedman B, Solomon EI. Proc. Natl. Acad. Sci. U.S.A. 2007;104:13609–13614. doi: 10.1073/pnas.0705137104. [DOI] [PMC free article] [PubMed] [Google Scholar]
- (27).Andréasson L-E, Reinhammar B. Biochim. Biophys. Acta. 1976;445:579–597. doi: 10.1016/0005-2744(76)90112-1. [DOI] [PubMed] [Google Scholar]
- (28).Andréasson L-E, Brändén R, Reinhammar B. Biochim. Biophys. Acta. 1976;438:370–379. doi: 10.1016/0005-2744(76)90254-0. [DOI] [PubMed] [Google Scholar]
- (29).LuBien CD, Winkler ME, Thamann TJ, Scott RA, Co MS, Hodgson KO, Solomon EI. J. Am. Chem. Soc. 1981;103:7014–7016. [Google Scholar]
- (30).Quintanar L, Stoj C, Wang T-P, Kosman DJ, Solomon EI. Biochemistry. 2005;44:6081–6091. doi: 10.1021/bi047379c. [DOI] [PubMed] [Google Scholar]
- (31).Augustine AJ, Quintanar L, Stoj CS, Kosman DJ, Solomon EI. J. Am. Chem. Soc. 2007;129:13118–13126. doi: 10.1021/ja073905m. [DOI] [PMC free article] [PubMed] [Google Scholar]
- (32).Gaykema WRJ, Hol WGJ, Vereijken JM, Soeter NM, Bak HJ, Beintema JJ. Nature. 1984;309:23–29. [Google Scholar]
- (33).Metz M, Solomon EI. J. Am. Chem. Soc. 2001;123:4938–4950. doi: 10.1021/ja004166b. [DOI] [PubMed] [Google Scholar]
- (34).Kau LS, Spira-Solomon DJ, Penner-Hahn JE, Hodgson KO, Solomon EI. J. Am. Chem. Soc. 1987;109:6433–6442. [Google Scholar]
- (35).Yoon J, Solomon EI. J. Am. Chem. Soc. 2007;129:13127–13136. doi: 10.1021/ja073947a. [DOI] [PMC free article] [PubMed] [Google Scholar]
- (36).Taylor AB, Stoj CS, Ziegler L, Kosman DJ, Hart PJ. Proc. Natl. Acad. Sci. U.S.A. 2005;102:15459–15464. doi: 10.1073/pnas.0506227102. [DOI] [PMC free article] [PubMed] [Google Scholar]
- (37).Hassett RF, Yuan DS, Kosman DJ. J. Biol. Chem. 1998;273:23274–23282. doi: 10.1074/jbc.273.36.23274. [DOI] [PubMed] [Google Scholar]
- (38).Askwith C, Eide D, Van Ho A, Bernard PS, Li L, Davis-Kaplan S, Sipe DM, Kaplan J. Cell. 1994;76:403–410. doi: 10.1016/0092-8674(94)90346-8. [DOI] [PubMed] [Google Scholar]
- (39).Bradford MM. Anal. Biochem. 1976;72:248–254. doi: 10.1016/0003-2697(76)90527-3. [DOI] [PubMed] [Google Scholar]
- (40).Felsenfeld G. Arch. Biochem. Biophys. 1960;87:247–251. doi: 10.1016/0003-9861(60)90168-5. [DOI] [PubMed] [Google Scholar]
- (41).Carithers RP, Palmer G. J. Biol. Chem. 1981;256:7967–7976. [PubMed] [Google Scholar]
- (42).Tenderholt A, Hedman B, Hodgson KO. AIP Conference Proceedings. 2006;882:105–107. [Google Scholar]
- (43).Augustine AJ, Kragh ME, Sarangi R, Fujii S, Liboiron BD, Stoj CS, Kosman DJ, Hodgson KO, Hedman B, Solomon EI. Biochemistry. 2008;47:2036–2045. doi: 10.1021/bi7020052. [DOI] [PubMed] [Google Scholar]
- (44).Quintanar L, Yoon J, Aznar C, Palmer AE, Andersson K, Britt D, Solomon EI. J. Am. Chem. Soc. 2005;127:13832–13845. doi: 10.1021/ja0421405. [DOI] [PubMed] [Google Scholar]
- (45).Winkler ME, Spira DJ, Lu Bien CD, Thamann TJ, Solomon EI. Biochem. Biophys. Res. Commun. 1982;107:727–734. doi: 10.1016/0006-291x(82)91551-0. [DOI] [PubMed] [Google Scholar]
- (46).Connick RE, Paul AD. J. Am. Chem. Soc. 1958;80:2069–2071. [Google Scholar]
- (47).Mayhew SG. Eur. J. Biochem. 1978;85:535–547. doi: 10.1111/j.1432-1033.1978.tb12269.x. [DOI] [PubMed] [Google Scholar]
- (48).Spira-Solomon DJ, Solomon EI. J. Am. Chem. Soc. 1987;109:6421–6432. [Google Scholar]
- (49).Machonkin TE, Solomon EI. J. Am. Chem. Soc. 2000;122:12547–12560. [Google Scholar]
- (50).Reinhammar BR. Biochim. Biophys. Acta. 1972;275:245–259. doi: 10.1016/0005-2728(72)90045-x. [DOI] [PubMed] [Google Scholar]
- (51).Marcus RA, Sutin N. Biochim. Biophys. Acta. 1985;811:265–322. [Google Scholar]
- (52).Hush NS. Electrochim. Acta. 1968;13:1005–1023. [Google Scholar]
- (53).According to Marcus-Hush Theory, the rate of ET is dependent on the interaction between the electron donor and acceptor, the reorganization energy for the ET process, and ΔG°, the driving force which is determined by the difference in electron donor and acceptor reduction potentials. To estimate the change in ET rate due to a change in potential, all other contributions were assumed to remain the same. The reduction potential for the T3β-T2 edge was estimated to be ~+400 mV (based upon reported values of E° for T3 and T2 Cu sites),50,51 and the reduction potential of O2 to peroxide used was 280 mV (vs NHE at pH = 7).
- (54).Messerschmidt A, Luecke H, Huber R. J. Mol. Biol. 1993;230:997–1014. doi: 10.1006/jmbi.1993.1215. [DOI] [PubMed] [Google Scholar]
- (55).Yoon J, Fujii S, Solomon EI. Proc. Natl. Acad. Sci. U.S.A. 2009;106:6585–6590. doi: 10.1073/pnas.0902127106. [DOI] [PMC free article] [PubMed] [Google Scholar]
Associated Data
This section collects any data citations, data availability statements, or supplementary materials included in this article.