Abstract
Biogenic polyamines are found to modulate protein synthesis at different levels, while polyamine analogues have shown major antitumor activity in multiple experimental models, including breast cancer. The aim of this study was to examine the interaction of bovine serum albumin (BSA) with biogenic polyamines, spermine and spermidine, and polyamine analogues 3,7,11,15-tetrazaheptadecane.4HCl (BE-333) and 3,7,11,15,19-pentazahenicosane.5HCl (BE-3333) in aqueous solution at physiological conditions. FTIR, UV-visible, CD and fluorescence spectroscopic methods were used to determine the polyamine binding mode and the effects of polyamine complexation on protein stability and secondary structure. Structural analysis showed that polyamines bind BSA via both hydrophilic and hydrophobic interactions. Stronger polyamine-protein complexes formed with biogenic than synthetic polyamines with overall binding constants of Kspm = 3.56 (±0.5) × 105 M-1, Kspmd = 1.77 (±0.4) × 105 M-1, KBE-333 = 1.11 (±0.3) × 104 M-1 and KBE-3333 = 3.90 (± 0.7) × 104 M-1 that correlate with their positively charged amino group contents. Major alterations of protein conformation were observed with reduction of α-helix from 63% (free protein) to 55-33% and increase of turn 12% (free protein) to 28-16% and random coil from 6% (free protein) to 24-17% in the polyamine-BSA complexes, indicating a partial protein unfolding. These data suggest that serum albumins might act as polyamine carrier proteins in delivering polyamine analogues to target tissues.
Keywords: polyamine, BSA, binding mode, secondary structure, FTIR, CD, fluorescence spectroscopy
Introduction
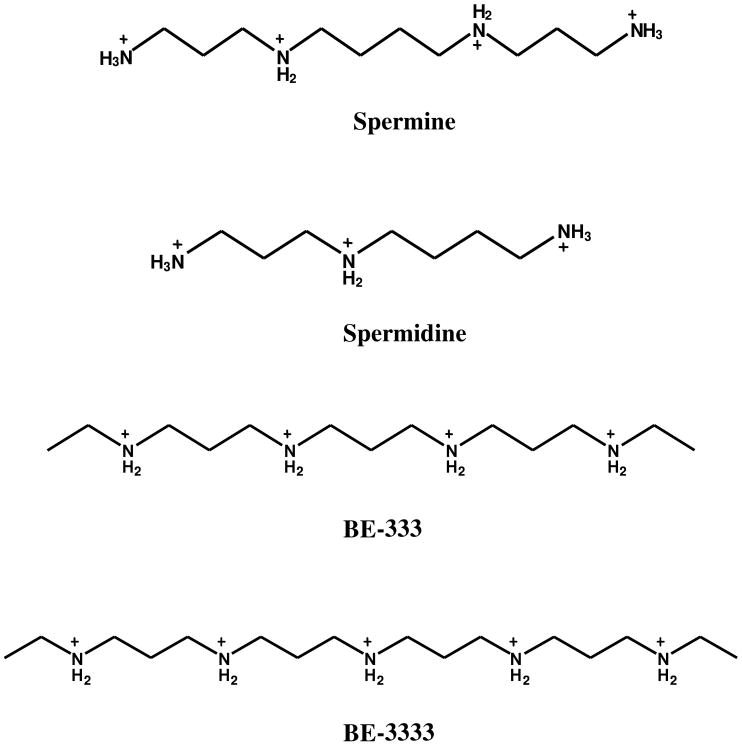
Polyamines are ubiquitous cellular organic cations, and play an important role in cell growth and differentiation.1-3 Biogenic polyamines (Scheme 1) are found to modulate protein synthesis at different levels. This effect may be explained by the ability of polyamines to bind and influence the secondary structure of tRNA, mRNA, rRNA, and proteins. While, biogenic polyamines are essential for cell growth, polyamine analogues (Scheme 1) show antitumor activity in experimental models and their ability to alter the activity of cytotoxic chemotherapeutic agents in breast cancer is well documented.2-5 Polyamine analogues can mimic natural polyamines in their self-regulatory role but are unable to substitute for biogenic polyamines in terms of supporting cell growth and differentiation. Complexation of biogenic polyamines and polyamine analogues with nucleic acids has been extensively investigated.6-10 However, investigations into the binding of polyamines with proteins are scant, although positively charged polyamines might interact with negatively charged regions of proteins.3 In addition, the binding of polyamine analogues with serum proteins can enhance their stability in the blood stream and bioavailability at target tissues. We recently studied the interaction of biogenic and synthetic polyamines with human serum albumin and found that natural and synthetic polyamines could affect the stability and secondary structure of the protein. 11,12
Scheme 1. Chemical structures of biogenic and synthetic polyamines.
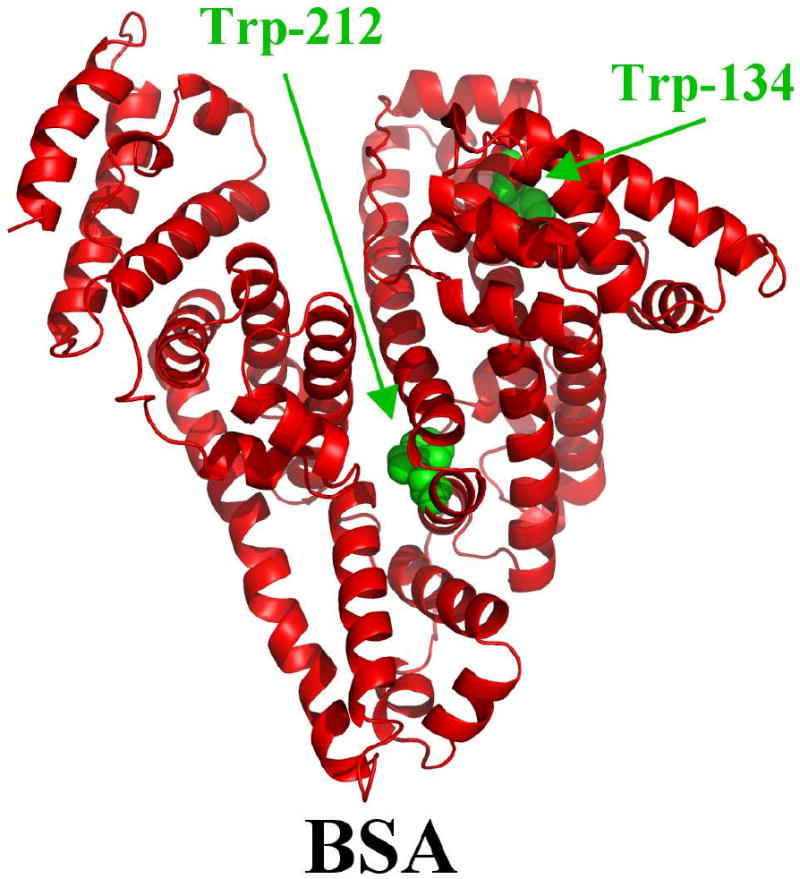
Serum albumins are the major soluble protein constituents of the circulatory system, and constitute 50-60% of total amount of plasma proteins.13 They bind metabolites, endogenous molecules, hormones, drugs, etc.14,15 The most important property of this group of proteins is that they serve as transporters for a variety of compounds such as drugs, fatty acids and amine-terminated dendrimers.16,17 BSA (Scheme 2) is one of the most extensively studied of this group of proteins, particularly because of its structural homology with human serum albumin (HSA). The BSA molecule is made up of three homologous domains (I, II, III) that are divided into nine loops (L1-L9) by 17 disulfide bonds. The loops in each domain are made up of a sequence of large-small-large loops forming a triplet. Each domain in turn is the product of two subdomains (IA, IB, etc.). X-ray crystallographic data show that the albumin structure is predominantly α-helical, with the remaining polypeptide occurring in turns and in extended or flexible regions between subdomains with no β-sheets.18, 19 BSA has two tryptophan residues that possess intrinsic fluorescence.20, 21 Trp-134 in the first domain and Trp-212 in the second domain. Trp-212 is located within a hydrophobic binding pocket of the protein and Trp-134 is located on the surface of the molecule. While there are marked similarities between BSA and HSA in their compositions, HSA has only one tryptophan residue Trp-214, while BSA contains two tryptophans Trp-212 and Trp-134 as fluorphores capable of fluorescence quenching.
Scheme 2. Structure of bovine serum albumin with tryptophan residues shown in green color.
Fluorescence quenching is considered as a technique for measuring binding affinities. Fluorescence quenching is the decrease of the quantum yield of fluorescence from a fluorophore induced by a variety of molecular interactions with quencher molecule.22 Therefore, it was of interest to use quenching of the intrinsic tryptophan fluorescence of BSA as a tool to study the interaction of polyamines with BSA in an attempt to characterize the nature of polyamine-protein complexation.
We report the spectroscopic analysis of BSA complexes with biogenic polyamines, spermine and spermidine, and synthetic polyamines BE-333 and BE-3333 in aqueous solution. Structural information regarding polyamine binding mode, binding constant and the effect of polyamine-BSA complex formation on protein stability and secondary structure is reported here.
Experimental
Materials
Bovine serum albumin fraction V, spermine.4HCl and spermidine.3HCl were purchased from Sigma Chemical Company and used as supplied. Polyamine analogues, BE-333 and BE-3333 were synthesized in the laboratory of Dr. Akira Shirahata (Josai University, Saitama, Japan). Other chemicals were of reagent grade and used without further purification.
Preparation of Stock Solutions
Bovine serum albumin was dissolved in aqueous solution (40 mg/ml or 0.5 mM) containing 10 mM Tris-HCl buffer (pH 7.4). The protein concentration was determined spectrophotometrically using the extinction coefficient of 36500 M-1 cm-1 at 280 nm.23 Polyamine solution was prepared 1 mM concentration in Tris-HCl buffer (pH = 7.4) and then diluted by serial dilution to 0.5, 0.25 and 0.125 mM.
FTIR Spectroscopic Measurements
Infrared spectra were recorded on a FTIR spectrometer (Impact 420 model), equipped with deuterated triglycine sulphate (DTGS) detector and KBr beam splitter, using AgBr windows. Polyamine solution was added dropwise to the BSA solution with constant stirring to ensure the formation of a homogeneous solution and to have polyamine concentrations of 0.125, 0.25 and 0.5 mM with a final protein concentration of 0.25 mM (20 mg/ml). Spectra were collected after 2 h incubation of BSA with polyamine solution at room temperature, using hydrated films. The 2 hours incubation time allow maximum interaction between polyamine and BSA, as was indicated by infrared spectra. Interferograms were accumulated over the spectral range 4000-600 cm-1 with a nominal resolution of 2 cm-1 and 100 scans. The difference spectra [(protein solution + polyamine solution) − (protein solution)] were generated using water combination mode around 2300 cm-1, as standard.24 When producing difference spectra, this band was adjusted to the baseline level, in order to normalize difference spectra.
Analysis of Protein Conformation
Analysis of the secondary structure of BSA and its polyamine complexes was carried out on the basis of the procedure previously reported.25 The protein secondary structure was determined from the shape of the amide I band, located around 1660-1650 cm-1. The FT-IR spectra were smoothed and their baselines were corrected automatically using Grams AI software. Thus, the root-mean square (rms) noise of every spectrum was calculated. By means of the second derivative in the spectral region 1700-1600 cm-1, 7 to 8 major peaks for BSA and the complexes were resolved. The above spectral region was deconvoluted by the curve-fitting method with the Levenberg-Marquadt algorithm, and the peaks corresponding to α-helix (1658-1656 cm-1), β-sheet (1638-1614 cm-1), turn (1670-1665 cm-1), random coil (1648-1640 cm-1) and β-antiparallel (1692-1680 cm-1) were adjusted, and the area was measured with the Gaussian function. The area of all the component bands assigned to a given conformation were then summed up and divided by the total area.26 The curve-fitting analysis was performed using the GRAMS/AI Version 7.01 software of the Galactic Industries Corporation.
Circular Dichroism
CD Spectra of BSA and its polyamine complexes were recorded with a Jasco J-720 spectropolarimeter. For measurements in the far-UV region (178-260 nm), a quartz cell with a path length of 0.01 cm was used in nitrogen atmosphere. BSA concentration was kept constant (12.5 μM), while varying each polyamine concentration (0.125, 0.25 and 0.5 mM). An accumulation of three scans with a scan speed of 50 nm per minute was performed and data collected for each nm from 260 to 180 nm. Sample temperature was maintained at 25 °C using a Neslab RTE-111 circulating water bath connected to the water-jacketed quartz cuvettes. Spectra were corrected for buffer signal and conversion to the Mol CD (Δε) was performed with the Jasco Standard Analysis software. The protein secondary structure was calculated using CDSSTR, which calculates the different assignments of secondary structures by comparison with CD spectra, measured from different proteins for which high quality X-ray diffraction data are available.27,28 The program CDSSTR is provided in CDPro software package which is available at the website: http://lamar.colostate.edu/∼sreeram/CDPro
Absorption Spectroscopy
The absorption spectra were recorded on a Perkin Elmer Lambda 40 Spectrophotometer. Quartz cuvettes of 1 cm were used and the absorption spectra recorded for free BSA (25 μM) and for its polyamine complexes with each polyamine (1 μM to 500 μM).
The binding constants of the polyamine-BSA complexes were calculated as reported. 29, 30 It is assumed that the interaction between the ligand L and the substrate S is 1:1; for this reason a single complex SL (1:1) is formed. It was also assumed that the sites (and all the binding sites) are independent and finally the Beer's law is followed by all species. A wavelength is selected at which the molar absorptivities εS (molar absorptivity of the substrate) and ε11 (molar absorptivity of the complex) are different. Then at total concentration St of the substrate, in the absence of ligand and the light path length is b = 1 cm, the solution absorbance is
| (1) |
In the presence of ligand at total concentration Lt, the absorbance of a solution containing the same total substrate concentration is
| (2) |
(where [S] is the concentration of the uncomplexed substrate, [L] the concentration of the uncomplexed ligand and [SL] is the concentration of the complex) which, combined with the mass balance on S and L, gives
| (3) |
where Δε11 = ε11 - εS - εL (εL molar absorptivity of the ligand). By measuring the solution absorbance against a reference containing ligand at the same total concentration Lt, the measured absorbance becomes
| (4) |
Combining equation (4) with the stability constant definition K11 = [SL]/[S][L], gives
| (5) |
where ΔA = A − Ao. From the mass balance expression St = [S] + [SL] we get [S] = St/(1 + K11[L]), which is equation (5), giving equation (6) at the relationship between the observed absorbance change per centimeter and the system variables and parameters.
| (6) |
Equation (6) is the binding isotherm, which shows the hyperbolic dependence on free ligand concentration.
The double-reciprocal form of plotting the rectangular hyperbola , is based on the linearization of equation (6) according to the following equation,
| (7) |
Thus the double reciprocal plot of 1/ΔA versus 1/[L] is linear and the binding constant can be estimated from the following equation
| (8) |
Fluorescence Spectroscopy
Fluorometric experiments were carried out on a Varian Cary Eclipse Spectrofluorometer. Stock solutions of polyamine 1 mM in buffer (pH=7.4) were prepared at room temperature (24 ±1°C). Various solutions of polyamine (1 to 500 μM) were prepared from the above stock solutions by successive dilutions, at 24 ±1°C. Solution of BSA (50 μM) in 10 mM Tris-HCl (pH. 7.4) was prepared at 24 ±1°C. The above solutions were kept in the dark and used soon after. Samples containing 0.4 ml of the above BSA solution and 0.4 ml of various polyamine solutions were mixed to obtain final polyamine concentration of 1 to 500 μM with constant BSA content 25 μM. The fluorescence spectra were recorded at λexc = 280 nm and λem from 287 to 500 nm. The intensity at 340 nm (tryptophane) was used to calculate the binding constant (K) according to literature reports.31-34
Molecular Modeling of Bovine Serum Albumin
Structure of BSA was predicted by automated homology modelling using SWISS-MODEL Workspace 35,36 from the amino acid sequence NP-851335. The structure of free HSA (PDB id: 1AO6, chain A), obtained from X-ray crystallography,37 was used as a template. These two proteins share 78.1% of sequence identity, which is sufficient to obtain reliable sequence alignment.38 Images of the structures were generated using Pymol (DeLano Scientific, Palo Alto, CA, USA). RMSD) between model and template proteins was 0.20 Å for positions of backbone atoms, as calculated with DeepView/Swiss-PdbViewer 4.0.1 (Scheme 2). The quality of the predicted BSA structure was found to be similar to the structure of free HSA used here as a template using structure and model assessment tools of SWISS-MODEL workspace
Results and Discussion
FTIR Spectra of Polyamine-BSA Complexes
The interaction of BSA with polyamines was characterized by infrared spectroscopy and its derivative methods. Since there was no major spectral shifting for the protein amide I band at 1656 cm-1 (mainly C=O stretch) and amide II band at 1545 cm-1 (C-N stretching coupled with N-H bending modes)39,40 upon polyamine interaction, the difference spectra [(protein solution + polyamine solution) − (protein solution)] were obtained, in order to monitor the intensity variations of these vibrations and the results are shown in Figure 1. Similarly, the infrared self-deconvolution with second derivative resolution enhancement and curve-fitting procedures25 were used to determine the protein secondary structures in the presence of polyamines (Figure 2 and Table 1).
Figure 1.
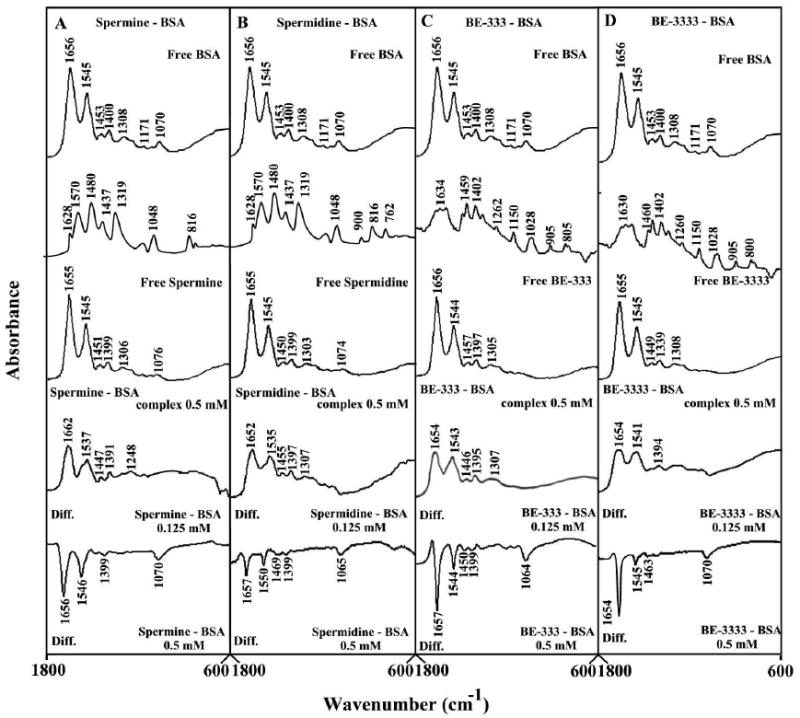
FTIR spectra in the region of 1800-600 cm-1 of hydrated films (pH 7.4) for free BSA and its complexes (A) spermine, (B), spermidine, (C) BE-333 and (D) BE-3333 with difference spectra (diff.) (bottom two curves) obtained at different polyamine concentrations (indicated on the figure).
Figure 2.
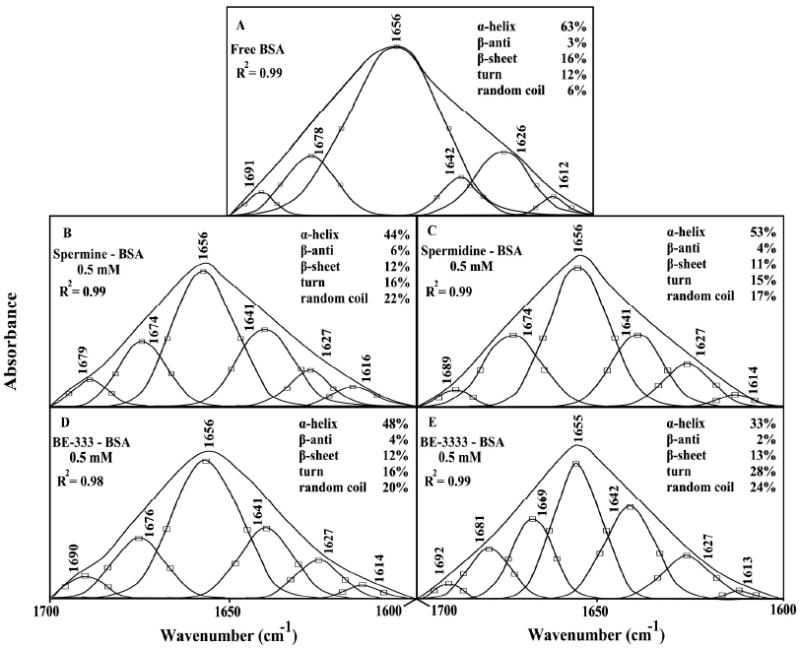
Second derivative resolution enhancement and curve-fitted amide I region (1700-1600 cm-1) for free BSA and its polyamine adducts with 0.5 mM polyamine and 0.25 mM protein concentrations at pH 7.4.
Table 1.
Secondary Structure Analysis (infrared spectra) for the Free BSA and Its Polyamine Complexes in Hydrated Film at pH 7.4
| Amide I components (cm-1) | free BSA (%) | spermine-BSA (%) | spermidine-BSA (%) | BE-333-BSA (%) | BE-3333-BSA (%) |
|---|---|---|---|---|---|
| 0.25 mM | 0.5 mM | 0.5 mM | 0.5 mM | 0.5 mM | |
| 1692-1680 β-anti (±1%) |
3 | 6 | 4 | 4 | 2 |
| 1680-1660 turn(±2%) |
12 | 16 | 15 | 16 | 28 |
| 1660-1650 α-helix(±3%) |
63 | 44 | 53 | 48 | 33 |
| 1648-1641 random coil (±2%) |
6 | 22 | 17 | 20 | 24 |
| 1640-1610 β-sheet (±2%) |
16 | 12 | 11 | 12 | 13 |
Experiments were repeated in 3 separate samples, and curve fitting and data analysis were performed on each experiment, and standard errors calculated. (for Tables 1 and 2)
At low polyamine concentration (0.125 mM), an increase in intensity was observed for the protein amide I at 1656 and amide II at 1545 cm-1, in the difference spectra of the polyamine-BSA complexes (Fig. 1, diff. 0.125 mM). Positive features are located in the difference spectra for amide I and II bands at 1662, 1537 cm-1 (spermine), 1652, 1535 cm-1 (spermidine), 1654, 1543 cm-1 (BE-333) and at 1654, 1541 cm-1 (BE-3333) in the polyamine-BSA adducts (Fig. 1, diff., 0.125 mM). These positive features are related to increase in the intensity of the amide I and amide II bands upon polyamine complexation The increase in intensity of the amide I and amide II bands is due to polyamine binding to protein C=O, C-N and N-H groups. Additional evidence to support the polyamine interaction with C-N and N-H groups comes from the shifting of the protein amide A band at 3290 cm-1 (N-H stretching mode) in the free BSA to 3285 (spermine-BSA), 3285 (spermidine-BSA) 3286 (BE-333-BSA) and 3285 cm-1 (BE-3333-BSA) upon polyamine interaction (spectra not shown).
As polyamine concentration increased to 0.5 mM, decrease in intensity of the amide I and amide II bands were observed with negative features in the difference spectra for amide I and II bands at 1656, 1546 cm-1 (spermine), 1657, 1550 cm-1 (spermidine), 1657, 1544 cm-1 (BE-333) and at 1654, 1545 cm-1 (BE-3333) in polyamine-BSA complexes (Fig. 1, diff., 0.5 mM). The decrease in intensity of the amide I band at 1656 cm-1, in the spectra of the polyamine-protein complexes suggests a major reduction of protein α-helical structure at high polyamine concentrations. Similar infrared spectral changes observed for protein amide I band in several ligand-protein complexes, where major protein conformational changes occurred.41
A quantitative analysis of the protein secondary structure for the free BSA and its polyamine adducts in hydrated films has been carried out and the results are shown in Figure 2 and Table 1. The free protein has 63% α-helix (1656 cm-1), 16% β-sheet (1626 and 1612 cm-1), 12% turn structure (1678 cm-1), 3% β-antiparallel (1691 cm-1) and random 6% coil (1642 cm-1) (Fig. 2A and Table 1). These results are consistent with spectroscopic studies of bovine serum albumin previously reported.42, 43 Upon polyamine interaction, a major decrease of α-helix from 63% (free BSA) to 44% (spermine-BSA), 53% (spermidine-BSA) and 48% (BE-333-BSA) and 33% (BE-3333-BSA) were observed at high polyamine content (Fig. 2 and Table 1). The reduction of protein α-helix content was accompanied by major increase in turn and random coil (Table 1). The random coil increased from 6% (free BSA) to 22% (spermine), 17% (spermidine), 20% (BE-333) and 24% (BE-3333) (Fig. 2 and Table 1). Similar increase was also observed for the turn structure from 12% (free BSA) to 16% (spermine), 15% (spermidine), 16% (BE-333) and 28% (BE-3333) (Table 1). These results are consistent with the decrease in the intensity of the protein amide I band at high polyamine content discussed above. The major decrease in α-helix structure and increase in random coil and turn suggest a partial protein unfolding at high polyamine concentration.
CD Spectroscopy
CD spectroscopy was also used to analyse the protein conformation in the polyamine-BSA complexes and the results are shown in Table 2. The CD results exhibit marked similarities with those of the infrared data (Table 2). The protein conformational analysis based on CD data suggests that free BSA has a high α-helical content of 62%, β-sheet 7%, turn 12% and random coil 19% (Table 2), which is consistent with the literature report.44 Upon polyamine interaction, major reduction of α-helix was observed from 62% free BSA to 50% in spermine, 55% spermidine, 46% BE-333 and 40% BE-3333 (Table 2). The major decrease in α-helix was accompanied by increase in the turn and random coil structures (Table 2). The major reduction of the α-helix with an increase in the turn and random structures is consistent with infrared results that showed reduction of α-helix and increase of random coil and turn structure due to a partial protein unfolding (Tables 1 and 2).
Table 2.
Secondary Structure of BSA Complexes (CD spectra) with Polyamines at pH 7.4. Calculated by CDSSTR Software.
| polyamine concentration (mM) | α-helix (± 3 %) | β-sheet (±2 %) | turn (± 2 %) | random (± 2 %) |
|---|---|---|---|---|
| Free BSA | 62 | 7 | 12 | 19 |
| spermine-BSA (0.5 mM) | 50 | 7 | 20 | 23 |
| spermidine-BSA (0.5 mM) | 55 | 5 | 18 | 22 |
| BE-333-BSA (0.5 mM) | 46 | 9 | 22 | 23 |
| BE-3333-BSA (0.5 mM) | 40 | 10 | 25 | 25 |
Hydrophobic Interactions
The protein CH2 anti-symmetric and symmetric stretching vibrations' in the region of 3000-2800 cm-1 were examined in order to detect the presence of hydrophobic contact in the polyamine-BSA complexes. The CH2 bands of the free BSA at 2952, 2933, 2912 and 2868 cm-1 shifted to 2957 and 2872 cm-1 (spermine-BSA), to 2958 and 2872 cm-1 (spermidine-BSA) to 2958 and 2871 cm-1 (BE-333-BSA) and to 2957, 2938 and 2877 cm-1 (BE-3333-BSA), upon polyamine-protein interaction (Fig. 3). The shifting of the protein anti-symmetric and symmetric CH2 stretching vibrations suggests the presence of hydrophobic interactions via polyamine aliphatic chain and hydrophobic pockets in BSA, which is consistent with fluorescence spectroscopic results discussed below.
Figure 3.
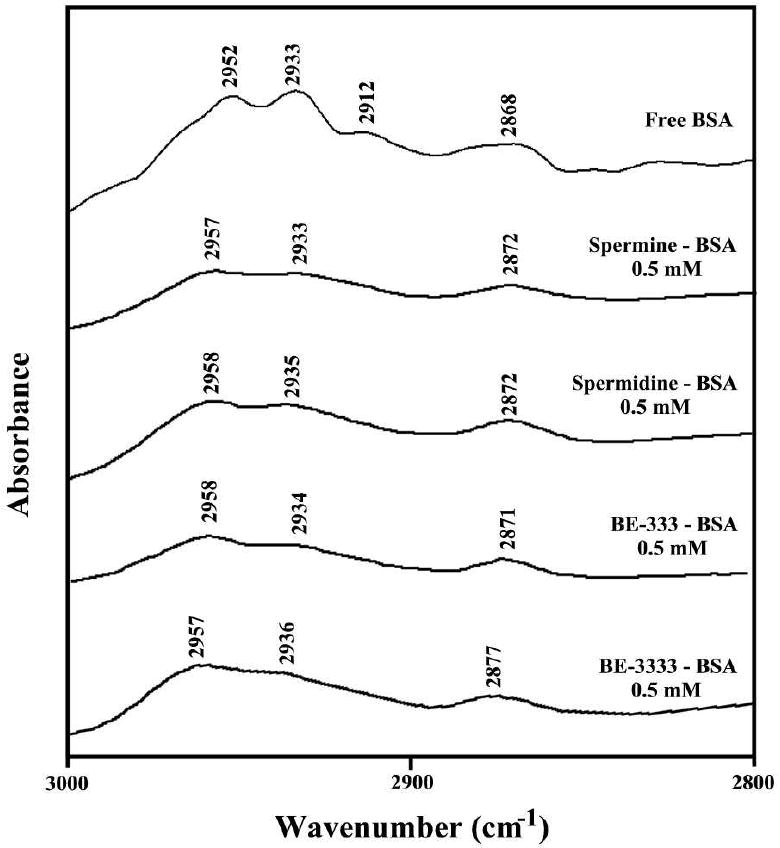
Spectral changes of protein CH2 symmetric and antisymmetric stretching vibrations upon polyamine complexation (the contribution from polyamine CH2 vibrations has been subtracted in this region).
Fluorescence Spectra and Stability of Polyamine-BSA Complexes
BSA has two tryptophan residues that possess intrinsic fluorescence.21 Trp-134 in the first domain and Trp-212 in the second domain. Trp-212 is located within a hydrophobic binding pocket of the protein and Trp-134 is on the surface in the hydrophilic region (Scheme 2). Tryptophan emission dominates BSA fluorescence spectra in the UV region. When other molecules interact with BSA, tryptophan fluorescence may change depending on the impact of such interaction on the protein conformation.22 On the assumption that there are (n) substantive binding sites for quencher (Q) on protein (B), the quenching reaction can be shown as follows:
| (9) |
The binding constant (KA), can be calculated as:
| (10) |
where, [Q] and [B] are the quencher and protein concentration, respectively, [QnB] is the concentration of non fluorescent fluorophore-quencher complex and [B0] gives total protein concentration:
| (11) |
| (12) |
The fluorescence intensity is proportional to the protein concentration as described:
| (13) |
Results from fluorescence measurements can be used to estimate the binding constant of polyamine-protein complex. From eq 4:
| (14) |
The accessible fluorophore fraction (f) can be calculated by modified Stern-Volmer equation:
| (15) |
where, F0 is the initial fluorescence intensity and F is the fluorescence intensities in the presence of quenching agent (or interacting molecule). K is the Stern-Volmer quenching constant, [Q] is the molar concentration of quencher and f is the fraction of accessible fluorophore to a polar quencher, which indicates the fractional fluorescence contribution of the total emission for an interaction with a hydrophobic quencher.22 The plot of F0/(F0 − F) vs 1/[Q] yields f-1 as the intercept on y axis and (fK)-1 as the slope. Thus, the ratio of the ordinate and the slope gives K. The decrease of fluorescence intensity of BSA is monitored at 340 nm for BSA-polyamine systems (Fig. 4A-D shows representative results for each system). The plot of F0/(F0 − F) vs l/[polyamine] (Fig. 4, A′-D′ show representative plots). Assuming that the observed changes in fluorescence come from the interaction between polyamine and BSA, the quenching constant can be taken as the binding constant of the complex formation. The K values given here are averages of four-replicate and six-replicate runs for BSA/polyamine systems, each run involving several different concentrations of polyamine (Fig. 4). The binding constants obtained were Kspm = 3.56 (±0.5) × 105 M-1, Kspmd = 1.77 (±0.4) × 105 M-1, KBE-333 = 1.11 (±0.3) × 104 M-1 and KBE-3333 = 3.90 (± 0.7) × 104 M-1 (Fig. 4 A′-D′). The binding constants calculated for the polyamine-BSA suggest low affinity polyamine-BSA binding, compared to the other strong ligand-protein complexes.44-46 However, lower binding constants (104 M-1 to 105 M-1) were also reported for several ligand-protein complexes using fluorescence spectroscopic methods.47-50 The binding constants of biogenic polyamines are larger than those of synthetic polyamines and this can be due to more reactive primary amine than secondary amine groups. However, the stability of polyamine-BSA adduct was charge dependent with spermine > spermidine for biogenic polyamine and BE-3333 > BE-333 for synthetic polyamines.
Figure 4.
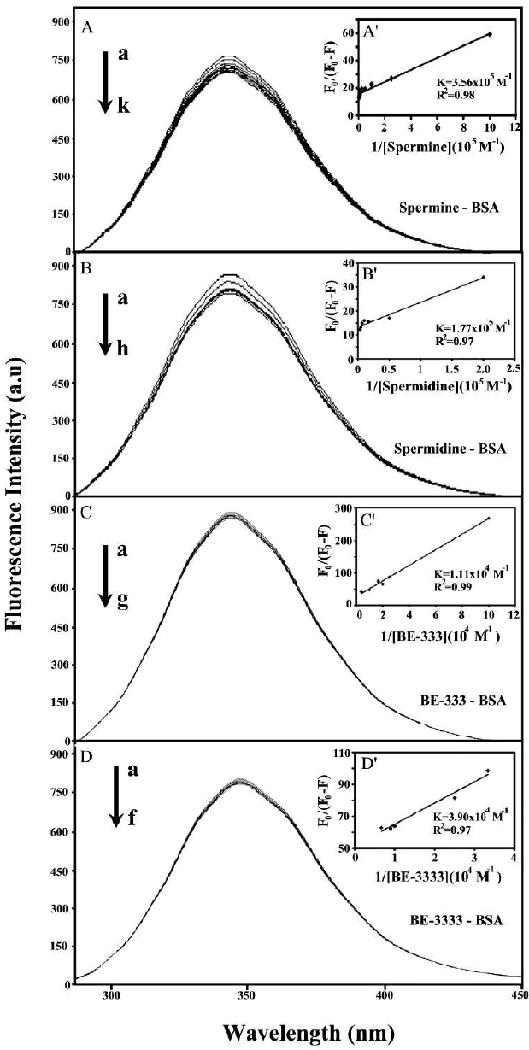
Fluorescence emission spectra of Polyamines-BSA systems in 10 mM Tris-HCl buffer pH 7.4 at 25 °C for A) spermine-BSA: (a) free BSA (25 μM), (b-k) with spermine at 1, 4, 10, 20, 40, 80, 100, 150, 200 and 300 μM; B) spermidine–BSA : (a) free BSA (25), (b-h) with spermidine at 5, 20, 60, 100, 150, 200 and 300 μM; C) BE-333-BSA: (a): free BSA (25 μM); (b-g) with BE-333 at 10, 40, 50, 60, 100 and 250 μM and D) BE-3333-BSA: (a): free BSA (25 μM); (b-f) with BE-3333 at 30, 40, 100, 150 and 200 μM. The plot of F0/(F0- F) as a function of 1/polyamine concentration. The binding constant K being the ratio of the intercept and the slope for (A′) spermine-BSA, (B′) spermidine-BSA, C′) BE-333-BSA and (D′) BE-3333-BSA complexes.
The f values of 0.60 (spermine-BSA), 0.55 (spermidine-BSA), 0.40 (BE-333-BSA) and 0.45 (BE-3333-BSA) obtained for polyamine-BSA complexes suggest that polyamines interact partially with fluorophore via hydrophobic interactions. As a result, we predict that polyamine binds mainly with the two fluorophores Trp-212 buried inside and Trp-134 located on the surface of BSA. This argument is based on the fact that the emissions, λmax of Trp-212 and Try-134 are at 340 nm (Fig. 4A-C), which is the emission region of hidden tryptophan molecules, while fluorescence emission of exposed tryptophan molecule is at a higher wavelength (350 nm) due to solvent relaxation.51-54 The tightening of protein structure through intramolecular interactions, such as hydrogen bonds seem to bury Trp-212 in a more hydrophobic environment. The change in fluorescence intensity of Trp-212 and Trp-134 in the presence of polyamines may arise as a direct quenching or as a result of protein conformational changes induced by polyamine-BSA complex formation. These results indicate that polyamine interaction does not change the emission λmax at 340 nm. No spectral shift was observed for the emission spectra upon polyamine-BSA complexes, indicating that Trp-212 molecule is not exposed to any change in polarity. The emission λmax of quenched tryptophan remains at 340 nm suggesting that polyamines interact with BSA via hydrophobic region located inside and on the surface. This argument is consistent with the infrared analysis of protein CH2 antisymmetric and symmetric stretching vibrations that showed hydrophobic contact in polyamine-BSA complexes (Fig. 3).
We have also calculated the binding constants of polyamine-BSA complexes using fluorescence data for model developed by McGhee and von Hippel 55-56 for a non-linear non-co-operative ligand binding system. The results were analyzed using the following equation:
| (16) |
where r is the molar ratio of bound polyamine per protein and Cf is the concentration of free polyamine given by Cf = (Ct-Cb), where Ct is the total polyamine concentration and Cb is the concentration of bound polyamine, K is the binding constant and ‘n’ is the number of protein bound by one polyamine molecule estimated 1,11 (spm), 1.30 (spmd), 0.99 (BE-333) and 0.98 (BE-3333). The binding constants of the polyamine-BSA complexes are Kspm = 5.5 (±0.8) × 105 M-1, Kspmd = 3.2 (±0.5) × 105 M-1, KBE-333 = 1.3 (±0.3) × 104 M-1 and KBE-3333 = 2.70 (± 0.7) × 104 M-1, that are comparable with those of the K values estimated by Stern-Volmer (discussed above) and the UV-Visible results. The McGhee-von Hippel analysis produced 2-fold higher K values than that obtained from Stern-Volmer analysis, suggesting a different form of binding for biogenic polyamines to the protein compared to polyamine analogue-BSA binding. This can be explained by the presence of reactive primary amino groups in biogenic polyamines, whereas the pendant amino groups are ethyl substituted in analogues The ethyl groups can also exert steric effects.
UV Spectra and Stability of Polyamine-BSA Complexes
The polyamine-BSA binding constants were also determined using UV-visible spectroscopic method (described in Materials and Methods). Thus the double reciprocal plot of 1/ΔA versus 1/[L] is linear and the binding constant can be estimated from the intercept to slope (Fig. 5A-D). One binding site was observed for each polyamine-protein complex with the overall binding constants of Kspm-BSA= 2.88 (±0.5) × 105 M-1, Kspmd-BSA = 1.14(±0.3) × 105 M-1, KBE-333-BSA= 1.19 (±0.3) × 104 M-1 and KBE-333--BSA = 3.30 (±0.6) × 104 M-1 (Fig. 5A′-D′). The association constants calculated for the polyamine-BSA adducts from UV spectroscopy are consistent with those from fluorescence spectroscopy with Kspm = 3.56 (±0.5) × 105 M-1, Kspmd = 1.77 (±0.4) × 105 M-1, KBE-333 = 1.11 (±0.3) × 104 M-1 and KBE-3333 = 3.90 (± 0.7) × 104 M-1 (Fig. 4A′-D′). It appears that in general biogenic polyamines form more stable complexes than polyamine analogues due to more reactive primary NH3+ than secondary NH2+ groups.
Figure 5.
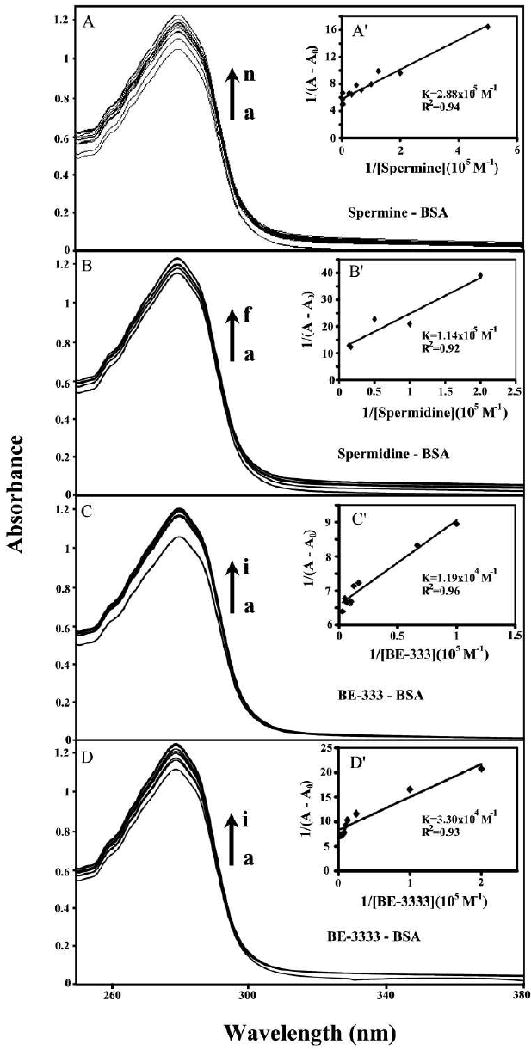
UV-Visible spectra of polyamine-BSA systems in 10 mM Tris-HCl buffer pH 7.4 at 25 °C for A) spermine-BSA: (a) free BSA (25 μM), (b-n) BSA 25 μM with spermine at 2, 5, 8, 10, 15, 20, 30, 40, 250, 300, 350, 400 and 500 μM; B) spermidine-BSA : (a) free BSA (25 μM), (b-f) BSA 25 μM with spermidine at 5, 10, 20, 60 and 70 μM; C) BE-333- BSA: (a): free BSA (25 μM); (b-i) BSA 25 μM with BE-333 at 10, 15, 60, 80, 100, 150, 200 and 350 μM and D) BE-3333- BSA: (a): free BSA (25 μM); (b-i) BSA 25 μM with BE-3333 at 5, 10, 40, 80, 100, 125, 150 and 300 μM. The plot of 1/(A-A0) as a function of 1/polyamine concentration. The binding constant K being the ratio of the intercept and the slope for A′) spermine-BSA, B′) spermidine-BSA, C′) BE-333-BSA and D′) BE-3333-BSA complexes
Comparison Between Polyamine-BSA and Polyamine-HSA Complexes
HSA and BSA are homologue proteins showing 78.1% of sequence identity. BSA contains two tryptophan residues (Trp-212 and Trp-134), while HSA has one tryptophan (Trp- 214). The BSA three dimensional structures is very similar to HSA as suggested by the 3D-modeling presented here (Scheme 2). Based on our spectroscopic data, polyamine binding to BSA occurs via hydrophilic and hydrophobic interactions and causes a partial protein unfolding. Similarly, the polyamine complexation with HSA induced protein unfolding.11,12 However stronger polyamine-protein interaction was observed for BSA-polyamines with binding constants Kspm-BSA= 3.56 × 10⁵ M-1, Kspmd-BSA= 1.77 × 10⁵ M-1, KBE-333-BSA= 1.11 × 10⁴ M-1 and KBE-3333-BSA= 3.90 × 10⁴ M-1 than those of polyamine-HSA complexes previously reported Kspem-HSA= 1.7 × 10⁴ M-1, Kspmd-HSA= 5.4 × 10³ M-1, KBE-333-HSA = 5.63 × 10² M-1 and KBE-3333-HSA = 3.66 × 10² M-1.11,12 The extra stability of polyamine-BSA complexes over polyamine-HSA adducts can be related to the presence of Trp-134 in hydrophilic region of BSA (absent in HSA), which provides hydrophilic contact between polyamine positively charged amine group and the protein C=O, C-N and NH groups on the surface. Similarly, polyamine interaction induced more perturbations of BSA conformation than HSA by a major reduction of α-helix structure from 63% (free BSA) to 33-55% in the polyamine-BSA complexes, while in HSA the α-helix changed from 55% (free HSA) to 43-50% in polyamine-HSA adducts.11,12 The observed structural changes are indicative of a larger protein unfolding for BSA than HSA upon polyamine complexation.
In summary, our results predict a weak interaction between polyamines and BSA, suggesting that serum albumins might act as carrier proteins for exogenous polyamines. Using fluorescence and UV spectroscopic techniques, and three methods of data analysis, we show ionic and structural specificity effects of polyamines in their binding to BSA. In addition, FT-IR and CD spectroscopic studies show a reduction in the α helical content of the protein, with a consequent increase in random coils.
Acknowledgments
This work was supported by a grant from Natural Sciences and Engineering Research Council of Canada (NSERC), by NIH grant CA080163 and grants from the Foundation of the University of Medicine and Dentistry of New Jersey ((64-09 and 30-09).
Abbreviations
- BSA
bovine serum albumin
- spm
spermine
- spmd, spermidine, 333
1,1-diamino-4,8-diazaundecane.4HCl
- BE-333
3,7,11,15-tetrazaheptadecane.4HCl
- BE-3333
3,7,11,15,19-pentazahenicosane.5HCl
- FTIR
Fourier transform infrared spectroscopy
- CD
circular dichroism
References and Notes
- 1.Tabor CW, Tabor H. Annu Rev Biochem. 1984;53:749–790. doi: 10.1146/annurev.bi.53.070184.003533. [DOI] [PubMed] [Google Scholar]
- 2.Pegg AE. Cancer Res. 1988;48:759–774. [PubMed] [Google Scholar]
- 3.Thomas T, Thomas TJ. Cell Mol Life Sci. 2001;58:244–258. doi: 10.1007/PL00000852. [DOI] [PMC free article] [PubMed] [Google Scholar]
- 4.Childs AC, Mehta DJ, Gerner EW. Cell Mol Life Sci. 2003;60:1394–1406. doi: 10.1007/s00018-003-2332-4. [DOI] [PMC free article] [PubMed] [Google Scholar]
- 5.Hahm AA, Dunn VR, Butash KA, Deveraux WL, Woster PM, Casero RA, Jr, Davidson NE. Clin Cancer Res. 2001;7:391–397. [PubMed] [Google Scholar]
- 6.Ahmed Ouameur A, Tajmir-Riahi HA. J Biol Chem. 2004;279:42042–42054. doi: 10.1074/jbc.M406053200. [DOI] [PubMed] [Google Scholar]
- 7.Ruiz-Chica AJ, Medina MA, Snachez-Jimenz F, Ramirez FJ. Nucl Acids Res. 2004;32:579–589. doi: 10.1093/nar/gkh232. [DOI] [PMC free article] [PubMed] [Google Scholar]
- 8.N'soukpoé-Kossi CN, Ahmed Ouameur A, Thomas T, Shirahata A, Thomas TJ, Tajmir-Riahi HA. Biomacromolecules. 2008;9:2712–2718. doi: 10.1021/bm800412r. [DOI] [PubMed] [Google Scholar]
- 9.N'soukpoé-Kossi CN, Ahmed Ouameur A, Thomas T, Thomas TJ, Tajmir-Riahi HA. Biochem Cell Biol. 2009;87:621–630. doi: 10.1139/o09-036. [DOI] [PubMed] [Google Scholar]
- 10.Shah N, Thomas T, Shirahata A, Sigal LH, Thomas TJ. Biochemistry. 1999;38:14763–14774. doi: 10.1021/bi991291v. [DOI] [PubMed] [Google Scholar]
- 11.Beauchemin R, N' soukpoe-Kossi CN, Thomas TJ, Thomas T, Carpentier R, Tajmir-Riahi HA. Biomacromolecules. 2007;8:3177–3183. doi: 10.1021/bm700697a. [DOI] [PMC free article] [PubMed] [Google Scholar]
- 12.Ahmed Ouameur A, Mangier E, Diamantoglou S, Rouillon R, Carpentier R, Tajmir-Riahi HA. Biopolymers. 2004;73:503–509. doi: 10.1002/bip.10557. [DOI] [PubMed] [Google Scholar]
- 13.Carter DC, Ho JX. Adv Protein Chem. 1994;45:153–203. doi: 10.1016/s0065-3233(08)60640-3. [DOI] [PubMed] [Google Scholar]
- 14.Highley MS, DeBruijin EA. Pharm Res. 1996;13:186–195. doi: 10.1023/a:1016074627293. [DOI] [PubMed] [Google Scholar]
- 15.Sudlow G, Birkett DJ, Wade DN. Mol Pharmacol. 1975;11:824–832. [PubMed] [Google Scholar]
- 16.Shcharbin D, Janicka M, Wasiak M, Palecz B, Przybyszewska M, Zaborski M, Bryszewska M. Biochim Biophys Acta. 2007;1774:946–951. doi: 10.1016/j.bbapap.2007.04.016. [DOI] [PubMed] [Google Scholar]
- 17.Shcharbin D, Klajnert B, Mazhul V, Bryszewska M. J Fluorescence. 2005;15:21–28. doi: 10.1007/s10895-005-0209-7. [DOI] [PubMed] [Google Scholar]
- 18.Peters T. All about albumin Biochemistry, Genetics and Medical Applications. Academic Press; San Diego: 1996. [Google Scholar]
- 19.He XM, Carter DC. Nature. 1992;358:209–215. doi: 10.1038/358209a0. [DOI] [PubMed] [Google Scholar]
- 20.Peters T. Adv Protein Chem. 1985;37:161–245. doi: 10.1016/s0065-3233(08)60065-0. [DOI] [PubMed] [Google Scholar]
- 21.Tayeh N, Rungassamy T, Albani JR. J Pharm Biomed Anal. 2009;50:107–116. doi: 10.1016/j.jpba.2009.03.015. [DOI] [PubMed] [Google Scholar]
- 22.Lakowicz JR. Principles of Fluorescence Spectroscopy. 2nd. Kluwer/Plenum; New York: 1999. [Google Scholar]
- 23.Painter L, Harding MM, Beeby PJ. J Chem Soc, Perkin Trans. 1998;18:3041–3044. [Google Scholar]
- 24.Dousseau F, Therrien, Pezolet M. Apfgpl Spectrosc. 1989;43:538–542. [Google Scholar]
- 25.Byler DM, Susi H. Biopolymers. 1986;25:469–487. doi: 10.1002/bip.360250307. [DOI] [PubMed] [Google Scholar]
- 26.Ahmed A, Tajmir-Riahi HA, Carpentier R. FEBS Lett. 1995;363:65–68. doi: 10.1016/0014-5793(95)00282-e. [DOI] [PubMed] [Google Scholar]
- 27.Johnson WC. Proteins Struct Funct Genet. 1999;35:307–312. [PubMed] [Google Scholar]
- 28.Sreerama N, Woddy RW. Anal Biochem. 2000;287:252–260. doi: 10.1006/abio.2000.4880. [DOI] [PubMed] [Google Scholar]
- 29.Stephanos JJ. J Inorg Biochem. 1996;62:155–169. doi: 10.1016/0162-0134(95)00144-1. [DOI] [PubMed] [Google Scholar]
- 30.Connors K. Binding constants: The measurement of molecular complex stability. John Wiley & Sons; New York: 1987. [Google Scholar]
- 31.Tang J, Qi S, Chen X. J Mol Struct. 2005;779:87–95. [Google Scholar]
- 32.Bi S, Ding L, Tian Y, Song D, Zhou X, Liu X, Zhang H. J Mol Struct. 2004;703:37–45. [Google Scholar]
- 33.He W, Li Y, Xue C, Hu Z, Chen X, Sheng F. Bioorg & Med Chem. 2005;13:1837–1845. doi: 10.1016/j.bmc.2004.11.038. [DOI] [PubMed] [Google Scholar]
- 34.Dufour C, Dangles O. Biochim Biophys Acta. 2005;1721:164–173. doi: 10.1016/j.bbagen.2004.10.013. [DOI] [PubMed] [Google Scholar]
- 35.Arnold K, Bordoli L, Kopp J, Schwede T. Bioinformatics. 2006;22:195–201. doi: 10.1093/bioinformatics/bti770. [DOI] [PubMed] [Google Scholar]
- 36.Rost B. Protein Engineering. 1999;12:85–94. doi: 10.1093/protein/12.2.85. [DOI] [PubMed] [Google Scholar]
- 37.Sugio S, Kashima A, Mochizuki S, Noda M, Kobayashi K. Protein Engineering. 1999;12:439–446. doi: 10.1093/protein/12.6.439. [DOI] [PubMed] [Google Scholar]
- 38.Schwede T, Kopp J, Guex N, Peitsch MC. Nucl Acids Res. 2003;31:3381–3385. doi: 10.1093/nar/gkg520. [DOI] [PMC free article] [PubMed] [Google Scholar]
- 39.Krimm S, Bandekar J. Adv Protein Chem. 1986;38:181–364. doi: 10.1016/s0065-3233(08)60528-8. [DOI] [PubMed] [Google Scholar]
- 40.Froehlich E, Mandeville JS, Jennings CJ, Sedaghat-Herati R, Tajmir-Riahi HA. J Phys Chem B. 2009;113:6986–6993. doi: 10.1021/jp9011119. [DOI] [PubMed] [Google Scholar]
- 41.Ahmed Ouameur A, Diamantoglou S, Sedaghat-Herati MR, Nafisi Sh, Carpentier R, Tajmir-Riahi HA. Cell Biochem Biophys. 2006;45:203–214. doi: 10.1385/cbb:45:2:203. [DOI] [PubMed] [Google Scholar]
- 42.Tian J, Liu J, Hu Z, Chen X. Am J Immunol. 2005;1:21–23. [Google Scholar]
- 43.Grdadolnik J. Acta Chim Slov. 2003;50:777–788. [Google Scholar]
- 44.Kragh-Hansen U. Dan Med Bull. 1990;37:57–84. [PubMed] [Google Scholar]
- 45.Kratochwil NA, Huber W, Muller F, Kansy M, Gerber PR. Biochem Pharmacol. 2002;64:1355–1374. doi: 10.1016/s0006-2952(02)01074-2. [DOI] [PubMed] [Google Scholar]
- 46.N'soukpoe-Kossi CN, Sedaghat-Herati MR, Ragi C, Hotchandani S, Tajmir-Riahi HA. Intl J Biol Macromol. 2007;40:484–490. doi: 10.1016/j.ijbiomac.2006.11.005. [DOI] [PubMed] [Google Scholar]
- 47.Liu J, Tian J, Hu Z, Chen X. Biopolymers. 2004;73:443–450. doi: 10.1002/bip.20000. [DOI] [PubMed] [Google Scholar]
- 48.Dockal M, Chang C, Carter DC, Ruker F. J Biol Chem. 2000;275:3042–3050. doi: 10.1074/jbc.275.5.3042. [DOI] [PubMed] [Google Scholar]
- 49.Liang L, Tajmir-Riahi HA, Subirade M. Biomacromolecules. 2008;9:50–55. doi: 10.1021/bm700728k. [DOI] [PubMed] [Google Scholar]
- 50.Sulkowska A. J Mol Struct. 2002;614:227–232. [Google Scholar]
- 51.Ward LD. Methods Enzymol. 1995;117:400–404. doi: 10.1016/s0076-6879(85)17024-2. [DOI] [PubMed] [Google Scholar]
- 52.Huang BX, Dass C, Kim YH. Biochem J. 2005;387:695–702. doi: 10.1042/BJ20041624. [DOI] [PMC free article] [PubMed] [Google Scholar]
- 53.Jiang M, Xie MX, Zheng D, Liu Y, Li XY, Chen X. J Mol Struct. 2004;692:71–80. [Google Scholar]
- 54.Charbonneau DM, Tajmir-Riahi HA. J Phys Chem B. 2010;114:1148–1155. doi: 10.1021/jp910077h. [DOI] [PubMed] [Google Scholar]
- 55.McGhee JD, von Hippel PH. J Mol Biol. 1974;25:469–489. doi: 10.1016/0022-2836(74)90031-x. [DOI] [PubMed] [Google Scholar]
- 56.Tsodikov OV, Holbrook JA, Shkel IA, Record MT., Jr Biophys J. 2001;81:1960–1969. doi: 10.1016/S0006-3495(01)75847-X. [DOI] [PMC free article] [PubMed] [Google Scholar]


