

Abstract
Background and Purpose
Previous studies have shown motor impairment after a stroke relates to lesion size and location, but unexplained variability in recovery still exists. In this study, we used lesion-mapping techniques in combination with diffusion tensor imaging to quantitatively test the hypothesis that motor recovery in chronic stroke patients is inversely related to the proportion of the corticospinal tract (CST) affected by the lesion.
Methods
We studied 50 chronic stroke patients, all of whom presented with moderate to severe motor impairments in the acute stage, using high-resolution anatomical MRI. We evaluated the degree of motor impairment with the Upper Extremity module of the Fugl-Meyer Assessment (UE-FM). To analyze the relationship between CST damage and UE-FM scores, we calculated a CST-lesion load for each patient by overlaying the patient’s lesion map with a probabilistic tract derived from diffusion tensor images of age-matched healthy subjects.
Results
CST-lesion load was a significant predictor of motor deficit. Infarct size, despite correlating with motor scores, did not significantly predict impairment.
Conclusions
Our results show the degree of functional motor deficit after a stroke is highly dependent on the overlap of lesions with the CST, and not lesion size per se. In the future, automated calculation of CST-lesion load may allow more precise prediction of motor impairment after stroke.
Keywords: lesion-mapping, diffusion tensor imaging, motor recovery, corticospinal tract
Introduction
Scientists have employed many different neurophysiological and imaging techniques in their attempts to identify the major predictors of motor impairment in chronic stroke. Results of structural imaging studies have suggested both lesion size1,2 and lesion location3–6 to correlate with impairment and that the involvement of motor-related cortical regions (both primary and non-primary motor areas), corona radiata, and internal capsule progressively decrease the probability of upper limb functional recovery.3,6 These findings are complemented by results of recent diffusion tensor imaging (DTI) studies,7 which established relationships between impairment in the acute and sub-acute phases and damage to the descending motor tracts.8–11 Nevertheless, much of the variability in recovery remains unexplained due to the lack of advanced quantitative mapping tools that directly associate lesion location with relevant fiber tracts.
The ability to predict motor impairment based on lesion topography and measures of fiber tract damage can be enhanced by using lesion–behavior mapping techniques. When performed on a voxel-by-voxel basis, these methods are particularly advantageous as they can identify those brain regions critical for certain behaviors without a priori hypotheses.12,13 For motor impairment in chronic stroke patients, however, a priori hypotheses are appropriate because the functional role of the motor cortex and descending motor tracts has already been clearly demonstrated. As such, ROI-based lesion analyses can be used to examine whether extent of damage to specific, predetermined fiber tracts can serve as a surrogate marker of impairment while avoiding the possible decrease in statistical power associated with voxel-by-voxel methods.14 In addition, analyses combining lesion site and lesion size with fiber tract morphology have the potential to further our understanding of clinico-anatomical correlations and to delineate the fundamental processes that underlie motor recovery.
Accordingly, we overlaid lesion maps of fifty stroke patients with a DTI-derived probabilistic map of the corticospinal tract (CST) and quantitatively examined the relationship between volume of lesion–CST overlap and motor impairment after stroke. We hypothesized that motor recovery is inversely related to the proportion of the CST affected by the lesion and, furthermore, that extent of lesion damage along the CST would be a better predictor of motor outcome than lesion size alone.
Methods
Subjects
The study group consisted of fifty patients, all of whom had ischemic strokes in the anterior circulation at least 6 months before entering the study (twelve women; mean age 58.6±13.9 years; median time post stroke 17.1 months, inter-quartile range 6.5–37.5 months; 21 right-hemisphere and 29 left-hemisphere strokes; 48 right-handed and 2 left-handed individuals). Each patient had a Medical Research Council (MRC) strength grade ≤3/5 in the extensor muscles of the affected upper extremity in the first 24 hours after symptom onset. All patients in this study required inpatient rehabilitation, which consisted of standard physical and occupational therapy. Exclusion criteria were: bi-hemispheric or brainstem infarcts, primary intracerebral hemorrhages, previous history of stroke or consecutive stroke, or other concomitant neurological diseases. Patients were assessed using the Upper Extremity module of the Fugl-Meyer Assessment (UE-FM).15 The UE-FM is a 30-item motor function assessment with scores ranging from 0 to 66; higher scores reflect more complete functional recovery. It is the most frequently used clinical motor impairment test in stroke rehabilitation research.16
An additional ten healthy subjects were enrolled as age-matched controls (four women; mean age 58.2±12.2 years); age at assessment for this study did not differ significantly between the patient group and the healthy control group (F(1,58)=0.006, p=0.940). All control subjects were right-handed and had no previous history of stroke or other neurological or psychiatric diseases. Routine MR imaging of their brains did not show any focal abnormalities and there was no evidence of clinically silent strokes. This study was approved by the local IRB, and all participants gave written informed consent.
MRI Acquisition and Preprocessing
All participants were scanned on a 3T GE scanner using a standard radiofrequency head-coil. Head motion was minimized via foam padding and forehead restraining straps. A T1-weighted high-resolution scan (voxel resolution: 0.93×0.93×1.5 mm3) and a set of axial FLAIR images (0.5×0.5×5 mm3) were acquired. T1-weighted and FLAIR images were realigned and spatially normalized into images of isotropic voxel size (2×2×2 mm3) using SPM5 (Wellcome Department of Neurology, London, UK) implemented in Matlab (The Mathworks Inc., Natick, MA). For patients with extensive lesions, the infarct was excluded from the cost function calculation of the spatial normalization process17 using lesion masks drawn in MRIcro.18
Lesion-mapping
We used MRIcro18 to define the lesions in the spatially normalized T1-weighted images. For each patient, we manually outlined the lesion area on each slice of the normalized T1-weighted images while using the FLAIR images as an additional guide to confirm the extent of the lesion. In cases with marked ventricular dilatation due to extensive ischemic lesions and consequent hemispheric atrophy, no part of the dilated ventricle was included in the lesion area. Lesions were drawn by a single rater who was blinded to the patients’ UE-FM scores. A second blinded rater drew lesions in a subset of 10 patients in order to calculate an inter-observer reliability (R2=0.92). In order to display all lesions on the same side during final calculations, right-hemispheric lesion maps (n=21) were mirrored across the mid-sagittal axis.
Diffusion Tensor Imaging: Image Acquisition and Analysis
The control subjects underwent DTI using a single-shot, spin-echo EPI sequence with the following parameters: TR=10 s; TE=86.9 ms; resolution 2.6×2.6.×2.6 mm3; 30 non-collinear diffusion directions with a b-value of 1000 s/mm2 and 6 acquisitions with a value of 0 s/mm2. A total of 56 slices covered the entire brain including the brainstem. Fractional anisotropy (FA), a measure of the degree of directional preference of water diffusion, was calculated for each brain voxel.
Diffusion tensors were calculated for every voxel using MedINRIA 1.7,19 which performs the estimation with a least-squares on the linearized version of the Stejskal & Tanner diffusion equation.20 After estimation, non-positive tensors were detected and replaced by the Log-Euclidian average of all positive-definite neighboring tensors. Log-Euclidian interpolation21 has been shown to preserve tensor volume (i.e., interpolation of tensor volume is monotonic) and, consequently, to not introduce more diffusion than there is initially (no swelling effect22).
Tractography was then applied to the DTI data to reconstruct white matter tracts by successively following the path of preferred direction of water diffusion. Fiber tracts were traced using tensorlines,23 a modified streamline algorithm that connects adjacent voxels with similar principal eigenvectors while simultaneously using advection vectors to stabilize propagation through regions with non-linear preferential diffusion. Tri-linear Log-Euclidean interpolation21 is used throughout tracking to produce fibers with smoother trajectories.
We applied a threshold FA value of 0.2 and a smoothness factor23 of 0.2 for continuous fiber reconstruction; these parameters are similar to those reported by other researchers who have used continuous tracking algorithms to reconstruct fibers.23,24
Three regions of interest (ROIs) were drawn on each patient’s FA images. The analysis was started with an ROI in the posterior limb of the internal capsule (PLIC; at a level corresponding to z=8 of a spatially normalized brain in Talairach space25). A second ROI was drawn in the anterior pons (basis pontis; z=−24), where neuroanatomical26 and tractography studies27 locate the fiber bundle constituting the pyramidal tract. A logical AND-function was added so that only fibers passing through both the PLIC and basis pontis were considered for further analysis. A third ROI included the precentral gyrus along with its underlying white matter (z=50). A logical AND-function was also added for this ROI so that only those fibers originating in the precentral gyrus and passing through both the PLIC and the pons were designated as part of the CST. Fibers that went to the cerebellum were excluded by drawing ROIs in the superior cerebellar peduncle and the middle cerebellar peduncle and applying a logical NOT-function in conjunction with the other ROIs.
The reconstructed fiber tract of each control subject was transformed into a binary image and spatially normalized using SPM5. We abstained from using patients’ CSTs because their structurally abnormal tracts would have varied greatly due to the ischemic lesions and subsequent Wallerian degeneration.28,29
Calculation of Lesion–CST Overlap
After normalization, the binary CSTs of the ten healthy control subjects were summed to generate a fiber map using Matlab (Figure 1). Voxel intensities ranged from I=0 (i.e. voxel is not part of the CST in any of the subjects) to I=10 (i.e. voxel is part of the CST in all ten subjects); thus, the probability that a particular voxel would be part of the CST was calculated as one-tenth of the voxel’s intensity.
Figure 1. Probabilistic CST Fiber Map.

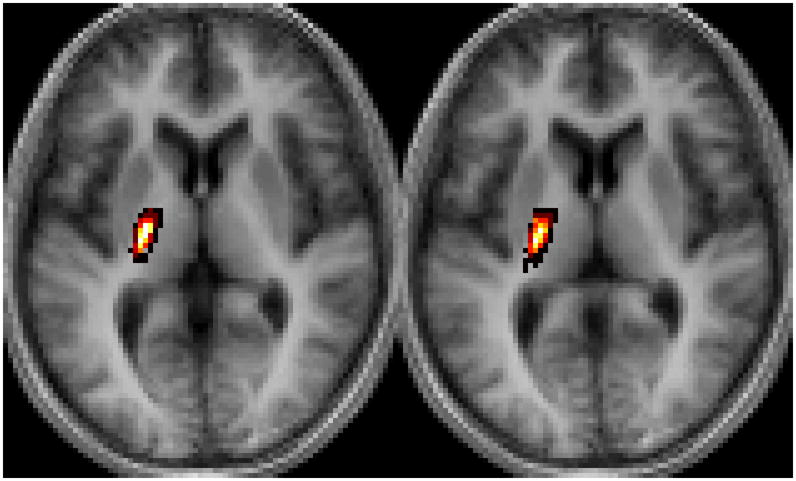
(A) The coronal slices shown correspond to y=−20 and −18 and (B) the axial slices correspond to z=6 and 4 in Talairach space.25
For each lesion, a raw lesion–tract overlap volume (Vraw) was calculated by overlaying the lesion map onto the probabilistic CST and summing the intensities of all intersecting voxels. This calculation is denoted by the equation
where nmax is the total number of intersecting voxels between the lesion map and fiber map, and I(n) is the intensity of the nth voxel (as represented in the fiber map). It should be noted that this method weighs voxels according to their individual probabilities of being part of the CST, as opposed to treating all voxels with intensities above a certain threshold equally (i.e. utilizing isocontours30,31).
A weighted lesion–tract overlap volume was then calculated for each lesion using a method similar to the previously-employed proportional grid system.3 This weighted overlap accounts for the narrowing of the CST as it descends from the motor cortex to the PLIC by multiplying the lesion–tract overlap on each slice by the ratio of the maximum cross-sectional area of the tract to the cross-sectional area of the tract on that particular slice.
While the proportional grid system—which used the Talairach & Tournoux atlas25 as a reference—arbitrarily divided the region between the motor cortex and the inter-commissural plane into five levels (one cortical and four subcortical layers) and assigned a different weighting factor to each layer, we instead chose to calculate a different weighting factor for each individual slice (x) at every intensity level (I). For a particular slice x containing m(x, I) voxels with intensity ≥I, a weighting factor f(x, I) was calculated as
where m(x*, I) denotes the number of voxels on the slice x* that contains the most voxels of intensity ≥I. Thus, for any intensity I, the slice (x*) with the most voxels ≥I was assigned a weighting factor of f(x*, I) =1. For each patient, a weighted lesion–CST volume was then calculated using the following equation
where nmax is the total number of intersecting voxels between the lesion map and fiber map, I(n) is the intensity of the nth voxel located on slice x(n), and f(x(n), I(n)) is the weighting factor for the voxel. We will refer to the variables Vraw and Vweighted as raw and weighted CST lesion load, respectively.
Results
Motor impairment correlated significantly with raw CST-lesion load (R2=0.664, p<0.001; Figure 2A), weighted CST-lesion load (R2=0.724, p<0.001; Figure 2B), and lesion size (R2=0.307, p<0.001; Figure 2C).
Figure 2. Regression Analyses.

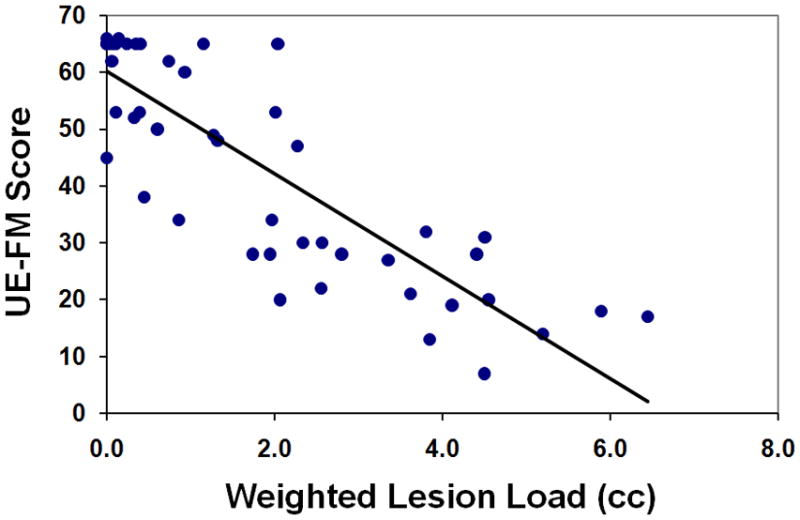
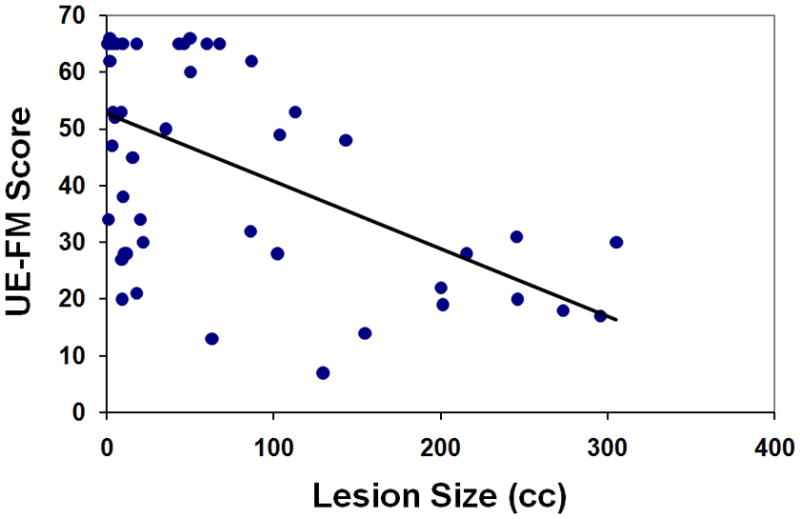
UE-FM scores are plotted as functions of (A) raw CST-lesion load, (B) weighted CST-lesion load, and (C) lesion size.
A regression analysis was first conducted using raw CST-lesion load and lesion size as predictors of motor impairment (adjusted R2=0.656, p<0.001). While raw CST-lesion load significantly predicted UE-FM scores (partial R2=0.524, p<0.001), lesion size was shown not to be a significant predictor of motor impairment (partial R2=0.016, p=0.383). A second regression analysis was then conducted using weighted CST-lesion load and lesion size as predictors of motor impairment (adjusted R2=0.720, p<0.001). Again, lesion size did not significantly predict motor impairment (partial R2=0.023, p=0.302), whereas the weighted CST-lesion load did (partial R2=0.613, p<0.001).
A final regression analysis was conducted using lesion size and both raw and weighted CST-lesion load as predictors of UE-FM score (adjusted R2=0.727, p<0.001). Weighted CST-lesion load was shown to be a better predictor (partial R2=0.223, p=0.001) than either raw CST-lesion load (partial R2=0.045, p=0.147) or lesion size (partial R2=0.007, p=0.568).
Discussion
We used lesion–behavior mapping techniques to analyze the relationship between motor function and lesion-load of the CST in chronic stroke patients. Our results inform a longstanding debate regarding the relationship between infarct size and clinical outcome measures of stroke. While several studies have reported significant but moderate correlations between motor impairment and lesion size, others have argued that no statistically significant relationship exists.32 In our study, infarct size, despite correlating with UE-FM score, did not predict motor impairment. In contrast, the partial correlations of CST-lesion load with UE-FM scores remained highly significant in the regression analyses, which suggest that, in fact, infarct size is merely masking the effect of lesion damage within the CST (Figure 3).
Figure 3. CST-Lesion Load vs. Lesion Size.

Shown here are examples of three patients’ motor impairment scores, lesion sizes, and lesion load volumes, as well as their individual lesion maps (depicted in blue) overlaid onto the probabilistic fiber map (depicted in red). Overlap between lesion and CST is displayed in purple. The axial slices depicted correspond to z=0, 4, 8, 10, 20, and 28 in Talairach space.25 Comparison of patients A and B shows how two similarly-sized lesions can produce markedly different CST-lesion loads and, accordingly, result in very different levels of motor impairment. Similarly, comparison of patients A and C shows how two patients can display comparable CST-lesion loads and functional ability despite drastically different overall lesion volumes.
The highly significant linear correlation demonstrated between raw CST-lesion load and UE-FM score is in accordance with previous studies that have quantitatively examined the relationship between CST involvement within the ischemic lesion and motor outcome.30,33,34 One such study analyzed infarct size with respect to CST involvement by overlaying a hand-drawn mask of descending motor tracts onto T2-weighted MR images.34 The greatest proportional intersection of lesion with this mask on any single slice was found to be more highly correlated with motor impairment than lesion size; however, this maximum ratio of lesion to mask cross-sectional area was not found to be a significantly superior predictor of motor impairment as compared to infarct size, which the authors attributed to their rather small patient sample (n=18). Two studies that employed variations of this approach resulted in comparable findings. In the first study,33 the slices of greatest proportional overlap were determined by overlaying lesion maps of three patients with motor tracts derived from DT images of healthy subjects; disconnections of the tracts were associated with differing hand-grip responses displayed by the patients. In another study,30 lesion maps of eighteen patients with mild to moderate impairments of the lower limb were overlaid onto a probabilistic fiber map derived from DT images of eight healthy, non-age-matched control subjects. Although gait parameters showed trends for correlation with both maximal cross-sectional overlap as well as total lesion overlap, in contrast to our study, none of the correlations reached statistical significance. Our study complements these investigations by overlaying lesion maps from a large sample of stroke patients onto a probabilistic, non-isocontour CST map derived from age-matched controls.
Our approach further expounds on the relationship between CST–lesion overlap by accounting for the narrowing of the CST as it descends from the precentral gyrus. We applied slice-wise weighting factors to our probabilistic fiber map similar to those utilized in the previously-employed proportional grid system3 and, as such, were able to more realistically model the anatomical topography of the CST. Consequently, the weighted CST-lesion load, which quantifies motor impairment in terms of tract geometry, was shown to be an even better predictor of motor impairment than the raw overlap variable.
Future longitudinal studies may wish to use CST-lesion load measured in the acute phase to examine the relationship between CST involvement and subsequent motor impairment. One study showed integrity of the CST—as classified using acute-phase DTI scans—to predict motor outcome at 6 months in patients with pontine infarcts9; whether or not a similar causal relationship exists between acute/sub-acute lesion–tract overlap in hemispheric strokes and motor outcome in the chronic phase has not yet been determined.
Our study is not without its limitations: we have generated our probabilistic CST map using fibers that were tracked using a modified streamline algorithm. While this single-fiber method has been shown to be able to traverse regions of oblate tensors and, thus, reconstruct some crossing fibers, future studies may wish to use other tractography methods that might be better-suited for fiber reconstruction in regions of complex crossings (e.g. multi-tensor or q-ball analysis). Multi-fiber probabilistic models may be particularly useful for researchers examining motor functions represented more laterally on the cortex or behaviors served by non-dominant fiber pathways.35 Finally, by including the entire precentral gyrus as a cortical ROI, we have inevitably also tracked corticospinal fibers originating from the premotor cortex. Nevertheless, our approach, which is consistent with methods used in previous DTI studies,10,36–38 is reliable and easily reproduced since the precentral gyrus can be easily identified. In contrast, no clear macro-anatomical landmarks indicate the border between the primary motor and premotor cortices.
In conclusion, we have shown CST-lesion load—a new variable that combines lesion size and CST involvement into a single quantitative measure—to be a statistically significant predictor of motor impairment in chronic stroke patients. The value of this new variable can be enhanced by using weighting factors to account for the narrowing of the CST as it descends from the precentral gyrus. The superiority of CST-lesion load as a predictor of motor deficit reinforces the notion that infarct localization and fiber tract integrity play critical roles in functional impairment. Our method, which complements established lesion-mapping and DTI techniques, could be automated in the future to assist clinicians and researchers in making accurate prognoses of motor impairment after stroke
Acknowledgments
Acknowledgments and Funding
This work was supported by the National Institutes of Health [NS045049 to G.S.]. The authors express their gratitude to Drs. Dinesh Nair and Vijay Renga for their assistance with data acquisition, and Dr. Pierre Fillard for several insightful discussions regarding the fiber tracking method used in this study. The authors have no conflicts of interest related to this manuscript, including employment, consultancies, honoraria, ownership or options, expert testimony, grants or patents receiving or pending, or royalties.
References
- 1.Mohr JP, Foulkes MA, Polis AT, et al. Infarct topography and hemiparesis profiles with cerebral convexity infarction: the Stroke Data Bank. J Neurol Neurosurg Psychiatry. 1993;56:344–351. doi: 10.1136/jnnp.56.4.344. [DOI] [PMC free article] [PubMed] [Google Scholar]
- 2.Saver JL, Johnston KC, Homer D, et al. Infarct volumeas a surrogate or auxiliary outcome measure in ischemic stroke clinical trials. The RANTTAS Investigators. Stroke. 1999;30:293–298. doi: 10.1161/01.str.30.2.293. [DOI] [PubMed] [Google Scholar]
- 3.Binkofski F, Seitz RJ, Arnold S, et al. Thalamic metbolism and corticospinal tract integrity determine motor recovery in stroke. Ann Neurol. 1996;39:460–470. doi: 10.1002/ana.410390408. [DOI] [PubMed] [Google Scholar]
- 4.Crafton KR, Mark AN, Cramer SC. Improved understanding of cortical injury by incorporating measures of functional anatomy. Brain. 2003;126:1650–1659. doi: 10.1093/brain/awg159. [DOI] [PubMed] [Google Scholar]
- 5.Schiemanck SK, Kwakkel G, Post MW, et al. Impact of internal capsule lesions on outcome of motor hand function at one year post-stroke. J Rehabil Med. 2008;40:96–101. doi: 10.2340/16501977-0130. [DOI] [PubMed] [Google Scholar]
- 6.Shelton FN, Reding MJ. Effect of lesion location on upper limb motor recovery after stroke. Stroke. 2001;32:107–112. doi: 10.1161/01.str.32.1.107. [DOI] [PubMed] [Google Scholar]
- 7.Ciccarelli O, Catani M, Johansen-Berg H, et al. Diffusion-based tractography in neurological disorders: concepts, applications, and future developments. Lancet Neurol. 2008;7:715–727. doi: 10.1016/S1474-4422(08)70163-7. [DOI] [PubMed] [Google Scholar]
- 8.Cho SH, Kim DG, Kim DS, et al. Motor outcome according to the integrity of the corticospinal tract determined by diffusion tensor tractography in the early stage of corona radiata infarct. Neurosci Lett. 2007;426:123–127. doi: 10.1016/j.neulet.2007.08.049. [DOI] [PubMed] [Google Scholar]
- 9.Jang SH, Bai D, Son SM, et al. Motor outcome prediction using diffusion tensor tractography in pontine infarct. Ann Neurol. 2008;64:460–465. doi: 10.1002/ana.21444. [DOI] [PubMed] [Google Scholar]
- 10.Konishi J, Yamada K, Kizu O, et al. MR tractography for the evaluation of functional recovery from lenticulostriate infarcts. Neurology. 2005;64:108–113. doi: 10.1212/01.WNL.0000148477.65273.0C. [DOI] [PubMed] [Google Scholar]
- 11.Lee JS, Han MK, Kim SH, et al. Fiber tracking by diffusion tensor imaging in corticospinal tract stroke: Topographical correlation with clinical symptoms. NeuroImage. 2005;26:771–776. doi: 10.1016/j.neuroimage.2005.02.036. [DOI] [PubMed] [Google Scholar]
- 12.Bates E, Wilson SM, Saygin AP, et al. Voxel-based lesion-symptom mapping. Nature Neuroscience. 2003;6:448. doi: 10.1038/nn1050. [DOI] [PubMed] [Google Scholar]
- 13.Karnath HO, Fruhmann Berger M, Kuker W, Rorden C. The anatomy of spatial neglect based on voxelwise statistical analysis: a study of 140 patients. Cereb Cortex. 2004;14:1164–1172. doi: 10.1093/cercor/bhh076. [DOI] [PubMed] [Google Scholar]
- 14.Rorden C, Fridriksson J, Karnath H-O. An evaluation of traditional and novel tools for lesion behavior mapping. NeuroImage. 2009;44:1355–1362. doi: 10.1016/j.neuroimage.2008.09.031. [DOI] [PMC free article] [PubMed] [Google Scholar]
- 15.Fugl-Meyer AR, Jaasko L, Leyman I, et al. The post-stroke hemiplegic patient. 1. a method for evaluation of physical performance. Scand J Rehabil Med. 1975;7:13–31. [PubMed] [Google Scholar]
- 16.van Wijck FM, Pandyan AD, Johnson GR, Barnes MP. Assessing motor deficitsin neurological rehabilitation: patterns of instrument usage. Neurorehabil Neural Repair. 2001;15:23–30. doi: 10.1177/154596830101500104. [DOI] [PubMed] [Google Scholar]
- 17.Brett M, Leff AP, Rorden C, Ashburner J. Spatial normalization of brain images with focal lesions using cost function masking. NeuroImage. 2001;14:486–500. doi: 10.1006/nimg.2001.0845. [DOI] [PubMed] [Google Scholar]
- 18.Rorden C, Brett M. Stereotaxic display of brain lesions. Behav Neurol. 2000;12:191–200. doi: 10.1155/2000/421719. [DOI] [PubMed] [Google Scholar]
- 19.Toussaint N, Souplet JC, Fillard P. MedINRIA: Medical Image Navigation and Research Tool by INRIA. MICCAI ’07 Workshop on Interaction in medical image analysis and visualization; Brisbane, Australia. 2007. [Google Scholar]
- 20.Basser PJ, Mattiello J, LeBihan D. MR diffusion tensor spectroscopy and imaging. Biophys J. 1994;66:259–267. doi: 10.1016/S0006-3495(94)80775-1. [DOI] [PMC free article] [PubMed] [Google Scholar]
- 21.Fillard P, Pennec X, Arsigny V, Ayache N. Clinical DT-MRI estimation, smoothing, and fiber tracking with log-Euclidean metrics. IEEE Trans Med Imaging. 2007;26:1472–1482. doi: 10.1109/TMI.2007.899173. [DOI] [PubMed] [Google Scholar]
- 22.Arsigny V, Fillard P, Pennec X, Ayache N. Log-Euclidean metrics for fast and simple calculus on diffusion tensors. Magn Reson Med. 2006;56:411–421. doi: 10.1002/mrm.20965. [DOI] [PubMed] [Google Scholar]
- 23.Weinstein DM, Kindlmann GL, Lundberg EC. Tensorlines: advection-diffusion based propagation through diffusion tensor fields. 10th IEEE Visualization Conference; Washington D.C: IEEE Computer Society; 1999. pp. 249–254. [Google Scholar]
- 24.Schaechter JD, Perdue KL, Wang R. Structural damage to the corticospinal tract correlates with bilateral sensorimotor cortex reorganization in stroke patients. NeuroImage. 2008;39:1370–1382. doi: 10.1016/j.neuroimage.2007.09.071. [DOI] [PMC free article] [PubMed] [Google Scholar]
- 25.Talariach J, Tournoux P. Co-planar stereotaxic atlas of the human brain. New York: Thieme Medical Publishers; 1988. [Google Scholar]
- 26.Nieuwenhuys R, Voogd J, Huijzen CV. The human central nervous system. 4. Berlin: Springer; 2008. [Google Scholar]
- 27.Wakana S, Jiang H, Nagae-Poetscher LM, et al. Fiber tract-based atlas of human white matter anatomy. Radiology. 2004;230:77–87. doi: 10.1148/radiol.2301021640. [DOI] [PubMed] [Google Scholar]
- 28.Lindberg PG, Skejo PHB, Rounis E, et al. Wallerian degeneration of the corticofugal tracts in chronic stroke: a pilot study relating diffusion tensor imaging, transcranial magnetic stimulation, and hand function. Neurorehabil Neural Repair. 2007;21:551–560. doi: 10.1177/1545968307301886. [DOI] [PubMed] [Google Scholar]
- 29.Werring DJ, Toosy AT, Clark CA, et al. Diffusion tensor imaging can detect and quantify corticospinal tract degeneration after stroke. Journal of Neurology, Neurosurgery & Psychiatry. 2000;69:269–272. doi: 10.1136/jnnp.69.2.269. [DOI] [PMC free article] [PubMed] [Google Scholar]
- 30.Dawes H, Enzinger C, Johansen-Berg H, et al. Walking performance and its recovery in chronic stroke in relation to extent of lesion overlap with the descending motor tract. Exp Brain Res. 2008;186:325–333. doi: 10.1007/s00221-007-1237-0. [DOI] [PubMed] [Google Scholar]
- 31.Karnath HO, Rorden C, Ticini LF. Damage to white matter fiber tracts in acute spatial neglect. Cereb Cortex. 2009;19:2331–2337. doi: 10.1093/cercor/bhn250. [DOI] [PMC free article] [PubMed] [Google Scholar]
- 32.Mark VW, Taub E, Perkins C, et al. MRI infarction load and CI therapy outcomes for chronic post-stroke hemiparesis. Restor Neurol Neurosci. 2008;26:13–33. [PubMed] [Google Scholar]
- 33.Newton JM, Ward NS, Parker GJ, et al. Non-invasive mapping of corticofugal fibres from multiple motor areas--relevance to stroke recovery. Brain. 2006;129:1844–1858. doi: 10.1093/brain/awl106. [DOI] [PMC free article] [PubMed] [Google Scholar]
- 34.Pineiro R, Pendlebury ST, Smith S, et al. Relating MRI changes to motor deficit after ischemic stroke by segmentation of functional motor pathways. Stroke. 2000;31:672–679. doi: 10.1161/01.str.31.3.672. [DOI] [PubMed] [Google Scholar]
- 35.Behrens TE, Berg HJ, Jbabdi S, et al. Probabilistic diffusion tractography with multiple fibre orientations: What can we gain? NeuroImage. 2007;34:144–155. doi: 10.1016/j.neuroimage.2006.09.018. [DOI] [PMC free article] [PubMed] [Google Scholar]
- 36.Kunimatsu A, Aoki S, Masutani Y, et al. Three-dimensional white matter tractography by diffusion tensor imaging in ischaemic stroke involving the corticospinal tract. Neuroradiology. 2003;45:532–535. doi: 10.1007/s00234-003-0974-4. [DOI] [PubMed] [Google Scholar]
- 37.Lehericy S, Ducros M, Krainik A, et al. 3-D diffusion tensor axonal tracking shows distinct SMA and pre-SMA projections to the human striatum. Cereb Cortex. 2004;14:1302–1309. doi: 10.1093/cercor/bhh091. [DOI] [PubMed] [Google Scholar]
- 38.Thomas B, Eyssen M, Peeters R, et al. Quantitative diffusion tensor imaging in cerebral palsy due to periventricular white matter injury. Brain. 2005;128:2562–2577. doi: 10.1093/brain/awh600. [DOI] [PubMed] [Google Scholar]