Abstract
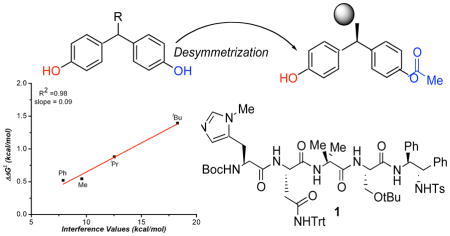
Linear free energy relationships have been found for enantioselectivity and various steric parameters in an enantioselective desymmetrization of symmetrical (bis)phenol substrates. The potential origin of this observation and the role of different steric parameters are discussed.
The analysis of enantioselectivity in catalytic reactions is a highly challenging endeavor due to the small differences in absolute energies of competing transition states that lead to useful levels of selectivity. In the case of enantioselective reactions, a mere 2.7 kcal/mol of partitioning between competing transition states can lead to the gold standard of success in the field, >98% ee. As a result, catalyst design from first principles remains a daunting task, leading to a substantial reliance on empiricism.1 Moreover, after-the-fact analysis of the basis of observed selectivities remains highly challenging in and of itself. As a result, tools that assist in quantitative analysis of reaction outcomes are of great value. In fact, correlation techniques, perhaps best exemplified by the venerable Hammett analysis,2 are now entrenched methods that ground organic chemistry as a quantitative science.3 The development of quantitative tools for the analysis of catalytic enantioselective reactions has evolved more slowly than for other types of reaction analysis. In part, this may be due to the often mechanistically complicated reaction coordinates that characterize catalytic enantioselective reactions. In any case, Sigman et al. recently demonstrated a series of quantitative studies of enantioselective processes employing linear free energy analysis.4 This analysis is aimed at both gaining further insight into the origin of steric effects but also to help develop predictive power in the design of new catalysts.
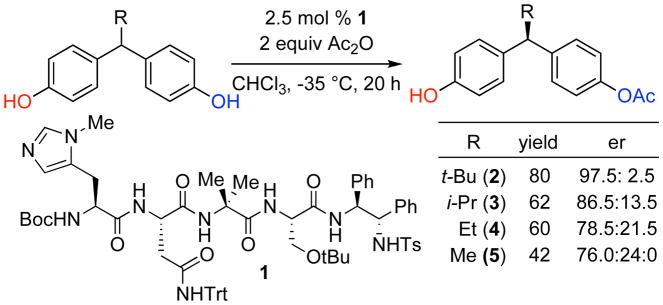
Recently, Lewis et al. demonstrated that peptide catalyst 1 is able to efficiently catalyze the desymmetrization of symmetrical (bis)phenol 2 (Scheme 1), which bears a bulky t-Bu group at the prostereogenic center (80% yield, 97.5:2.5 er).5 Given the unusual nature of this reaction, and the curious role of the remote prostereogenic center, we sought to study this reaction further. Indeed, we set out to probe the role of steric bulk at the key position through the synthesis of a series of (bis)phenols with a varying degree of steric bulk at the prostereogenic center.6 Whereas the t-Bu-bearing compound 2 was converted to the monoacetate with 97.5:2.5 er, the i-Pr-bearing compound 3 was converted to its mono acetate with 86.5:13.5 er. The Et-substituted compound 4 delivered its derived product with 78.5:21.5 er, and finally the Me-bearing compound 5 gave the product with a lower, but perhaps still remarkable 76.0:24.0 er. In fact, we were quite surprised by the seemingly well-behaved trend for this remote steric effect, and we wished to understand it in a quantitative way. For this goal, we turned to the linear free energy analysis of catalytic enantioselective reactions of Sigman,7 and the striking results are presented herein.
Scheme 1.
Empirical effect of sterics on the enantioselective desymmetrization of (bis)phenols.
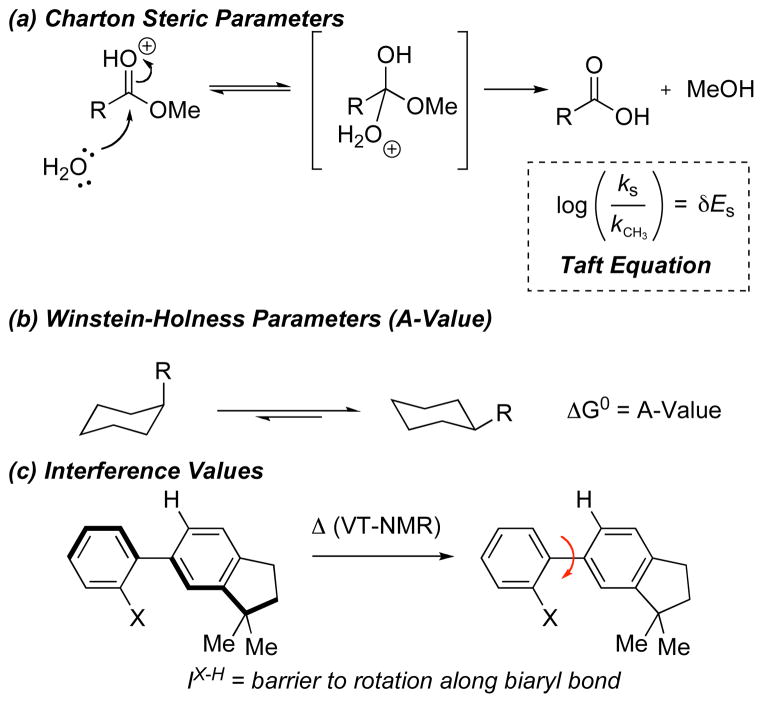
One of the challenges associated with this study was the identification of appropriate reference parameters for the linear free energy relationship analysis. As shown in Figure 1, one might imagine exploitation of Charton values (Figure 1a), Winstein-Holness values (“A-values,” Figure 1b), or Interference values (Figure 1c), inter alia, to the analysis. Charton values (υ),8 which are based on the Taft steric paramaters (Figure 1a)9 with modifications to take inductive and resonance factors into account, are perhaps the most studied and well-developed steric parameter.10 With this in mind we wished to expand upon the initial set of bis(phenols) to include a diverse array of substrates containing substituents for which reported υ values were available.
Figure 1.
Origin of common steric parameters.
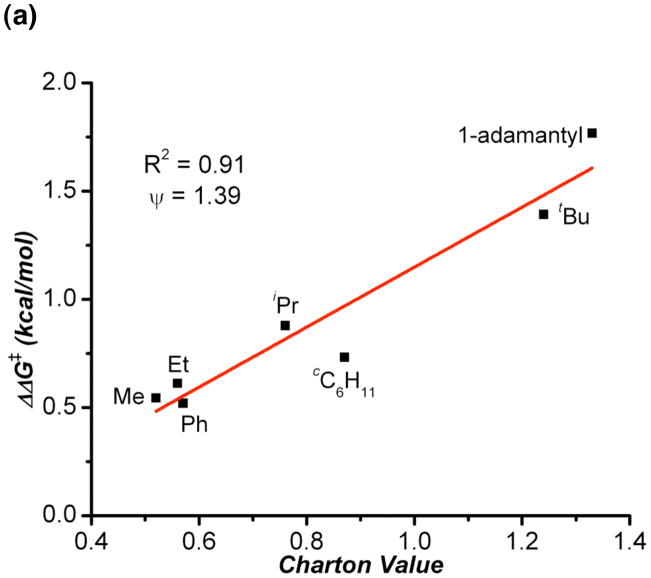
As shown in Table 1, we found that the substrates in which the steric bulk was located at the carbon α to the prostereogenic center (entries 1–7) exhibited a strong correlation between enantioselectivity (plotted as ΔΔG‡ which is dervied from enantiomeric ratio) and υ (Figure 2). The large slope (ψ) for this plot (ψ = 1.39) indicates a strong sensitivity to changes in sterics at the prostereogenic center. This may suggest that the substitution at the α carbon leads to a propeller-like twist between the aryl rings of 2, where decreased steric bulk causes a less rigid system with a lower barrier to interconversion between the two possible propeller twists. This in turn could make diastereotopic recognition by the catalyst more difficult. Another possible explanation is that since peptide 1 was optimized specifically for (bis)phenol 2 through several directed libraries, the alkyl group steric bulk at that position might be needed for some sort of substrate-catalyst interaction.
Table 1.
Evaluation of various (bis)phenols with catalyst 1 and corresponding common steric parameters.
 | ||||||
|---|---|---|---|---|---|---|
| entry | R | % yielda | er(R/S)b | Charton value (ν)c | A-value (kcal/mol)d | IX-H(kcal/mol)e |
| 1 | tBu | 80 | 97.5:2.5 | 1.24 | 4.5 | 18.29 |
| 2 | iPr | 62 | 86.5:13.5 | 0.76 | 2.21 | 12.56 |
| 3 | Et | 60 | 78.5:21.5 | 0.56 | 1.79 | --- |
| 4 | Me | 42 | 76.0:24.0 | 0.52 | 1.74 | 9.60 |
| 5 | Ph | 40 | 75.0:25.0 | 0.57 | 2.80, 2.20 | 7.90 |
| 6 | cC6H11 | 55 | 82.5:17.5 | 0.87 | 2.20 | --- |
| 7 | 1-adamantyl | 55 | 98.5:1.5 | 1.33 | --- | --- |
| 8 | CHEt2 | 80 | 91.0:9.0 | 1.28 | --- | --- |
| 9 | CH2tBu | 45 | 77.5:22.5 | 1.34 | 2.00 | --- |
| 10 | CH2iPr | 53 | 67.5:32.5 | 0.98 | --- | --- |
| 11 | CH2Ph | 46 | 71.5:28.5 | 0.70 | 1.68 | --- |
| 12 | CHPh2 | 49 | 85.0:15.0 | 1.25 | --- | --- |
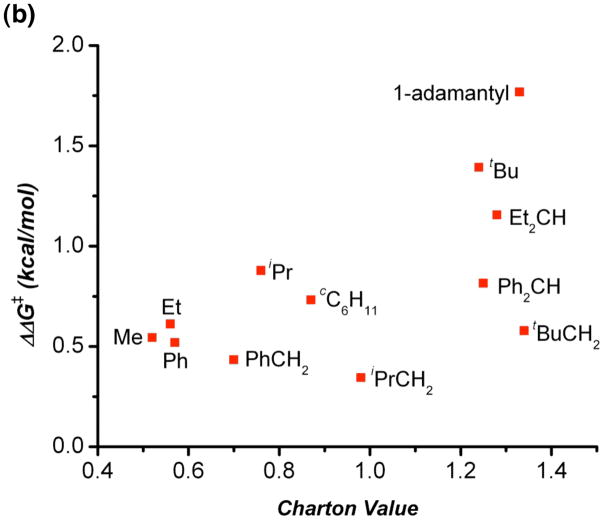
Figure 2.
(a): Charton plot of selected substituents with bulk α to the prostereogenic center. (b): Charton plot of all substituents evalulated.
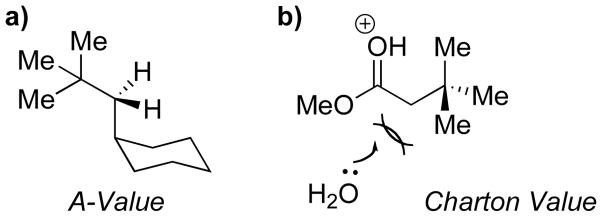
Interestingly, this correlation seems to break down for substrates in which the steric bulk is further removed from the prostereogenic center (Figure 2). This may be related to entropic effects, associated with the ability of the bonds in the substrate to rotate in such a way as to minimize steric contacts between the alkyl substitution and the phenol rings, causing the bulky substituent to behave more like a smaller ethyl group than a t-Bu group, similar to what is seen in cyclohexanes (Figure 3a). In the context of hydrolysis of an ester, steric bulk at the β position will still significantly hinder the π* orbital (Figure 3b) of the carbonyl resulting in a large υ. Thus for these substitutions, Charton values may indicate a steric effect greater than what may actually be present.
Figure 3.
Comparison of A-values and Charton values for R = CH2tBu.
With that in mind, we decided to investigate whether other steric parameters may provide a more appropriate correlation. Winstein-Holness values (A-values)11 may well be the most commonly quoted steric paramater. They are derived from the energy difference between the equatorial and axial conformers of mono-substitued cyclohexanes.12 A-values are commonly used as a teaching tool to first introduce conformational analysis and the concept of steric bulk (Figure 1b). We thus wondered if A-values might be better suited to our system due to the sensitivity of A-values to gauche-type torsional strain (Figure 4a). For example the A-values of t-Bu and CH2t-Bu are 4.5 kcal/mol, and 2.0 kcal/mol, compared to Charton values where υ = 1.24, and 1.34 respectively.
Figure 4.
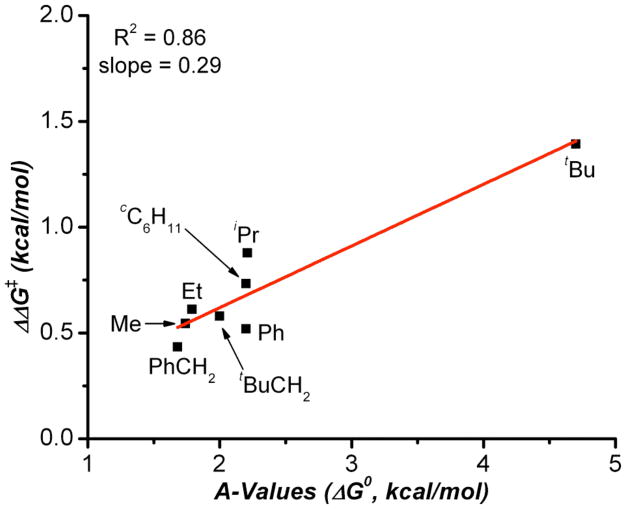
Plot of ΔΔG‡ derived from enantiomeric ratio versus the corresponding A-value.
Indeed, a strong correlation between ΔΔG‡ and A-values was observed (Figure 4). Unfortunately, to our knowledge, the breadth of A-values available in the literature is not near that of Charton values, making it difficult to make a complete comparison. For example, in Figure 4, if one were to exclude the tert-butyl group, the quality of the correlation would suffer. Yet, the inclusion of R-groups such as adamantyl would likely improve the correlation, were the additional and appropriate parameters available. Nonetheless the correlation between ΔΔG‡ and A-values is encouraging and we believe, based on analysis of hand held models, this trend would hold for the substrates in which there are no reported A-values.
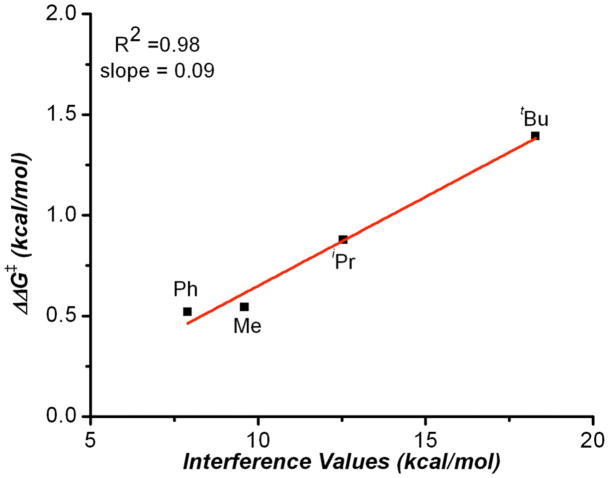
Since the early part of the 20th century chemists have been qualitatively describing steric bulk from data derived by observing the t1/2 of racemization of ortho, ortho’ substituted biaryls.13 Since the bis(phenol) structure 1 bears both aryl moieties, as well as substituents residing on an sp3-carbon center, we wondered if interference values might also provide an insightful correlation parameter. This question was facilitated by the explicit studies of Sternhell and coworkers, who applied modern NMR techniques, and a well-designed molecular system (Figure 1c) to quantify these trends in the form of interference values (IX-H).14 Though interference values are very limited in number in the literature, we made a preliminary plot which demonstrates an excellent correlation between enantioselectivity and IX-H (Figure 5).
Figure 5.
Plot of ΔΔG‡ derived from enantiomeric ratio versus the corresponding interference values.
In summary, we have successfully constructed linear free energy relationships for a unique enantioselective desymmetrization of bis(phenol) substrates containing a remote stereocenter. To accomplish this, three distinct steric parameters including Charton values, A-Values, and interference values were correlated to the enantiomeric ratio of the desymmetrization reaction. While precise catalyst/substrate information must be interpretted carefully, an important conclusion is that one must understand the origin of the parameter being investigated. Specifically, we found success using Charton values for substrates with the steric bulk directly adjacent to the chiral center; however, when the steric bulk was distal to the chiral center, a poor correlation resulted. In contrast, better correlations with A-values and interference values were found although only a limited set of values is currently available. This work clearly illustrates the usefulness of steric parameters in asymmetric catalyst analysis but also highlights the caution one must use in evaluating steric effects as well as the need to develop new or more complete sets of steric parameters.
Supplementary Material
Acknowledgments
M.S.S. thanks the National Science Foundation (CHE-0749506) for support. S.J.M. is grateful to National Institutes of Health Foundation (GM-068649) for financial support. We are grateful to Dr. Chad Lewis and Merck Research Laboratories for their support in the initial phases of this work, noted in refereces 5 and 6.
Footnotes
Supporting Information Available: Experimental procedures and full spectroscopic data for all new compounds. This material is available free of charge via the internet at http://pubs.acs.org.
References
- 1.(a) Jandeleit B, Schaefer DJ, Powers TS, Turner HW, Weinberg WH. Angew Chem Int Ed. 1999;38:2494–2532. [PubMed] [Google Scholar]; (b) Reetz MT. Angew Chem Int Ed. 2001;40:284–310. [PubMed] [Google Scholar]; (c) Crabtree RH. Chem Comm. 1999;17:1611–1616. [Google Scholar]; (d) Kuntz KW, Snapper ML, Hoveyda AH. Curr Opin Chem Biol. 1999;3:313–319. doi: 10.1016/S1367-5931(99)80048-9. [DOI] [PubMed] [Google Scholar]; (e) Francis MB, Jamison TF, Jacobsen EN. Curr Opin Chem Biol. 1999;2:422–428. doi: 10.1016/s1367-5931(98)80019-7. [DOI] [PubMed] [Google Scholar]
- 2.(a) Hammett LP. Chem Rev. 1935;17:125–136. [Google Scholar]; (b) Anslyn EV, Dougherty DA. Modern Physical Organic Chemistry. University Science Books; Mill Valley, CA: 2006. [Google Scholar]; (c) Hansch C, Leo A, Taft RW. Chem Rev. 1991;91:165–195. [Google Scholar]
- 3.(a) Anders E, Ruch E, Ugi I. Angew Chem Int Ed. 1973;12:2–529. [Google Scholar]; (b) Inoue Y, Wada T, Asaoka S, Sato H, Pete JP. Chem Commun. 2000:251–259. [Google Scholar]; (c) Rekharsky MV, Inoue Y. Chem Rev. 1998;98:1875–1917. doi: 10.1021/cr970015o. [DOI] [PubMed] [Google Scholar]; (d) Buschmann H, Scharf H-D, Hoffman N, Esser P. Angew Chem Int Ed. 1991;30:477–515. [Google Scholar]; (e) Buschman H, Hoffman N, Scharf HD. Tetrahedron: Asymmetry. 1991;2:1429–1444. [Google Scholar]; (f) Cainelli G, Galletti P, Giacommi D. Chem Soc Rev. 2009;38:990–1001. doi: 10.1039/b802815j. [DOI] [PubMed] [Google Scholar]
- 4.Miller JJ, Sigman MS. Angew Chem Int Ed. 2008;47:771–774. doi: 10.1002/anie.200704257. [DOI] [PubMed] [Google Scholar]
- 5.Lewis CA, Chiu A, Kubryk M, Balsells J, Pollard D, Esser CK, Murry J, Reamer RA, Hansen KB, Miller SJ. J Am Chem Soc. 2006;128:16454–16455. doi: 10.1021/ja067840j. [DOI] [PubMed] [Google Scholar]
- 6.Lewis CA, Gustafson JL, Chiu A, Balsells J, Pollard D, Murry J, Reamer RA, Hansen KB, Miller SJ. J Am Chem Soc. 2008;130:16358–16365. doi: 10.1021/ja807120z. [DOI] [PMC free article] [PubMed] [Google Scholar]
- 7.(a) Reference 1. Sigman MS, Miller JJ. J Org Chem. 2009;74:7633–7643. doi: 10.1021/jo901698t.
- 8.(a) Charton M. J Am Chem Soc. 1969;91:615–618. [Google Scholar]; (b) Charton M. J Am Chem Soc. 1975;97:3691–3693. [Google Scholar]; (c) Charton M. J Am Chem Soc. 1975;97:1552–1556. [Google Scholar]; (d) Charton M. J Org Chem. 1976;41:2217–2220. [Google Scholar]
- 9.(a) Taft RW., Jr J Am Chem Soc. 1952;74:2729–2732. [Google Scholar]; (b) Taft RW., Jr J Am Chem Soc. 1953;75:4538–4539. [Google Scholar]
- 10.Forster H, Vogtle F. Angew Chem Int Ed. 1977;16:429–441. [Google Scholar]
- 11.(a) Eliel EL, Wilen SH, Mander LN, editors. Stereochemistry of Organic Compounds. Wiley; New York: 1994. [Google Scholar]; (b) Hirsch JA. Topics in Stereochemistry. 1967;1:199–217. [Google Scholar]
- 12.(a) Winstein S, Holness NJ. J Am Chem Soc. 1955;77:5562–5578. [Google Scholar]; (b) Eliel EL. Angew Chem Int Ed. 1965;4:761–774. [Google Scholar]
- 13.(a) Adams R, Yuan HC. Chem Rev. 1933;12:261–338. [Google Scholar]; (b) Stoughton RW, Adams R. J Am Chem Soc. 1932;54:4426–4434. [Google Scholar]
- 14.Bott G, Field LD, Sternhell S. J Am Chem Soc. 1980;102:5618–5626. [Google Scholar]
Associated Data
This section collects any data citations, data availability statements, or supplementary materials included in this article.


