Abstract
Chemically modified carbon nanotubes with hydrophilic functionalities such as polyethylene glycols (PEGs) are widely pursued for potential biological and biomedical applications. In this study, PEGylated single-walled carbon nanotubes (PEG-SWNT) were intravenously administrated into mice to study their bio-defunctionalization in vivo by using complementary Raman and photoluminescence measurements. There was meaningful defunctionalization of PEG-SWNT in liver over time, but not in spleen under similar conditions. The evidence from spectroscopic characterization and analyses is presented, and mechanistic implications are discussed.
Introduction
Chemical modification and functionalization of single-walled carbon nanotubes (SWNTs) are generally considered as necessary for many of their widely pursued potential biomedical applications.1-3 For example, the functionalization of SWNTs helped to improve their pharmacokinetics and reduce toxicity.4,5 In particular, PEGylation (the functionalization with polyethylene glycol) was found to be most effective and promising, resulting in long blood circulation times in vivo and other desirable characteristics for the PEGylated SWNTs (PEG-SWNT).6-9
There has been much discussion on the potential health effects of carbon nanotubes.10-12 Biodistributions of both pristine and functionalized SWNTs in vivo, including their changes over time, have also been determined and reported.6,7,13-15 However, results are still scarce on the biological consequence of and/or effects on the functionalized carbon nanotubes, specifically their bio-defunctionalization or even any decomposition in vivo. One difficulty in this regard has been a lack of suitable sensitive analytical techniques.
In this work, we intravenously administrated PEG-SWNT into mice to study their bio-defunctionalization in vivo by using complementary Raman and photoluminescence measurements. There was apparently defunctionalization of PEG-SWNT in liver over time, but not in spleen under similar conditions. The evidence from spectroscopic characterization and analyses is presented, and mechanistic implications are discussed.
Experimental Section
Materials
The SWNT sample from the arc-discharge production method was supplied by Carbon Solutions, Inc. The as-received sample was purified by a combination of thermal oxidation and oxidative acid treatments, as reported previously.16 Briefly, the sample (1 g) was heated in a furnace to 300 °C in air for 30 min and then refluxed in diluted nitric acid (2.6 M, 500 mL) for 24 h. The solid was collected via centrifugation, washed repeatedly with deionized water until neutral pH, and then dried in a vacuum oven to obtain the purified sample (330 mg). The bis(3-aminopropyl)-terminated poly(ethylene glycol) of molecular weight ∼ 1,500 (PEG1500N) was purchased from Aldrich.
The PEG-SWNT sample was prepared as previously reported.17 Briefly, the purified SWNTs (20 mg) were refluxed in thionyl chloride (5 mL) for 12 h, followed by a complete removal of unreacted thionyl chloride on a rotary evaporator with a vacuum pump. To the treated nanotube sample was added PEG1500N, and the mixture was heated to 120 °C and stirred under nitrogen protection for 3 days. The reaction mixture was cooled to room temperature and then extracted repeatedly with water to obtain PEG-SWNT. The nanotube content in the sample was around 15% by weight according to thermogravimetric analysis (TGA), with a typical nanotube length on the order of 300 nm to 1 μm or so. For animal exposure experiments, the PEG-SWNT sample was dissolved in 0.9% NaCl aqueous solution.
Measurements
TGA was performed on a TA Instruments Q-500 TGA machine. Raman spectra were measured on a Renishaw Raman spectrometer equipped with a 100 mW diode laser source for 785 nm excitation and a Jobin-Yvon T64000 spectrometer equipped with a Melles-Griot 35 mW He:Ne laser and an Olympus BX-41 microscope. Transmission electron microscopy (TEM) images were obtained on Hitachi HF-2000 TEM and Hitachi HD-2000 S-TEM/TEM systems.
For Raman measurements, the PEG-SWNT sample was chemically defunctionalized by being boiled in HNO3:H2O2 (1:1 in volume) mixture until the formation of black solids in the boiling solution. The solid residues were collected by centrifugation at 12,000 rpm for 10 min, and then re-dispersed in water via sonication. Both the original PEG-SWNT solution and the defunctionalized sample in aqueous suspension were dropped separately onto glass slides, followed by drying with the use of an infrared lamp. After drying, Raman spectra were recorded as described above.
For Raman specimens from the defunctionalization under conditions simulating those in liver, the PEG-SWNT solution (200 μg carbon-equivalent in 100 μL, where carbon-equivalent referring to the weight of nanotube carbons, excluding that of the PEG chains) was incubated in 1 mL of 5% H2O2 solution (0.1 M citrate buffer, pH 7.0) and separately in 1 mL of citrate buffer (0.1 M citrate buffer, pH 4.4), both at 37 °C for 1 week. The resulting suspensions were dropped onto glass slides, followed by drying with the use of an infrared lamp and subsequent acquisitions of Raman spectra.
The livers of two unexposed mice were collected and then homogenized in water to be used as sample background in Raman measurements. The liver homogenate (∼3 g) was divided into two: one mixed with PEG-SWNT (300 μg carbon-equivalent) and homogenized again; and the other mixed with the HNO3:H2O2 defunctionalized SWNTs (300 μg carbon-equivalent, in aqueous suspension with 1% Tween® 80) and also homogenized again. Both mixtures were measured on the Renishaw Raman spectrometer.
Experiments in Mice
All animal experiments were performed in compliance with the institutional Animal Care and Use Regulations and Guidelines on animal welfare. Male CD-ICR mice (∼25 g) were obtained from Peking University Animal Centre, Beijing, China. They were housed in plastic cages (3 mice per cage) and kept on a 12 h light/dark cycle. Food and water were provided ad libitum. Following acclimation, mice were randomly divided into groups (3 mice per group) for the experiments.
The mice were intravenously injected with 0.3 mL of the PEG-SWNT solution (600 μg carbon-equivalent) per mouse, and those injected with 0.3 mL of 0.9% NaCl solution were taken as the control. The mice were sacrificed at 1 day, 1 week, 4 weeks, and 8 weeks post-exposure. The livers and spleens of the exposed and control groups were collected and then homogenized in homogenizers as described above. The homogenates were placed on glass slides and dried under infrared lamp, with the full excitation laser power (100 mW) for the liver samples and reduced power (10 mW) for the spleen samples because of the intrinsically stronger fluorescence of the latter.
Results And Discussion
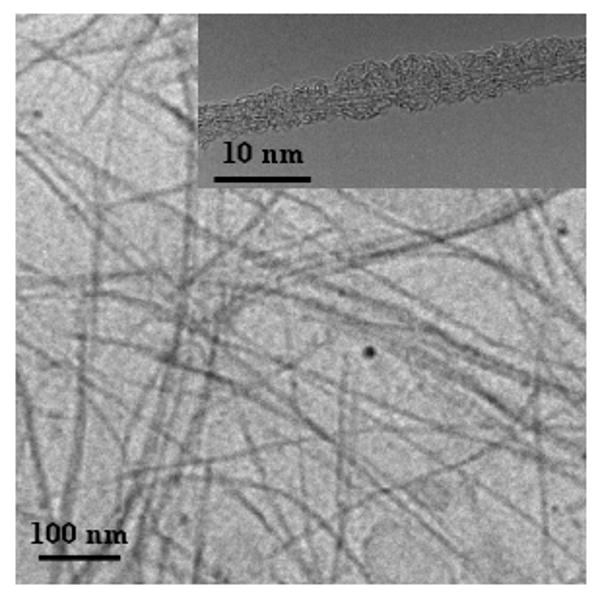
The PEGylated SWNTs were readily soluble in water to form dark-colored homogeneous solutions, and the resulting aqueous solutions (with or without 0.9% NaCl) were stable over an extended period of time (at least several months). The specimen for TEM analyses was prepared by placing a few drops of a dilute aqueous PEG-SWNT solution onto a holey carbon-coated copper grid, followed by drying via evaporation. According to the TEM images (Figure 1), the nanotubes in the PEG-SWNT sample were dispersed either individually or as thin bundles. In high-resolution TEM imaging for SWNTs lying across holes on the holey carbon grid, amorphous materials covering the nanotube surface could be observed (Figure 1), which might be assigned to the PEG1500N moieties.
Figure 1.

Representative TEM images of PEG-SWNT at lower and higher (inset) magnifications.
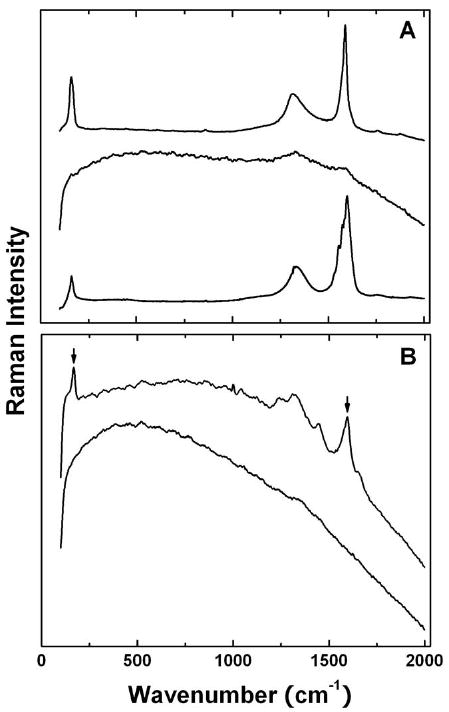
It is well known that pristine SWNTs, even after purification with the oxidative acid treatment, exhibit characteristic Raman features including the relatively intense G-band at around 1,590 cm-1 (Figure 2A).18 However, upon covalent functionalization targeting nanotube surface defect-derived carboxylic moieties, such as the PEGylation in this study, the Raman measurements could be subject to overwhelming interference of photoluminescence from the functionalized carbon nanotubes.19-21 The luminescence emission is generally brighter in better-functionalized and dispersed nanotubes due to the passivation of nanotube surface defects by the functionalization.22 In fact, resonance Raman and photoluminescence have been demonstrated as complementary characterization techniques in the evaluation on how well SWNTs are functionalized for their exfoliation into individual or thin bundles of nanotubes.22,23 Such a complementary relationship was reaffirmed in this study. As shown in Figure 2A, the Raman spectrum of PEG-SWNT is overwhelmed by the luminescence contributions, with the G-band signal barely visible, letting alone the much weaker radial breathing mode (RBM) peaks. Upon the chemical defunctionaliation in terms of the HNO3:H2O2 digestion to remove the PEG species from the nanotubes, the Raman features were recovered (Figure 2A). As reported previously,17 a similar elimination of luminescence interference to recover the intrinsic Raman spectrum of SWNTs could be achieved by thermally defunctionalizing the functionalized nanotube sample (via TGA, for example).
Figure 2.

(A) Raman spectra of pre-functionalization SWNTs (bottom), PEG-SWNT (middle), and the chemically defunctionalized sample (top); (B) Raman spectra of the liver homogenate with PEG-SWNT (bottom) and the chemically defunctionalized PEG-SWNT (top, with the RBM band and G-band marked).
Experiments with simulated biological background were performed to further investigate and demonstrate the complementary relationship between Raman and photoluminescence in PEG-SWNT and the chemically defunctionalized sample. These samples were mixed with the liver homogenate for Raman measurements. As shown in Figure 2B, the mixture with PEG-SWNT exhibited no visible Raman features, but on the other hand, the G-band at around 1,590 cm-1 was obvious in the spectrum of the mixture with the chemically defunctionalized sample. It should be noted that with the use of 785 nm laser excitation the auto-fluorescence from the tissue sample was manageable, hardly prohibiting the sensitive detection of Raman signals. There were also reports in the literature on the Raman tracking of SWNTs in vivo for both qualitative and quantitative purposes.7,24 The simulation experiments here and the results in the literature all suggested that Raman spectroscopy was suitable and adequate for the probing of bio-defunctionalization of PEG-SWNT in vivo.
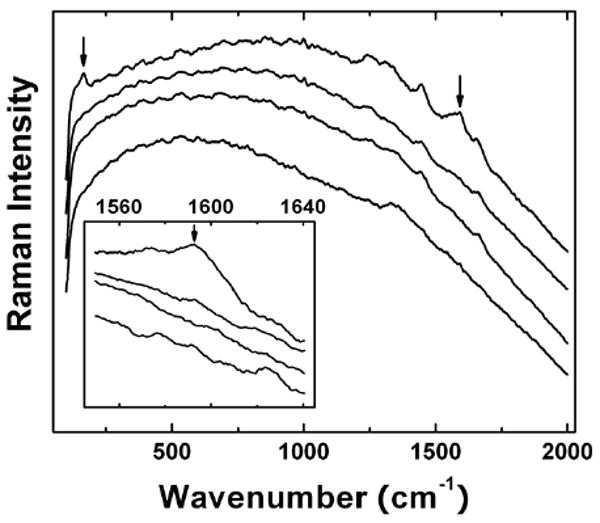
The in vivo experiment involved intravenous administration of the PEG-SWNT solution into mice. The mice were sacrificed at various time points up to 8 weeks post exposure, and the liver and spleen were collected and processed for Raman measurements. For liver samples, no obvious Raman G-band signals were detected in those harvested 1 and 7 days post-exposure (Figure 3). However, when PEGylated 13C-enriched-SWNTs were used in the same in vivo experiments, nanotubes could be detected 7 or more days post-intravenous administration by using the isotopic ratio mass spectrometry technique.6 Thus, the presence of SWNTs in liver but not detected by Raman suggested that the nanotubes remained well-functionalized.
Figure 3.

Raman spectra (the inset featuring the region around 1,600 cm-1) of the liver samples harvested from the PEG-SWNT-administrated mice (from bottom up: the control, 1 day, 1 week, and 4 weeks post-exposure).
For the liver sample harvested 4 weeks post-exposure, the Raman spectrum clearly exhibited the G-band peak at ∼1,590 cm-1 and also the RBM band at ∼165 cm-1 (Figure 3), with latter corresponding to the correct average diameter of arc-produced SWNTs. The re-emergence of the characteristic Raman features was likely due to bio-defunctionalization of the PEGylated SWNTs in liver during the relatively longer period of time post-intravenous administration, namely there were less functionalized or even “free” SWNTs in the liver sample harvested 4 weeks post-exposure. Since the PEG chain is generally stable against biotransformation,25 the defunctionalization must be at the amide linkages between the PEG functional groups and the nanotubes. Similar Raman features were observed in the liver sample harvested 8 weeks post-exposure. This is not a surprise because the presence of unfunctionalized SWNTs in liver at even longer time post-exposure is known in the literature.26 Nevertheless, the bio-defunctionalization of PEG-SWNT in vivo does not necessarily mean a complete removal of all functional groups, which is not required for the observation of the characteristic Raman peaks from SWNTs. Therefore, the hepatic bio-defunctionalization could result in less functionalized or partially PEGylated SWNTs, whose biological fate remains an issue for further investigation.
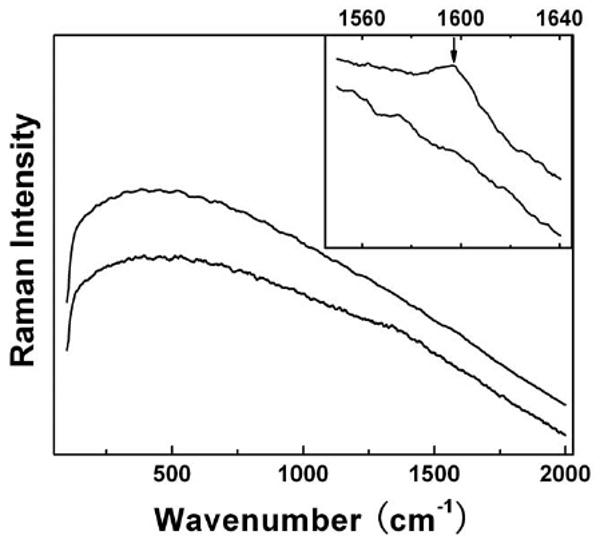
Interestingly, the bio-defunctionalization was absent for the PEGylated SWNTs in spleen. There were no characteristic nanotube peaks in the Raman spectra of all spleen samples harvested up to 8 weeks post-exposure (Figure 4). According to the same in vivo experiment with PEGylated 13C-enriched-SWNTs (coupled with the quantification by using the isotopic ratio mass spectrometry technique),6 there were SWNTs in the spleen at least 7 days post-exposure. These nanotubes likely remained well-functionalized to hinder the Raman detection. For the spleen sample harvested 8 weeks post-exposure, the photoirradiation at 785 nm could result in the re-emergence of the Raman G-band peak (Figure 4), due probably to some photo-generated thermal defunctionalization effect. Thus, there were indeed PEGylated SWNTs in the spleen over 8 weeks post-exposure that were not detected by Raman for the absence of any efficient bio-defunctionalization.
Figure 4.

Raman spectra of the spleen sample harvested from the PEG-SWNT-administrated mice 8 weeks post-exposure (top) vs the control (bottom). The inset features the G-band region for the same samples after photoirradiation.
The hepatic bio-defunctionalization of PEG-SWNT in vivo is probably enzymatic in origin, with combined effects of radical attack and acid hydrolysis.27 In simulation experiments, the PEG-SWNT was incubated separately in 5% H2O2 (pH 7.0) or citrate buffer (pH 4.4, the same as in lysosome) for 7 days, simulating the environment for radicals or acid hydrolysis, respectively. The results suggested that there was meaningful defunctionalization in each simulated environment, with the observation of characteristic nanotube peaks in the Raman spectra. Mechanistically, it is possible for PEG-SWNT to enter phagocytic cells via endocytosis, such as phagocytosis or pinocytosis,13,28 first trapped in lysosomes in the cells. Since a function of lysosomes is to allow enzymes to degrade exotic particulate materials,29 there might be radical initiated cleavage or acid hydrolysis reactions in such a cellular environment to be responsible for the observed bio-defunctionalization in liver.
The defunctionalization of the covalently PEGylated SWNTs in liver was apparently very slow, in reference to the previously reported in vivo defunctionalization of noncovalently functionalized nanotubes. For SWNTs functionalized via surfactant wrapping, as example, the surfactant such as Pluronic F108 absorbed on the nanotube surface could be replaced by serum proteins in rats within 30 min post-intravenous administration.30 In the study of Daphnia magna, the lipid coating on SWNTs could be detached and ingested as food source, with the naked nanotubes egested in 48 h.31 It seems that the mode of nanotube functionalization does make a significant difference in the biological fate of the resulting functionalized nanotube samples.
In summary, the complementary relationship between photoluminescence and Raman in functionalized SWNTs and their defunctionalization serves as an effective tool in the study of bio-defunctionalization of functionalized SWNTs in vivo. The covalently PEGylated SWNTs could be slowly defunctionalized in liver, but not in spleen, and the hepatic bio-defunctionalization might be enzymatic/radical in origin. The consequences (to the longer term toxicity of functionalized carbon nanotubes in vivo, for example) and/or potential utilities of such bio-defunctionalization are interesting topics for further investigations.
Supplementary Material
Acknowledgments
We acknowledge financial support from the China Natural Science Foundation (No. 20871010) and the China Ministry of Science and Technology (973 project No. 2006CB705604 and No. 2009CB930303) to the Peking U. group, and from the U.S. National Science Foundation, National Institutes of Health, and the South Carolina Space Grant Consortium to Y.-P.S.
Footnotes
Supporting Information Available. Additional relevant Raman spectra of the liver samples. This material is available free of charge via the Internet at http://pubs.acs.org.
References and Notes
- 1.(a) Lin Y, Taylor S, Li H, Fernando KAS, Qu L, Wang W, Gu L, Zhou B, Sun YP. J Mater Chem. 2004;14:527–541. [Google Scholar]; (b) Lu F, Gu L, Meziani MJ, Wang X, Luo PG, Veca LM, Cao L, Sun YP. Adv Mater. 2009;21:139–152. [Google Scholar]
- 2.Prato M, Kostarelos K, Bianco A. Acc Chem Res. 2008;41:60–68. doi: 10.1021/ar700089b. [DOI] [PubMed] [Google Scholar]
- 3.Foldvari M, Bagonluri M. Nanomed Nanotechnol Biol Med. 2008;4:183–200. doi: 10.1016/j.nano.2008.04.003. [DOI] [PubMed] [Google Scholar]
- 4.Lacerda L, Bianco A, Prato M, Kostarelos K. Adv Drug Delivery Rev. 2006;58:1460–1470. doi: 10.1016/j.addr.2006.09.015. [DOI] [PubMed] [Google Scholar]
- 5.Sayes CM, Liang F, Hudson JL, Mendez J, Guo W, Beach JM, Moore VC, Doyle CD, West JL, Billups WE, Ausman KD, Colvin VL. Toxicol Lett. 2006;161:135–142. doi: 10.1016/j.toxlet.2005.08.011. [DOI] [PubMed] [Google Scholar]
- 6.Yang ST, Fernando KAS, Liu JH, Wang J, Sun H, Liu Y, Chen M, Huang Y, Wang X, Wang H, Sun YP. Small. 2008;4:940–944. doi: 10.1002/smll.200700714. [DOI] [PubMed] [Google Scholar]
- 7.Liu Z, Davis C, Cai W, He L, Chen X, Dai H. Proc Natl Acad Sci USA. 2008;105:1410–1415. doi: 10.1073/pnas.0707654105. [DOI] [PMC free article] [PubMed] [Google Scholar]
- 8.Liu Y, Wang H. Nat Nanotechnol. 2007;2:20–21. doi: 10.1038/nnano.2006.188. [DOI] [PubMed] [Google Scholar]
- 9.(a) Cheng J, Fernando KAS, Veca LM, Sun YP, Lamond AI, Lam YW, Cheng SH. ACS Nano. 2008;2:2085–2094. doi: 10.1021/nn800461u. [DOI] [PubMed] [Google Scholar]; (b) Cheng J, Chan CM, Veca LM, Poon WL, Chan PK, Qu L, Sun YP, Cheng SH. Toxicol Appl Pharmacol. 2009;235:216–225. doi: 10.1016/j.taap.2008.12.006. [DOI] [PubMed] [Google Scholar]
- 10.Donaldson K, Aitken R, Tran L, Stone V, Duffin R, Forrest G, Alexander A. Toxicol Sci. 2006;92:5–22. doi: 10.1093/toxsci/kfj130. [DOI] [PubMed] [Google Scholar]
- 11.Helland A, Wick P, Koehler A, Schmid K, Som C. Environ Health Perspect. 2007;115:1125–1131. doi: 10.1289/ehp.9652. [DOI] [PMC free article] [PubMed] [Google Scholar]
- 12.Zhao YL, Xing GM, Chai ZF. Nat Nanotechnol. 2008;3:191–192. doi: 10.1038/nnano.2008.77. [DOI] [PubMed] [Google Scholar]
- 13.Yang ST, Guo W, Lin Y, Deng X, Wang H, Sun H, Liu Y, Wang X, Wang W, Chen M, Huang Y, Sun YP. J Phys Chem C. 2007;111:17761–17764. [Google Scholar]
- 14.Villa CH, McDevitt MR, Escorcia FE, Rey DA, Bergkvist M, Batt CA, Scheinberg DA. Nano Lett. 2008;8:4221–4228. doi: 10.1021/nl801878d. [DOI] [PMC free article] [PubMed] [Google Scholar]
- 15.McDevitt MR, Chattopadhyay D, Jaggi JS, Finn RD, Zanzonico PB, Villa C, Rey D, Mendenhall J, Batt CA, Njardarson JT, Scheinberg DA. PLoS ONE. 2007;2:e907. doi: 10.1371/journal.pone.0000907. [DOI] [PMC free article] [PubMed] [Google Scholar]
- 16.Qu L, Lin Y, Hill DE, Zhou B, Wang W, Sun X, Kitaygorodskiy A, Suarez M, Connell JW, Allard LF, Sun YP. Macromolecules. 2004;37:6055–6060. [Google Scholar]
- 17.(a) Huang W, Fernando KAS, Allard LF, Sun YP. Nano Lett. 2003;3:565–568. [Google Scholar]; (b) Fernando KAS, Lin Y, Sun YP. Langmuir. 2004;20:4777–4778. doi: 10.1021/la036217z. [DOI] [PubMed] [Google Scholar]
- 18.Rao AM, Richter E, Bandow S, Chase B, Eklund PC, Williams KA, Fang S, Subbaswamy KR, Menon M, Thess A, Smalley RE, Dresselhaus G, Dresselhaus MS. Science. 1997;275:187–191. doi: 10.1126/science.275.5297.187. [DOI] [PubMed] [Google Scholar]
- 19.(a) Riggs JE, Guo Z, Carroll DL, Sun YP. J Am Chem Soc. 2000;122:5879–5880. [Google Scholar]; (b) Lin Y, Zhou B, Martin RB, Henbest KB, Harruff BA, Riggs JE, Guo Z, Allard LF, Sun YP. J Phys Chem B. 2005;109:14779–14782. doi: 10.1021/jp053073j. [DOI] [PubMed] [Google Scholar]; (c) Zhou B, Lin Y, Veca LM, Fernando KAS, Harruff BA, Sun YP. J Phys Chem B. 2006;110:3001–3006. doi: 10.1021/jp055501r. [DOI] [PubMed] [Google Scholar]
- 20.Guldi DM, Holzinger M, Hirsch A, Georgakilas V, Prato M. Chem Commun. 2003:1130–1131. doi: 10.1039/b301422c. [DOI] [PubMed] [Google Scholar]
- 21.Henley SJ, Hatton RA, Chen GY, Gao C, Zeng H, Kroto HW, Silva SRP. Small. 2007;3:1927–1933. doi: 10.1002/smll.200700278. [DOI] [PubMed] [Google Scholar]
- 22.Sun YP, Fu K, Lin Y, Huang W. Acc Chem Res. 2002;35:1096–1104. doi: 10.1021/ar010160v. [DOI] [PubMed] [Google Scholar]
- 23.(a) Zhou B, Lin Y, Hill DE, Wang W, Veca LM, Qu L, Pathak P, Meziani MJ, Diaz J, Connell JW, Watson KA, Allard LF, Sun YP. Polymer. 2006;47:5323–5329. [Google Scholar]; (b) Lacerda L, Pastorin G, Wu W, Prato M, Bianco A, Kostarelos K. Adv Funct Mater. 2006;16:1839–1846. [Google Scholar]
- 24.Liu Z, Li X, Tabakman SM, Jiang K, Fan S, Dai H. J Am Chem Soc. 2008;130:13540–13541. doi: 10.1021/ja806242t. [DOI] [PMC free article] [PubMed] [Google Scholar]
- 25.(a) Webster R, Didier E, Harris P, Siegel N, Stadler J, Tilbury L, Smith D. Drug Metab Dispos. 2006;35:9–16. doi: 10.1124/dmd.106.012419. [DOI] [PubMed] [Google Scholar]; (b) Fruijtier-Polloth C. Toxicology. 2005;214:1–38. doi: 10.1016/j.tox.2005.06.001. [DOI] [PubMed] [Google Scholar]
- 26.Yang ST, Wang X, Jia G, Gu Y, Wang T, Nie H, Ge C, Wang H, Liu Y. Toxicol Lett. 2008;181:182–189. doi: 10.1016/j.toxlet.2008.07.020. [DOI] [PubMed] [Google Scholar]
- 27.Gibson GG, Skett P. Introduction to Drug Metabolism. Chapman and Hall; New York: 1986. pp. 2–15. [Google Scholar]
- 28.Jia G, Wang H, Yan L, Wang X, Pei R, Yan T, Zhao Y, Guo X. Environ Sci Technol. 2005;39:1378–1383. doi: 10.1021/es048729l. [DOI] [PubMed] [Google Scholar]
- 29.Dice JF. Biogenesis, Structure and Function of Lysosomes. In: Meyers RA, editor. Encyclopedia of Molecular Cell Biology and Molecular Medicine. Wiley-VCH; New York: 2006. pp. 617–633. [Google Scholar]
- 30.Cherukuri P, Gannon CJ, Leeuw TK, Schmidt HK, Smalley RE, Curley SA, Weisman RB. Proc Natl Acad Sci USA. 2006;103:18882–18886. doi: 10.1073/pnas.0609265103. [DOI] [PMC free article] [PubMed] [Google Scholar]
- 31.Roberts AP, Mount AS, Seda B, Souther J, Qiao R, Lin S, Ke PC, Rao AM, Klaine SJ. Environ Sci Technol. 2007;41:3025–3029. doi: 10.1021/es062572a. [DOI] [PubMed] [Google Scholar]
Associated Data
This section collects any data citations, data availability statements, or supplementary materials included in this article.


