Abstract
We developed a photoacoustic ocular imaging device and demonstrated its utility in imaging the deeper layers of the eye including the retina, choroid, and optic nerve. Using safe laser intensity, the photoacoustic system was able to visualize the blood distribution of an enucleated pig’s eye and an eye of a living rabbit. Ultrasound images, which were simultaneously acquired, were overlaid on the photoacoustic images to visualize the eye’s anatomy. Such a system may be used in the future for early detection and improved management of neovascular ocular diseases, including wet age-related macular degeneration and proliferative diabetic retinopathy.
Currently available clinical ophthalmic imaging instruments are primarily optical-based, including fundus photography, optical coherence tomography [1], and angiography [2,3]. Ultrasound [4] can also be used when optical visualization is poor. While some of these techniques provide high spatial resolutions, most are limited in their depths of penetration and therefore cannot effectively visualize deep structures such as the choroid. Furthermore, such imaging devices provide mostly anatomical information with limited physiological information, which is needed in diseases such as wet age-related macular degeneration where ischemia and new blood vessels are the early symptoms of the disease [5]. Photoacoustic imaging is a promising imaging technique that is particularly useful for imaging optically deep structures without compromising the spatial resolution [6]. Photoacoustic imaging has been demonstrated to image endogenous chromophores, such as hemoglobin [7,8] and melanin [9], as well as exogenous contrast agents [10].
In this Letter we propose the use of photoacoustic imaging for ocular structures and demonstrate its utility in pig eyes ex vivo and the eyes of living rabbits. The prototype photoacoustic system is illustrated in Fig. 1. A tunable pulsed laser with a repetition rate of 10 Hz and a pulse width of 5 ns (Nd:YAG Surelight-III-10 connected to Surelite OPO Plus, Continuum) illuminated the eye through a fiber optic ring light (50-1353 Ringlight, Fiberoptic Systems), creating a homogenous and diffuse beam. The average laser pulse energy density was ~0.5 mJ/cm2 on the retina surface, which is significantly lower than the American National Standards Institute limit for eye exposure [11]. Transducers with central frequencies of 15 and 25 MHz (A319S-SU and V324-SU by Panametrics with 60% bandwidth focal length of 25 mm and element sizes of 13 and 6 mm, leading to axial resolutions of 83 and 50 μm and lateral resolutions of 200 and 240 μm, respectively) were used to acquire both pulse-echo and photoacoustic images. The transducers were focused on the retina surface, and a precision xyz stage (U500, Aerotech) was used to move the transducer and the fiber ring along a planar two-dimensional trajectory in steps of 250 μm. At each position, the transducer was used to acquire both photoacoustic and ultrasound A-scans, which were later combined into one overlaid three-dimensional (3D) intensity image. The laser pulses were sampled using a silicon photodiode (DET10A, Thorlabs) to synchronize the acquisition and compensate for pulse-to-pulse variations in laser intensity. The analog photoacoustic signals were amplified using a variable gain preamplifier (5072PR, Panametrics) and digitized using an oscilloscope (Infiniium 54825A, Agilent).
Fig. 1.

(Color online) Schematic of the photoacoustic and ultrasound imaging instruments developed and a virtual eye target with anatomical labels.
The instrument was used to scan an enucleated pig’s eye [Fig. 2(a)], providing perfectly coregistered ultrasound [Fig. 2(b)] and photoacoustic images [Figs. 2(c) and 2(d)]. The adult pig’s eye is a readily available well-established model in ophthalmology owing to its similar size to the human eye, approximately 22 mm in length compared to 24 mm in humans. The photoacoustic and ultrasound images were taken using a 15 MHz transducer that was immersed in room temperature water together with the pig’s eye. The image took 60 s to acquire and consisted of 63 A-line scans 250 μm apart with eight averages per A-line. We anticipated the blood content in the enucleated eye to be greatly reduced. Therefore, a wavelength of 700 nm was used to maximize both the blood photoacoustic signal and the depth of penetration. However, since the melanin absorption is significant at this wavelength, significant photoacoustic signals are observed from the iris and the retinal pigment epithelium, an epithelial monolayer between the retina and the choroid. The anatomy of the eye can be appreciated from the ultrasound image [Fig.2(b)]. However, owing to lack of contrast and low spatial resolution, ultrasound cannot visualize well the layers in the posterior pole of the eye, which are clearly demonstrated in the photoacoustic image [Figs. 2(c) and 2(d)]. The optic nerve sheath, which in living animals contains the blood supply for the eye, showed no photoacoustic signal. This is because the enucleated pig eye was cut at the optic nerve, thus draining it of blood.
Fig. 2.
(Color online) (a) Photographic, (b) ultrasound, and (c) photoacoustic images of an enucleated pig’s eye along the dotted red line in (a). (d) Zoomed-in view of the posterior pole of the eye in (c). The photoacoustic signal (see color bar) is displayed on a relative scale of 0–100.
Additionally, we scanned the eye of living rabbits [Fig. 3(a)] with the photoacoustic instrument. We used female New Zealand white rabbits (albino), 6–8 weeks of age, in accordance with the Association for Research in Vision and Ophthalmology Statement Regarding the Use of Animals in Ophthalmic and Vision Research, after the approval from the Stanford University Animal Institutional Review Board. The rabbits (N=3) were anesthetized using ketamine (35 mg/kg, intramuscular), xylazine (5 mg/kg, intramuscular), and glycopyrrolate (0.01 mg/kg, intramuscular) administered before the procedure and another half dose every 45 min. The rabbit’s temperature as well as heart and respiratory rates were monitored every 15 min. Pupillary dilation was achieved by 1 drop of 1% tropicamide and 2.5% phenylephrine. At the end of the experiment, rabbits were sacrificed using a lethal injection of Beuthanasia (150 mg/kg, intravenous).
Fig. 3.
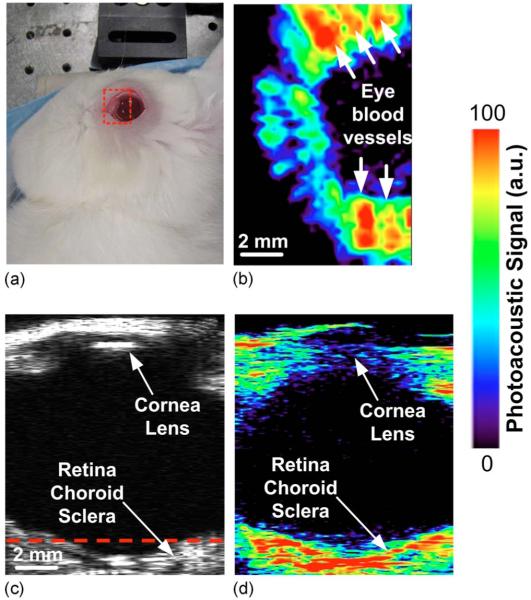
(Color online) (a) Photographic, (b) horizontal photoacoustic, (c) vertical ultrasound, and (d) vertical photoacoustic images of an eye of a living rabbit. The area of the eye imaged in (b) is outlined by the red boundary (dotted box) in (a), and the depth is noted by the dashed red line in (c).
The instrument acquired consecutive ultrasound [Fig. 3(c)] and photoacoustic [Figs. 3(b) and 3(d)] images of the rabbit’s eye. The photoacoustic image was taken at a wavelength of 740 nm to minimize the melanin absorption. The rabbit’s eye, which measures ~14 mm in diameter, was scanned with a 25 MHz central frequency transducer. The acquisition time of the entire 3D image was 90 min or ~2 min for a single B-scan with 32 averages per A-line. The scanned area was 12 mm×8 mm [delineated in Fig.3(a)] sampled in steps of 250 μm. A viscous ophthalmic contact gel (Gonak, Akorn) was applied to the eye to couple the ultrasound waves to the transducer through a plastic wrap water bath. This allowed for acoustic coupling of the eye to the transducer without applying pressure, which could affect the ocular blood volume.
The vertical photoacoustic image slice in Fig. 3(d) demonstrates the instrument’s ability to visualize the posterior eye with a high depth of penetration, far beyond the retinal depth of 130 μm in rabbits and 320 μm maximally in humans. The red dotted box in Fig. 3(a), represents the boundaries of the horizontal photoacoustic image slice in Fig. 3(b). The depth of the horizontal image is noted by the dashed red line in the vertical ultrasound slice [Fig. 3(c)]. The horizontal image gives a good view on the blood distribution in the posterior eye. However, owing to the system’s limited resolution, it is possible that several blood vessels may seem as one. These images demonstrate that safe laser intensities can generate measurable photoacoustic signals in the back of the eye, both in the retina (total thickness of 130 μm) as well as in the choroid and sclera layers.
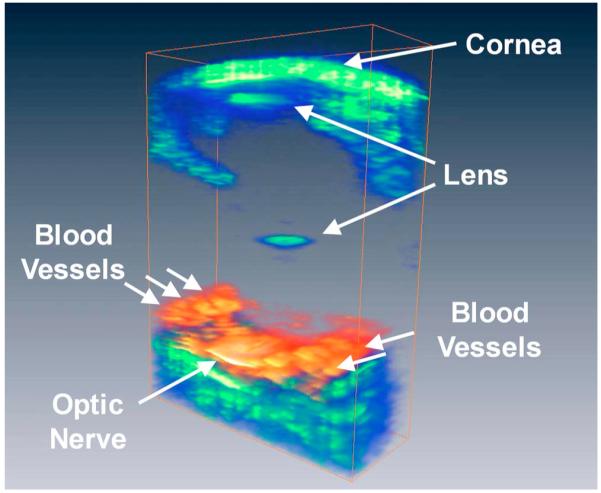
A 3D rendering of the ultrasound and photoacoustic images of the rabbit’s eye is shown in Fig. 4. The rendering was done using the commercial software (Amira, Visage Imaging). The cornea, posterior lens, and posterior pole of the eye are visualized in the ultrasound image while the optic nerve and posterior pole are visualized in the photoacoustic image due to their high volume of hemoglobin or melanin.
Fig. 4.

(Color online) 3D visualization of the photoacoustic signal from the posterior eye of a living rabbit (red) overlaid on an ultrasound image of the whole eye (green) to highlight the eye contours.
In summary, we demonstrated photoacoustic imaging as a viable noninvasive technique for imaging blood distribution in the eye with a high depth of penetration. The photoacoustic images show clear signals from the deep layers in the eye, including the choroid, sclera, and optic nerve. Such blood distribution information may be important for the diagnosis of wet age-related macular degeneration, as well as prove useful as a preclinical imaging tool for ophthalmic drug development. In the future, the spatial resolution of the image can be improved by tighter focusing of the laser beam on the retina [12]. The speed of acquisition can be improved by using lasers with higher pulse repetition rates. Finally, photoacoustic molecular imaging agents [10] can be used to target specific disease-associated receptors in the eye, such as the vascular endothelial growth factor receptor. To our knowledge, this is the first demonstration of photoacoustic imaging of the eyes of a living animal. We hope that this work will stimulate further work in the area of photoacoustic ocular imaging.
Acknowledgments
We acknowledge funding support from the National Institutes of Heath (NIH) grants NCI CCNE U54 CA119367 (S. S. Gambhir) and NCI ICMIC P50 CA114747 (S. S. Gambhir). A. de la Zerda acknowledges the Bio-X Graduate Student Fellowship and the U.S. Department of Defense (DoD) Breast Cancer Research Program–Predoctoral Traineeship Award for partially supporting this work. The authors also thank Srikant Vaithilingam, Te-Jen Ma, and Omer Oralkan for useful discussions.
Footnotes
OCIS codes: 110.5120, 110.7170, 170.4460.
References
- 1.Huang D, Swanson EA, Lin CP, Schuman JS, Stinson WG, Chang W, Hee MR, Flotte T, Gregory K, Puliafito CA, Fujimoto JG. Science. 1991;254:1178. doi: 10.1126/science.1957169. [DOI] [PMC free article] [PubMed] [Google Scholar]
- 2.Kang SW, Park CY, Ham DI. Am. J. Ophthalmol. 2004;137:313. doi: 10.1016/j.ajo.2003.09.016. [DOI] [PubMed] [Google Scholar]
- 3.Stanga PE, Lim JI, Hamilton P. Ophthalmology. 2003;110:15. doi: 10.1016/s0161-6420(02)01563-4. [DOI] [PubMed] [Google Scholar]
- 4.Silverman RH. Clin. Exp. Ophthalmol. 2009;37:54. doi: 10.1111/j.1442-9071.2008.01892.x. [DOI] [PMC free article] [PubMed] [Google Scholar]
- 5.Spaide RF, Armstrong D, Browne R. Retina. 2003;23:595. doi: 10.1097/00006982-200310000-00001. [DOI] [PubMed] [Google Scholar]
- 6.Xu MH, Wang LHV. Rev. Sci. Instrum. 2006;77:041101. [Google Scholar]
- 7.Zhang HF, Maslov K, Stoica G, Wang LV. Nat. Biotechnol. 2006;24:848. doi: 10.1038/nbt1220. [DOI] [PubMed] [Google Scholar]
- 8.Laufer J, Zhang E, Raivich G, Beard P. Appl. Opt. 2009;48:D299. doi: 10.1364/ao.48.00d299. [DOI] [PubMed] [Google Scholar]
- 9.Oh JT, Li ML, Zhang HF, Maslov K, Stoica G, Wang LV. J. Biomed. Opt. 2006;11:034032. doi: 10.1117/1.2355667. [DOI] [PubMed] [Google Scholar]
- 10.de la Zerda A, Zavaleta C, Keren S, Vaithilingam S, Bodapati S, Liu Z, Levi J, Smith BR, Ma TJ, Oralkan O, Cheng Z, Chen X, Dai H, Khuri-Yakub BT, Gambhir SS. Nat. Nanotechnol. 2008;3:557. doi: 10.1038/nnano.2008.231. [DOI] [PMC free article] [PubMed] [Google Scholar]
- 11.American National Standards Institute . American National Standard for the Safe Use of Lasers: ANSI Standard Z136.1-2000. ANSI, Inc.; 2000. [Google Scholar]
- 12.Xie Z, Jiao S, Zhang HF, Puliafito CA. Opt. Lett. 2009;34:1771. doi: 10.1364/ol.34.001771. [DOI] [PubMed] [Google Scholar]


