Abstract
The renal proximal convoluted tubule is the primary site of water, electrolyte and nutrient reabsorption and of active secretion of selected molecules. Proteins in the apical brush-border membrane facilitate these functions and initiate some of the cellular responses to altered renal physiology. The current study uses two-dimensional liquid chromatography/mass spectrometry to compare brush border membrane vesicles isolated from rat renal cortex (BBMVCTX) and from purified proximal convoluted tubules (BBMVPCT). Both proteomic data and Western blot analysis indicate that the BBMVCTX contain apical membrane proteins from cortical cells other than the proximal tubule. This heterogeneity was greatly reduced in the BBMVPCT. Proteomic analysis identified 193 proteins common to both samples, 21 proteins unique to BBMVCTX, and 57 proteins unique to BBMVPCT. Spectral counts were used to quantify relative differences in protein abundance. This analysis identified 42 and 50 proteins that are significantly enriched (p values ≤0.001) in the BBMVCTX and BBMVPCT, respectively. These data were validated by measurement of γ-glutamyltranspeptidase activity and by Western blot analysis. The combined results establish that BBMVPCT are primarily derived from the proximal convoluted tubule (S1 and S2 segments), whereas BBMVCTX include proteins from the proximal straight tubule (S3 segment). Analysis of functional annotations indicated that BBMVPCT are enriched in mitochondrial proteins and enzymes involved in glucose and organic acid metabolism. Thus the current study reports a detailed proteomic analysis of the brush-border membrane of the rat renal proximal convoluted tubule and provides a database for future hypothesis-driven research.
Keywords: rat kidney, apical membrane, spectral counting, functional annotations, membrane proteins
the proximal tubule is the most abundant segment of the nephron within the renal cortex (23). It is composed of polarized epithelial cells and consists of three subsegments (S1, S2, and S3) that differ in protein composition and function. The primary functions of the entire proximal tubule are the recovery of ∼80% of the fluid and electrolytes from the glomerular filtrate, the reabsorption of >99% of the filtered glucose and other nutrients, and the active secretion of selected molecules. These processes are facilitated by a unique set of largely Na+-independent transporters in the basolateral membrane that promote exchange of solutes with blood and a separate set of primarily Na+-dependent transporters in the apical brush-border membrane that facilitate exchange with the glomerular filtrate. In addition, the brush-border membrane also contains multiple hydrolases and proteins involved in receptor-mediated signaling.
Previous analyses of the brush-border membrane have primarily utilized brush-border membrane vesicles (BBMV) that were isolated by MgCl2 precipitation from renal cortical homogenates (4). Such studies have included the functional characterization of transporters such as the Na+-dependent glucose (25) and phosphate (3) transporters, of NHE3, the apical Na+/H+ exchanger (6), and of various peptidases and disaccharidases (22). While these studies sought to characterize the function of a single protein, a recent analysis utilized a shotgun approach to define the proteome of BBMV isolated from rat renal cortex (12). This approach offers the potential of creating a comprehensive inventory of the protein composition of the brush-border membrane. In addition, a thorough proteomic characterization of highly purified brush-border membranes would provide additional insight into the processes mediated by the proximal tubule during normal physiology. It would also provide the basis for characterizing alterations in the proteome that are associated with the loss of specific functions during pathological conditions such as hypoxic or toxic injury to the proximal tubule.
However, due to the presence of multiple cell types and the subtle differences between the segments of the proximal tubule, it may be difficult to accurately define the protein composition using BBMV isolated from renal cortex. For example, BBMV prepared from microdissected proximal convoluted and proximal straight tubules exhibit differences in kinetic parameters of glucose uptake, indicative of cell-specific expression of different isoforms (13). In addition, immunofluorescence studies have demonstrated that numerous proteins are preferentially expressed in the individual segments of the proximal tubule. For example, γ-glutamyltranspeptidase expression is greater in the proximal straight tubule (S3 segment) than in the proximal convoluted tubule (S1 and S2 segments) (9, 10, 35). Together, these results demonstrate that an accurate assessment of the localization of specific proteins by proteomic analysis may require the further enrichment of BBMV from specific segments of the proximal tubule.
In this study, two-dimensional liquid chromatography/mass spectrometry (LC-MS/MS) was used to compare the proteome of BBMV prepared from rat renal cortex (BBMVCTX) and from isolated proximal convoluted tubules (BBMVPCT). This approach, along with immunoblot analysis of marker proteins, indicated that the BBMVCTX preparation also contains apical membranes that are derived from cells of the renal cortex other than the proximal tubule. However, the initial isolation of proximal convoluted tubules by Percoll gradient centrifugation was sufficient to remove the identified contaminants from the BBMVPCT preparation. The comparative proteomic analysis also revealed significant differences between the two samples. This analysis, along with the observed differences in γ-glutamyltranspeptidase activity, indicates that the BBMVPCT are derived primarily from the S1 and S2 segments of the proximal tubule. Conversely, only the BBMVCTX contain proteins that are expressed solely in the S3 segment and exhibit higher levels of proteins that are enriched in the proximal straight tubule. Finally, an analysis of functional annotations indicates that BBMVPCT are enriched in enzymes of glucose metabolism, organic acid catabolism, and mitochondrial proteins. Therefore this study provides the first detailed proteomic analysis of the brush-border membrane of the rat renal proximal convoluted tubule.
MATERIALS AND METHODS
Materials.
Rabbit polyclonal antibodies vs. rBAT, basolateral glucose transporter (GLUT2), Na+/H+ exchanger regulatory factor-1 (NHERF1), and endoplasmic reticulum marker calnexin (CNX; H-70) were purchased from Santa Cruz Biotechnology (Santa Cruz, CA), Chemicon International (Billerica, MA), Millipore (Temecula, CA), and Abcam (Cambridge, MA), respectively. A mouse monoclonal antibody to the 70-kDa subunit of succinate dehydrogenase was from Mitosciences (Eugene, OR). Rabbit polyclonal antibodies raised against aquaporin-2, thiazide-sensitive Na+Cl− cotransporter, and Na+K+2Cl− co-ransporter-2 were kindly provided by Dr. Mark Knepper (National Institutes of Health, Bethesda, MD). Rabbit antibodies vs. rat γ-glutamyltranspeptidase were obtained from Dr. Rebecca Hughey (University of Pittsburgh). Mouse monoclonal antibodies to Na+/H+ exchanger-3 (NHE3) were kindly provided by Dr. Orson Moe (Southwestern Medical Center, Dallas, TX). Male Sprague-Dawley rats (∼200 g) were obtained from Charles River Laboratories (Kingston, NY) and were fed rodent chow (Harlan-Teklad, Madison, WI) and tap water. All procedures were approved by the Institutional Animal Care and Use Committee at Colorado State University.
Purification of proximal convoluted tubules.
Rat renal proximal convoluted tubules were isolated by Percoll density gradient centrifugation (11). Briefly, ∼1-mm3 pieces of excised kidney cortex were incubated in PBS containing 5 mM glucose, 1 mg/ml bovine serum albumin, 0.1 mg/ml DNAse, 2 mg/ml collagenase B (Roche Diagnostics, Mannheim, Germany), 1 mM heptanoic acid, 1 mM phenylmethylsulfonyl fluoride, and 1 mM sodium orthovanadate. The resulting tubules were washed twice in PBS containing 5 mM glucose to remove collagenase and then resuspended in an osmotically and pH-balanced PBS solution containing 5 mM glucose, 45% Percoll (Sigma Life Sciences), and 10 mM HEPES, pH 7.4. After centrifugation, the tubules were recovered from a band that formed near the bottom of the gradient and were washed twice with PBS containing 5 mM glucose to remove the Percoll.
Isolation of BBMV.
BBMV were prepared using the standard method of MgCl2 precipitation (4, 5). Excised kidney cortex or purified proximal convoluted tubules were resuspended in 10 volumes (vol/wet wt.) of a solution containing 300 mM mannitol, 5 mM EGTA, 1 mM phenylmethylsulfonyl fluoride, 1 mM sodium orthovanadate and 12 mM HEPES, pH 7.1. After polytron homogenization (90 s, setting 5), the homogenate was diluted twofold with H2O and then MgCl2 was added to yield a final concentration of 12 mM. The mixture was then incubated on ice for 15 min with intermittent and gentle mixing. Following centrifugation at 3,000 g for 10 min at 4°C to remove mitochondria and cellular debris, the resultant supernatant was centrifuged at 30,000 g for 40 min at 4°C to pellet the BBMV. The pellet was then resuspended in 1 volume of 150 mM mannitol, 2.5 mM EGTA, and 6 mM HEPES, pH 7.1 and homogenized with 15 passes of a glass teflon homogenizer. The BBMV were again precipitated by addition of 12 mM MgCl2 and repetition of the incubation and centrifugation steps. The final pellet was resuspended in the previous mannitol buffer, and the BBMV were stored at −80°C.
γ-Glutamyltranspeptidase assay and immunoblot analyses.
Aliquots of cortical homogenate and the isolated BBMV were assayed for protein (30) and γ-glutamyltranspeptidase activity (29). The specific activity (μmol·min−1·mg−1) was determined by quantifying the liberation of p-nitroanaline from γ-glutamyl-p-nitroanaline (Sigma-Aldrich) with glycylglycine (Sigma-Aldrich) as the acceptor. For immunoblot analyses, samples containing 20 μg of protein were separated by 7 or 10% SDS-PAGE. Following transfer to polyvinylidene difluoride membranes (Immobilon-FL, Millipore), the blots were incubated overnight with either mouse monoclonal or rabbit polyclonal antibodies. Either 680 or 800 Dylight-conjugated goat anti-mouse or goat anti-rabbit IgG (Pierce) was used as a secondary antibody [1:10,000 (vol/vol)]. The resulting complexes were visualized and quantified using an Odyssey Infrared Imager (LI-COR Biosciences, Lincoln, NE).
Sample preparation and MS analysis.
Aliquots of BBMV containing 100 μg of protein were denatured by heating at 95°C for 5 min. After cooling to room temperature, the samples were dried and reconstituted to 3 mg/ml in 8 M urea. The ultrasonicated samples were reduced (14 mM dithiothreitol, 30 min, 37°C) and alkylated (5 mM iodoacetamide, 1 h, 37°C) and then diluted fivefold with 100 mM ammonium bicarbonate, pH 8.0. Sequencing grade-modified tryspin was added (1:30, enzyme:protein) and the samples were incubated for 16 h at 37°C. The resulting peptides were desalted on a PepClean-C18 spin column (Thermo Scientific), normalized by measuring the absorbance at 220 nm (Nanodrop), and fractionated by strong cation exchange (SCX) chromatography. For SCX fractionation, the peptides were bound to a Polysulfoethyl-A microspin TopTip (Glygen) and eluted stepwise with 20-μl volumes of increasing ammonium acetate (20, 40, 60, 80, 120, 160, and 200 mM) in 20% acetonitrile, pH 2.9–3.8 to yield a total of seven fractions. The peptides were then dried (SpeedVac) and reconstituted in 30 μl of 0.1% formic acid/3% acetonitrile. Each fraction was analyzed in triplicate by injecting 7-μl aliquots onto a Biobasic C-18 PicoFrit reverse phase nanospray column (74 μm ID × 10 cm, New Objective). Peptides were eluted directly into an LTQ MS (Thermo Scientific) using a 90-min linear gradient of 15%–45% acetonitrile in 0.1% formic acid at a flow rate of 300 nl/min. MS spectra were collected over an m/z range of 200–2,000 Da. MS/MS spectra were collected for the five most abundant ions in each MS scan using a dynamic exclusion limit of 2 MS/MS spectra of a given mass for 30 s with an exclusion duration of 90 s. Compound lists of the resulting spectra were generated using Bioworks 3.0 software (Thermo Scientific) with an intensity threshold of 5,000 and 1 scan/group.
Bioinformatic analysis.
The resulting mass spectra were searched against the Rat-IPI database (v.3.57) using SEQUEST and X!Tandem (v.2008.12.01) search engines (8, 16, 45). Each search was performed with a mass tolerance of 2.5 Da for MS and 1.0 Da for MS/MS spectra and with settings for tryptic peptides with up to two missed cleavages and carbamidomethylation of cysteine as a fixed modification and oxidation of methionine as a variable modification. Peptide false discovery rates (FDR) were determined by a target decoy approach using a reversed database concatenated to the parent forward database (15, 21). The results of the searches were combined, and protein identifications were validated using Scaffold (Proteome Software). Protein identifications with ΔCn values ≥0.2 and Xcorr scores ≥2.0 (z+1), ≥2.4 (z+2), and ≥3.7 (z+3) for SEQUEST and Expect scores ≥ 1.0 for X!Tandem were entered in Scaffold (v.2.02) to produce a FDR of ≤1%. Lists of total proteins were assembled using a minimum of two identified peptides in at least one of the biological replicates of each BBMV preparation as an additional threshold for protein identification. Transmembrane domains were predicted using the TMHMM server (v. 20) (http://cbs.dtu.dk) (24, 38).
The relative abundance of the identified proteins in the BBMV isolated from cortex (BBMVCTX) or from purified proximal convoluted tubules (BBMVPCT) was determined by spectral counting (33). Similarity of sampling across injections was examined by comparing the spectral counts (SpC) for each analysis. SpC were also compared by summing each of the SCX fractions from a single sample. Correlation between injections and between each of the biological samples was calculated using the Pearson moment correlation function with the R statistics package (v.2.8.1; http://www.r-project.org). Several diagnostic variables were calculated for each biological sample. These included total spectra, total identified spectra, percentage of total spectra above the search engine threshold cutoffs, and total proteins identified. After a review of these diagnostics, each protein was tested for differential abundance.
Fisher's exact test (37, 46) was used to identify significant differences between the BBMVCTX and BBMVPCT samples and to calculate P values for each protein. Tests were run after summing the SpC for each protein over the biological replicates. The Benjamini-Yeuketieli multiple testing adjustment (2) was applied to control the false discovery rate. For each protein, the ratio of the spectral counts (RSC) in the BBMVPCT samples to the BBMVCTX samples was calculated using Eq. 1 (1, 31), where nCTX and nPCT are the total SpC in the BBMVPCT and BBMVCTX samples, respectively, and t is the total SpC for all of the identified proteins in each of the two samples.
| (1) |
An adjusted P value ≤0.001, a RSC >1, and a minimum of two identified peptides per protein were used as the cutoff for a significant change in protein abundance between the BBMVCTX and BBMVPCT samples. Once significant differences were determined, the RSC values were plotted vs. the total SpC for each protein in the combined BBMVCTX and BBMVPCT samples. The combined cutoff values were then used to visualize the distribution of the proteins that were significantly enriched in either BBMV preparation.
Enrichment of gene functional annotations.
A list of Gene Identifier accession numbers corresponding to each IPI accession was created using Microsoft Access software. The list of Gene Identifiers for the two samples (BBMVCTX and BBMVPCT) were then used to upload the proteins into the DAVID 2008 Bioinformatics Resources web server (http://david.abcc.ncifcrf.gov/) for analysis (14, 19). Lists of total proteins per sample were tested for enrichment of functional annotations using the suggestions of Huang et al. (19). Rattus norvegicus was used as the background species to test for enrichment of gene ontology and Kegg pathway terms. Biological process, cellular component, and molecular function were tested separately. Functional annotations were selected based on known inferences of cell function for our samples (i.e., brush-border membrane, proximal tubule function, glycolysis, etc.). Lists of interest were assembled based on these inferences and then expanded by manually evaluating proteins whose functional annotations were incomplete.
RESULTS AND DISCUSSION
Enrichment of BBMV from cortex and from proximal convoluted tubules.
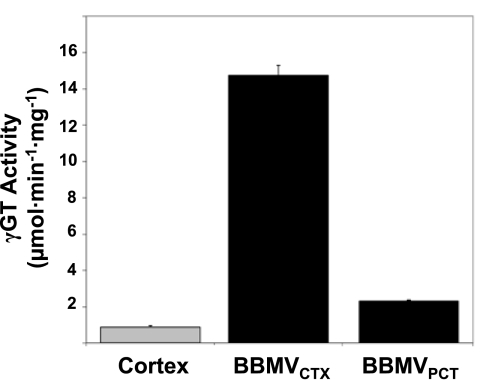
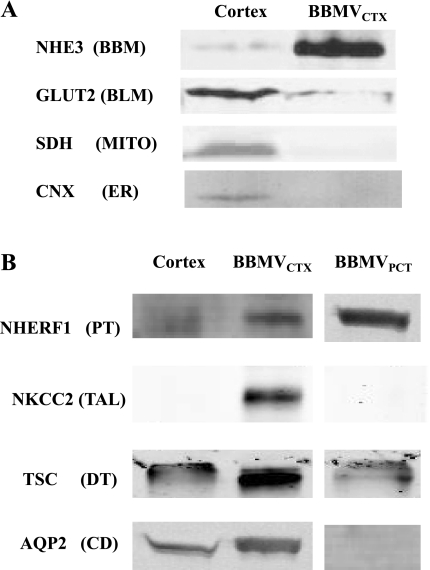
Initially, BBMVCTX were prepared by selective MgCl2 precipitation from a homogenate of rat renal cortex (5). Compared with the cortical homogenate, the isolated BBMVCTX exhibit a 15-fold increase in specific activity of γ-glutamyltranspeptidase, an apical membrane marker for the proximal tubule (Fig. 1). Western blot analysis (Fig. 2A) also indicated that the BBMVCTX are highly enriched in the apical Na+/H+ exchanger (NHE3). However, the BBMVCTX are essentially free of the mitochondrial succinate dehydrogenase (SDH) and CNX but contain reduced levels of GLUT2, These data are in agreement with previous results (5) and are consistent with the removal of other subcellular membranes. However, the isolated BBMVCTX exhibit increased levels of markers for the apical membranes of the collecting duct (aquaporin-2), the thick ascending limb, (Na+K+2Cl− cotransporter-2), and the distal tubule (thiazide-sensitive Na+Cl− cotransporter) (Fig. 2B). These data indicate that the classic preparation of BBMV also contains the apical membranes from cortical cells other than the proximal tubule.
Fig. 1.
Enrichment of γ-glutamyltranspeptidase (γ-GT) activity in isolated brush-border membrane vesicles (BBMV). Crude homogenates of rat renal cortex and of isolated BBMV in the cortex and proximal convoluted tubules (BBMVCTX and BBMVPCT, respectively) were assayed for γ-GT activity and protein. The fold-increases in specific activity are plotted as a bar graph ± SD for 3 separate samples.
Fig. 2.
Western blot analyses of the purity of the BBMVCTX and BBMVPCT. A: analysis of contaminating organelle and basolateral membranes. Samples containing 20 μg of crude homogenates of rat renal cortex and BBMVCTX were separated by SDS-PAGE and probed with antibodies that are specific for the apical (BBM) Na+/H+ exchanger-3 (NHE3), the basolateral (BLM) glucose transporter (GLUT2), the mitochondrial (MITO) succinate dehydrogenase (SDH), and the endoplasmic reticulum (ER) marker calnexin (CNX). B: analysis of contaminating apical membranes. Samples containing 20 μg of renal cortex and BBMVCTX or isolated BBMVPCT were probed for proteins that, within the cortex, are expressed only in the proximal tubule (PT), Na+/H+ exchanger regulatory factor-1 (NHERF1); the thick ascending limb (TAL), Na+K+2Cl−-cotransporter-2 (NKCC2); the distal tubule (DT), thiazide-sensitive Na+Cl− co-transporter (TSC); and the collecting duct (CD), aquaporin-2 (AQP2). For each protein, the spacing denotes where a lane was deleted from the original figure of a single gel.
Previous studies indicated that the other cortical cells were effectively removed by using Percoll gradient centrifugation to purify proximal tubules (11, 41). By microscopic inspection, tubules isolated by this procedure appear to be >90% pure proximal convoluted tubules (S1 and S2 segments) with very few proximal straight tubules (S3 segments). The isolated tubules were homogenized and used to isolate BBMVPCT by MgCl2 precipitation. As anticipated, Western blot analysis of the isolated BBMVPCT indicated a significant reduction in the intensity of the apical membrane proteins from non-proximal tubular cells compared with the BBMVCTX (Fig. 2B). As a control, the samples were also probed for NHERF1, an abundant protein that is localized to the apical membrane (42). Interestingly, the specific activity of γ-glutamyltranspeptidase in the BBMVPCT is increased only twofold compared with the cortical homogenate (Fig. 1). Previous enzymatic analysis of dissected tubular segments (9, 10) and immunofluorescence studies (35, 36) indicated that γ-glutamyltranspeptidase is predominantly expressed in the proximal straight tubule of the rat kidney. Therefore, the lower fold-increase in γ-glutamyltranspeptidase activity is a further indication that the BBMVPCT are derived largely from the proximal convoluted tubule. A comparative proteomic analysis of BBMVCTX and BBMVPCT samples should verify the conclusions that the latter preparation is more highly enriched and is derived specifically from the proximal convoluted tubule.
Proteomic analysis of BBMVCTX and BBMVPCT.
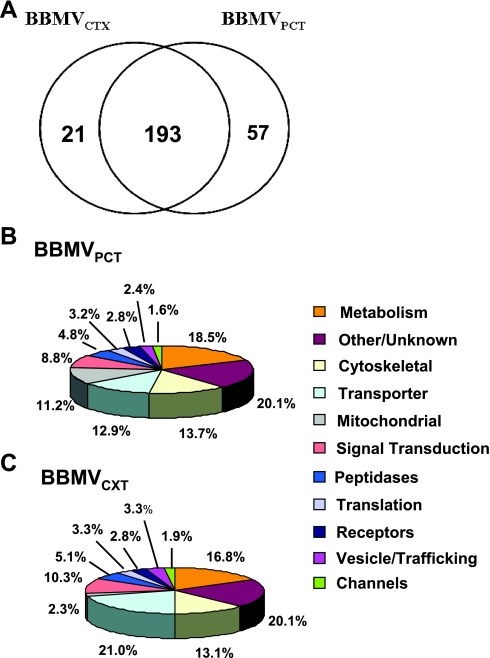
Duplicate biological samples of BBMVCTX and BBMVPCT were analyzed by two-dimensional LC-MS/MS. Each sample was initially separated by off-line SCX chromatography to produce seven fractions. Triplicate samples from each of the SCX fractions were further fractionated by online C18-chromatography coupled directly to an LTQ MS via a nanoelectrospray source. The SEQUEST and X!Tandem search engines were used to match the recorded MS/MS spectra from the 84 MS analyses against the current rat IPI database. The resulting identifications were validated in Scaffold using stringent criteria that produced a false discovery rate of ≤1%. This analysis identified 193 proteins common to both preparations of BBMV, 57 proteins unique to the BBMVPCT, and 21 proteins unique to the BBMVCTX (Fig. 3A). Functional analysis of the 250 proteins contained in the BBMVPCT indicated that nearly 30% of the identified proteins are transporters, peptidases, and cytoskeleton proteins that are typical of the brush-border membrane (Fig. 3B). An additional 12% of the proteins are membrane receptors and proteins involved in signal transduction. Of the total identified proteins, 22% are integral membrane proteins and an additional 18% are peripheral membrane proteins. However, the single largest group of identified proteins is those involved in metabolism. Functional analysis of the 214 proteins identified in the BBMVCTX samples indicated a slightly greater proportion of membrane transporters and a decreased level of mitochondrial proteins (Fig. 3C) compared with the BBMVPCT samples. A complete list of the identified proteins is provided in Supplemental Table S1 (all supplemental material for this article are available on the journal web site).
Fig. 3.
Proteomic analysis of BBMVCTX and BBMVPCT. A: Venn diagram of total proteins identified in the 2 BBMV samples. B: functional classification of the 251 proteins identified in the BBMVPCT sample. C: functional classification of the 214 proteins identified in the BBMVCTX samples.
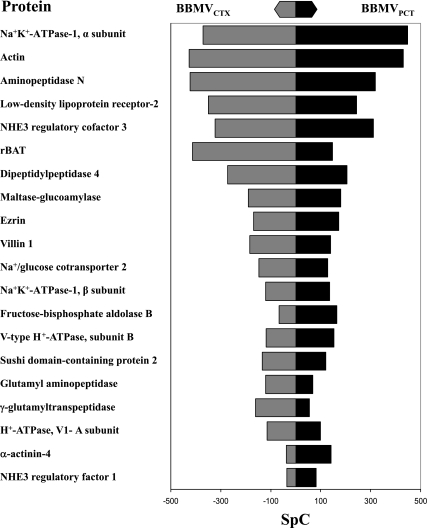
A comparison of the relative abundance of the 20 most abundant proteins in the combined BBMVPCT and BBMVCTX samples, as determined by SpC, is illustrated in Fig. 4. Many of the most abundant proteins are well-characterized apical membrane proteins: actin, aminopeptidase N, LDL receptor-2, Na+/H+ exchanger regulatory factor-3, an amino acid transporter (rBAT), dipeptidylpeptidase-4, maltase-glucoamylase, ezrin, villin-1, and Na+/glucose cotransporter-2. By contrast, the α- and β-subunits of the Na+/K+-ATPase-1 are very abundant proteins that are localized primarily in the basal lateral membrane (39, 43). Their presence is likely to reflect a slight contamination of the BBMV preparations with basolateral membranes as evidenced by the Western blot of GLUT2 (Fig. 2B). For the most part, this set of proteins produced a similar number of SpC in the two samples. However, a few proteins, such as rBAT and γ-glutamyltranspeptidase, appear to be more abundant in the BBMVCTX than in the BBMVPCT. By contrast, aldolase-B, α-actinin-4, and NHE3 regulatory factor-1 appear to be more abundant in the BBMVPCT. Therefore, a statistical analysis of the SpC associated with the proteins identified in the BBMVPCT and BBMVCTX samples was performed to verify the differences in the two preparations.
Fig. 4.
Comparison of the total spectral counts (SpC) associated with the 20 most abundant proteins identified in the combined BBMVPCT and BBMVCTX samples. SpC determined for each protein in the BBMVPCT and BBMVCTX samples are illustrated by the black bar and the grey bar, respectively.
Quantitative analysis of protein abundance in BBMVCTX and BBMVPCT.
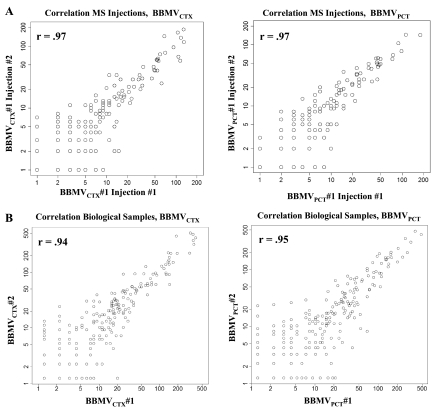
SpC collected for an individual protein increase in proportion to its abundance (33). As a result, spectral counting has become the preferred method of quantification due to its ease of implementation compared with alternative methods that require chemical modification of peptides or labeling with heavy isotopes. However, to utilize the SpC to quantify the differences in protein abundance, the data derived from each sample must be carefully analyzed to ensure that no significant loss of proteins or peptides occurred during the sample preparation. For the reported data, the SD of the total identified SpC for each of the four biological samples expressed as a percentage of the mean was only 5.6%. The same analysis for total spectra (unidentified and identified), percentage of total spectra identified, and the number of protein identifications yielded values of 2.6, 6.5, and 7.5%, respectively. The highest variance was between the two BBMVCTX samples. This could be due to the heterogeneity introduced by the dissection of the renal cortex. To further assess the consistency of replicate samples, the total SpC for each of the identified proteins was compared between individual injections (Fig. 5A) and between the sum of all injections (Fig. 5B). As expected, the greatest dissimilarity was observed in the SpC measured for the less abundant proteins. However, the data had Pearson's correlation coefficients of r = 0.97 between representative injections and r = 0.94 and r = 0.95 for the replicate BBMVCTX and BBMVPCT samples, respectively. Therefore, the SpC measured in the multiple injections and the biological replicates were highly reproducible.
Fig. 5.
Scatterplots of total SpC in replicate samples. A: correlation of total SpC between replicate injections. Pearson's product indicated a correlation of r = 0.97 between typical examples of replicate injections. B: correlation of total SpC between biological replicates. Pearson's product indicated correlations of r = 0.94 and r = 0.95 between the replicate BBMVCTX and BBMVPCT samples, respectively.
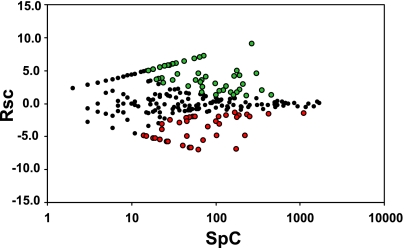
Fisher's exact test (37) was used to identify significant changes in protein abundance between the BBMVCTX and BBMVPCT samples. The resulting P values were adjusted for multiple testing using the Benjamini-Yeuketieli correction (2). The criteria for identifying a significant change were set as RSC >1 (i.e., >2-fold change in total SpC) and a corrected P value of ≤0.001. The normalized RSC for the 271 proteins identified in the two BBMV samples were plotted vs. the total SpC and color coded to identify proteins that are significantly enriched in either BBMV preparation (Fig. 6). This analysis identified 42 proteins that were significantly enriched in the BBMVCTX and 50 proteins enriched in the BBMVPCT. The proteins that are significantly enriched in the two samples are italicized in Supplemental Table S1.
Fig. 6.
Statistical analysis of differences in abundance of the proteins identified in the BBMVCTX and BBMVPCT samples. The analysis is illustrated as a plot of log2 of the normalized ratio of SpC (RSC) vs. the total SpC for all of the identified proteins. Green and red circles represent proteins that are significantly increased in either the BBMVPCT or BBMVCTX samples, respectively. Black circles represent the remaining proteins that are not different in the 2 samples.
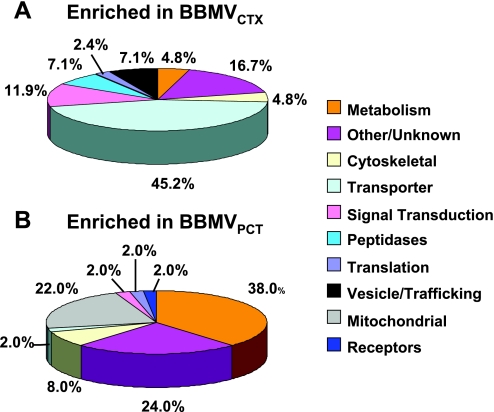
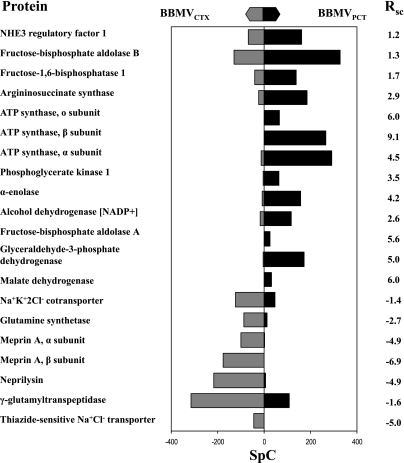
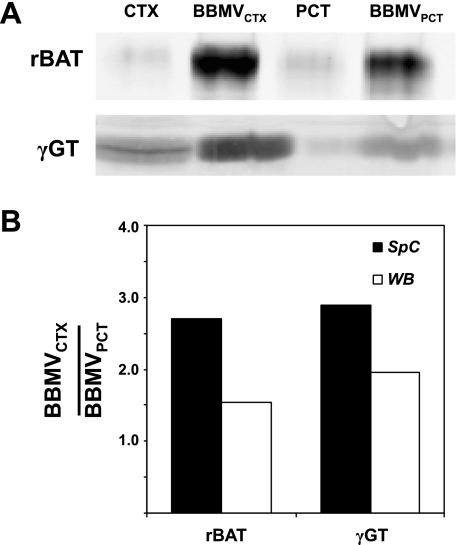
The compiled data revealed significant enrichment of several interesting proteins in both the BBMVCTX and BBMVPCT preparations. Functional analysis of the data indicates that membrane transporters constitute 45% of the proteins enriched in the BBMVCTX (Fig. 7A), but only 21% of the total proteins identified in the BBMVCTX (Fig. 3C). Some of the proteins that are significantly enriched in the BBMVCTX are illustrated in Fig. 8. The RSC values are the estimated log2 ratios of abundance comparing BBMVPCT to BBMVCXT. Included in this list are the thiazide-sensitive Na+Cl− cotransporter and Na+K+2Cl− cotransporter-2 that are derived from the apical membranes of the distal tubule and the thick ascending limb, respectively. These data are validated by the previous Western blot analysis (Fig. 2B) and strongly support the conclusion that the BBMVPCT are essentially free of contaminating apical membranes from non-proximal tubule cells. The BBMVCTX samples are also significantly enriched for meprin, neprilysin, the amino acid transporter rBAT, glutamine synthetase, and γ-glutamyltranspeptidase. Of particular interest is the identification of neprilysin, which is not expressed in the S1 and S2 segments of the proximal tubule (34, 40). In addition, rBAT (17), glutamine synthetase (7), and γ-glutamyltranspeptidase (35) are proteins that are primarily expressed in the S3 segment. The increases in rBAT and γ-glutamyltranspeptidase quantified by spectral counting were confirmed by Western blot analysis (Fig. 9). Thus the observed increase in their abundance in the BBMVCTX further validates the conclusion that the BBMVPCT are derived primarily from the proximal convoluted tubule.
Fig. 7.
Functional classification of the proteins that are significantly enriched in the BBMVCTX (A) and the BBMVPCT (B) samples.
Fig. 8.
Comparison of the total SpC associated with proteins that are significantly enriched in the BBMVPCT or BBMVCTX sample. The total SpC determined for each protein in the BBMVPCT and BBMVCTX samples are illustrated by the black bar and the grey bar, respectively. The RSC value is the log2 of the normalized ratio of the total SpC in the BBMVPCT to the BBMVCTX samples.
Fig. 9.
Validation of the enrichment in BBMVCTX of proteins that are preferentially expressed in the S3 segment of the proximal tubule. A: levels of amino acid transporter rBAT and γ-GT in homogenates of kidney cortex and BBMVCTX and BBMVPCT samples were assessed by Western blot analysis. B: fold-enrichment of rBAT and γ-GT in the BBMVCTX to BBMVPCT samples was calculated from the ratio of SpC and by Western blot analysis (WB) and illustrated as a bar graph.
Functional analysis of the proteins that were enriched in the BBMVPCT group revealed an increased abundance of enzymes of metabolism and mitochondrial proteins (Fig. 6B). The former group constitutes 38% of the proteins that are significantly enriched, but only 19% of the total proteins identified in the BBMVPCT (Fig. 3B). This group contains 11 proteins (Supplemental Table S1) involved in glucose metabolism including aldolase B and fructose 1,6-bisphosphatase-1 (Fig. 8). Aldolase B was previously reported to colocalize with the vacuolar H+-ATPase in the apical membrane and the submicrovillar zone of endocytic vesicles (27). This interaction is essential for the assembly and the activity of the proton pump (26, 28). Immunofluorescence studies demonstrated that fructose 1,6-bisphosphatase-1 is also concentrated in the apical region of the rat renal proximal convoluted tubule (44). As a result of their localization, aldolase B and fructose 1,6-bisphosphatase-1 may be trapped in the BBMVPCT that are formed during homogenization of isolated proximal convoluted tubules. The enrichment of multiple enzymes of glucose metabolism also supports the concept that the enzymes form a complex that facilitates the channeling of intermediates of glycolysis and/or gluconeogenesis (32). The positioning of this complex adjacent to the brush-border membrane may facilitate the catabolism of glucose that is reabsorbed from the glomerular filtrate. Alternatively, following an overnight fast (18) or the onset of acidosis (20), this complex could facilitate the net renal synthesis of glucose from reabsorbed gluconeogenic precursors.
Mitochondrial proteins constitute 22% of the proteins that are enriched in the BBMVPCT but only 11% of total identified proteins. The proteins enriched in the BBMVPCT included components of the mitochondrial ATP synthase, including the α-, β-, and oligomycin-binding subunits (Fig. 8). The mitochondria within the proximal convoluted tubule are larger, more elongated, and more abundant than those within the proximal straight tubule (23). In addition, the mitochondria in the S1 and S2 segments are positioned in close proximity to the well-developed endocytic apparatus immediately underneath the brush-border membrane. By contrast, the small circular mitochondria found in the S3 segment are more evenly distributed throughout the cytosol. As a result, mitochondrial proteins, released during homogenization, may be preferentially trapped in the BBMVPCT.
In summary, the reported data establish that sequential isolation of proximal tubules by Percoll gradient centrifugation and MgCl2 aggregation yields a highly enriched preparation of BBMV that are derived preferentially from the S1 and S2 segments of the proximal convoluted tubule. Comparison of the reported proteomic data to those of Cutillas et al. (12) also indicates that this preparation contains a similar level of intracellular contaminants as observed with BBMV purified by capillary free-flow electrophoresis. However, the reported protocol is simpler and utilizes equipment that is more generally available. Thus the reported protocol and database provide the basis for a comprehensive analysis of the temporal changes in the brush-border membrane that occur in response to various physiological adaptations or pathological conditions.
GRANTS
This research was supported in part by National Institutes of Diabetes and Digestive and Kidney Diseases Grants DK-37124 and DK-75517 awarded to N. P. Curthoys.
DISCLOSURES
No conflicts of interest are declared by the authors.
Supplementary Material
REFERENCES
- 1.Beissbarth T, Hyde L, Smyth GK, Job C, Boon WM, Tan SS, Scott HS, Speed TP. Statistical modeling of sequencing errors in SAGE libraries. Bioinformatics 20, Suppl 1: i31–i39, 2004 [DOI] [PubMed] [Google Scholar]
- 2.Benjamini Y, Yekutieli D. The control of the false discovery rate in multiple testing under dependency. Ann Stat 29: 1165–1188, 2001 [Google Scholar]
- 3.Biber J, Hernando N, Forster I, Murer H. Regulation of phosphate transport in proximal tubules. Pflügers Arch 458: 39–52, 2009 [DOI] [PubMed] [Google Scholar]
- 4.Biber J, Stieger B, Haase W, Murer H. A high yield preparation for rat kidney brush border membranes. Different behaviour of lysosomal markers. Biochim Biophys Acta 647: 169–176, 1981 [DOI] [PubMed] [Google Scholar]
- 5.Biber J, Stieger B, Stange G, Murer H. Isolation of renal proximal tubular brush-border membranes. Nat Protoc 2: 1356–1359, 2007 [DOI] [PubMed] [Google Scholar]
- 6.Bobulescu IA, Moe OW. Luminal Na+/H+ exchange in the proximal tubule. Pflügers Arch 458: 5–21, 2009 [DOI] [PMC free article] [PubMed] [Google Scholar]
- 7.Burch HB, Choi S, McCarthy WZ, Wong PY, Lowry OH. The location of glutamine synthetase within the rat and rabbit nephron. Biochem Biophys Res Commun 82: 498–505, 1978 [DOI] [PubMed] [Google Scholar]
- 8.Craig R, Beavis RC. TANDEM: matching proteins with tandem mass spectra. Bioinformatics 20: 1466–1467, 2004 [DOI] [PubMed] [Google Scholar]
- 9.Curthoys NP, Kuhlenschmidt T. Phosphate-independent glutaminase from rat kidney. Partial purification and identity with gamma-glutamyltranspeptidase. J Biol Chem 250: 2099–2105, 1975 [PubMed] [Google Scholar]
- 10.Curthoys NP, Lowry OH. The distribution of glutaminase isoenzymes in the various structures of the nephron in normal, acidotic, and alkalotic rat kidney. J Biol Chem 248: 162–168, 1973 [PubMed] [Google Scholar]
- 11.Curthoys NP, Taylor L, Hoffert JD, Knepper MA. Proteomic analysis of the adaptive response of rat renal proximal tubules to metabolic acidosis. Am J Physiol Renal Physiol 292: F140–F147, 2007 [DOI] [PubMed] [Google Scholar]
- 12.Cutillas PR, Biber J, Marks J, Jacob R, Stieger B, Cramer R, Waterfield M, Burlingame AL, Unwin RJ. Proteomic analysis of plasma membrane vesicles isolated from the rat renal cortex. Proteomics 5: 101–112, 2005 [DOI] [PubMed] [Google Scholar]
- 13.Del Valle PL, Trifillis A, Ruegg CE, Kane AS. Characterization of glucose transport by cultured rabbit kidney proximal convoluted and proximal straight tubule cells. In Vitro Cell Dev Biol Anim 38: 218–227, 2002 [DOI] [PubMed] [Google Scholar]
- 14.Dennis G, Jr, Sherman BT, Hosack DA, Yang J, Gao W, Lane HC, Lempicki RA. DAVID: Database for Annotation, Visualization, and Integrated Discovery. Genome Biol 4: P3, 2003 [PubMed] [Google Scholar]
- 15.Elias JE, Gygi SP. Target-decoy search strategy for increased confidence in large-scale protein identifications by mass spectrometry. Nat Methods 4: 207–214, 2007 [DOI] [PubMed] [Google Scholar]
- 16.Fenyo D, Beavis RC. A method for assessing the statistical significance of mass spectrometry-based protein identifications using general scoring schemes. Anal Chem 75: 768–774, 2003 [DOI] [PubMed] [Google Scholar]
- 17.Furriols M, Chillaron J, Mora C, Castello A, Bertran J, Camps M, Testar X, Vilaro S, Zorzano A, Palacin M. rBAT, related to l-cysteine transport, is localized to the microvilli of proximal straight tubules, and its expression is regulated in kidney by development. J Biol Chem 268: 27060–27068, 1993 [PubMed] [Google Scholar]
- 18.Gerich JE, Meyer C, Woerle HJ, Stumvoll M. Renal gluconeogenesis: its importance in human glucose homeostasis. Diabetes Care 24: 382–391, 2001 [DOI] [PubMed] [Google Scholar]
- 19.Huang da W, Sherman BT, Lempicki RA. Systematic and integrative analysis of large gene lists using DAVID bioinformatics resources. Nat Protoc 4: 44–57, 2009 [DOI] [PubMed] [Google Scholar]
- 20.Iynedjian PB, Ballard FJ, Hanson RW. The regulation of phosphoenolpyruvate carboxykinase (GTP) synthesis in rat kidney cortex. The role of acid-base balance and glucocorticoids. J Biol Chem 250: 5596–5603, 1975 [PubMed] [Google Scholar]
- 21.Kall L, Storey JD, MacCoss MJ, Noble WS. Assigning significance to peptides identified by tandem mass spectrometry using decoy databases. J Proteome Res 7: 29–34, 2008 [DOI] [PubMed] [Google Scholar]
- 22.Kenny AJ, Maroux S. Topology of microvillar membrane hydrolases of kidney and intestine. Physiol Rev 62: 91–128, 1982 [DOI] [PubMed] [Google Scholar]
- 23.Kriz W, Kaissling B. Structural organization of the mammalian kidney. In: The Kidney: Physiology and Pathophysiology ( 4th ed.), edited by Alpern RJ, Hebert SC. San Diego, CA: Elsevier, 2008, chapt. 20, p. 479–564 [Google Scholar]
- 24.Krogh A, Larsson B, von Heijne G, Sonnhammer EL. Predicting transmembrane protein topology with a hidden Markov model: application to complete genomes. J Mol Biol 305: 567–580, 2001 [DOI] [PubMed] [Google Scholar]
- 25.Lee YJ, Han HJ. Regulatory mechanisms of Na+/glucose cotransporters in renal proximal tubule cells. Kidney Int Suppl: S27–S35, 2007 [DOI] [PubMed] [Google Scholar]
- 26.Lu M, Ammar D, Ives H, Albrecht F, Gluck SL. Physical interaction between aldolase and vacuolar H+-ATPase is essential for the assembly and activity of the proton pump. J Biol Chem 282: 24495–24503, 2007 [DOI] [PubMed] [Google Scholar]
- 27.Lu M, Holliday LS, Zhang L, Dunn WA, Jr, Gluck SL. Interaction between aldolase and vacuolar H+-ATPase: evidence for direct coupling of glycolysis to the ATP-hydrolyzing proton pump. J Biol Chem 276: 30407–30413, 2001 [DOI] [PubMed] [Google Scholar]
- 28.Lu M, Sautin YY, Holliday LS, Gluck SL. The glycolytic enzyme aldolase mediates assembly, expression, and activity of vacuolar H+-ATPase. J Biol Chem 279: 8732–8739, 2004 [DOI] [PubMed] [Google Scholar]
- 29.McIntyre TM, Curthoys NP. Comparison of the hydrolytic and transfer activities of rat renal gamma-glutamyltranspeptidase. J Biol Chem 254: 6499–6504, 1979 [PubMed] [Google Scholar]
- 30.Minamide LS, Bamburg JR. A filter paper dye-binding assay for quantitative determination of protein without interference from reducing agents or detergents. Anal Biochem 190: 66–70, 1990 [DOI] [PubMed] [Google Scholar]
- 31.Old WM, Meyer-Arendt K, Aveline-Wolf L, Pierce KG, Mendoza A, Sevinsky JR, Resing KA, Ahn NG. Comparison of label-free methods for quantifying human proteins by shotgun proteomics. Mol Cell Proteomics 4: 1487–1502, 2005 [DOI] [PubMed] [Google Scholar]
- 32.Ovadi J, Srere PA. Macromolecular compartmentation and channeling. Int Rev Cytol 192: 255–280, 2000 [DOI] [PubMed] [Google Scholar]
- 33.Paoletti AC, Washburn MP. Quantitation in proteomic experiments utilizing mass spectrometry. Biotechnol Genet Eng Rev 22: 1–19, 2006 [DOI] [PubMed] [Google Scholar]
- 34.Ronco P, Pollard H, Galceran M, Delauche M, Schwartz JC, Verroust P. Distribution of enkephalinase (membrane metalloendopeptidase, E.C. 342411) in rat organs. Detection using a monoclonal antibody. Lab Invest 58: 210–217, 1988 [PubMed] [Google Scholar]
- 35.Shimada H, Endou H, Sakai F. Distribution of gamma-glutamyl transpeptidase and glutaminase isoenzymes in the rabbit single nephron. Jpn J Pharmacol 32: 121–129, 1982 [DOI] [PubMed] [Google Scholar]
- 36.Shiozawa M, Yamashita S, Aiso S, Yasuda K. A monoclonal antibody against human kidney gamma-glutamyl transpeptidase: preparation, immunochemical, and immunohistochemical characterization. J Histochem Cytochem 37: 1053–1061, 1989 [DOI] [PubMed] [Google Scholar]
- 37.Sokol RR, Rohlf FJ. Biometry: The Principles and Practice of Statistics in Biological Research (3rd ed.). New York: Freeman, 1994 [Google Scholar]
- 38.Sonnhammer EL, von Heijne G, Krogh A. A hidden Markov model for predicting transmembrane helices in protein sequences. Proc Int Conf Intell Syst Mol Biol 6: 175–182, 1998 [PubMed] [Google Scholar]
- 39.Tumlin JA, Hoban CA, Medford RM, Sands JM. Expression of Na-K-ATPase α- and β-subunit mRNA and protein isoforms in the rat nephron. Am J Physiol Renal Fluid Electrolyte Physiol 266: F240–F245, 1994 [DOI] [PubMed] [Google Scholar]
- 40.Vekaria RM, Shirley DG, Sevigny J, Unwin RJ. Immunolocalization of ectonucleotidases along the rat nephron. Am J Physiol Renal Physiol 290: F550–F560, 2006 [DOI] [PubMed] [Google Scholar]
- 41.Vinay P, Gougoux A, Lemieux G. Isolation of a pure suspension of rat proximal tubules. Am J Physiol Renal Fluid Electrolyte Physiol 241: F403–F411, 1981 [DOI] [PubMed] [Google Scholar]
- 42.Wade JB, Liu J, Coleman RA, Cunningham R, Steplock DA, Lee-Kwon W, Pallone TL, Shenolikar S, Weinman EJ. Localization and interaction of NHERF isoforms in the renal proximal tubule of the mouse. Am J Physiol Cell Physiol 285: C1494–C1503, 2003 [DOI] [PubMed] [Google Scholar]
- 43.Wetzel RK, Sweadner KJ. Immunocytochemical localization of Na-K-ATPase α- and γ-subunits in rat kidney. Am J Physiol Renal Physiol 281: F531–F545, 2001 [DOI] [PubMed] [Google Scholar]
- 44.Yanez AJ, Bertinat R, Concha II, Slebe JC. Nuclear localization of liver FBPase isoenzyme in kidney and liver. FEBS Lett 550: 35–40, 2003 [DOI] [PubMed] [Google Scholar]
- 45.Yates JR, 3rd, Eng JK, McCormack AL, Schieltz D. Method to correlate tandem mass spectra of modified peptides to amino acid sequences in the protein database. Anal Chem 67: 1426–1436, 1995 [DOI] [PubMed] [Google Scholar]
- 46.Zhang B, VerBerkmoes NC, Langston MA, Uberbacher E, Hettich RL, Samatova NF. Detecting differential and correlated protein expression in label-free shotgun proteomics. J Proteome Res 5: 2909–2918, 2006 [DOI] [PubMed] [Google Scholar]
Associated Data
This section collects any data citations, data availability statements, or supplementary materials included in this article.


