Abstract
To study the roles of nonmuscle myosin II (NM-II) during invasive cell migration, microfluidic migration chambers have been designed and fabricated using photo- and soft-lithography microfabrication techniques. The chamber consists of two channels separated by a vertical barrier with multiple bays of pores with widths varying from 6 µm to 16 µm, and lengths varying from 25µm to 50µm. The cells are plated in the channel on one side of the barrier while a chemoattractant is flowed through the channel on the other side of the barrier. In these chambers, cells can be observed with transmitted light or fluorescence optics while they chemotax through various sized pores that impose differential mechanical resistance to transmigration. As an initial test of this device, we compared breast-cancer cell chemotactic transmigration through different pore sizes with and without inhibition of NM-II. Two distinct rates were observed as cells attempted to pull their nucleus through the smaller pores, and the faster nuclear transit mode was critically dependent on NM-II motor activity. The ability to monitor cells as they chemotax through pores of different dimensions within a single experimental system provides novel information on how pore size affects cell morphology and migration rate, providing a dramatic improvement of imaging potential relative to other in vitro transmigration systems such as Boyden chambers.
Keywords: chemotaxis, transmigration, nonmuscle myosin II
1 Introduction
Transmigration, the ability to migrate across cellular barriers such as epithelial or endothelial tissues, is important for both normal immune function and cancer metastasis. During normal immune surveillance, leukocytes cross the endothelium to enter the interstitial space, while metastatic cancer cells dispersed via the vascular system must breach vessel wall tissue at least twice: during entry into the vasculature (known as intravasation), and again exiting the vasculature to establish secondary tumors (known as extravasation) (Sherwood, 2006;Rowe and Weiss, 2008). Recent evidence suggests that nonmuscle myosin II’s (NM-II’s) may be differentially activated for force generation during transmigration compared to free migration on 2-D substrates (Lammermann et al., 2008). NM-II’s are filament forming mechanoenzymes that interact with the actin cytoskeleton to generate force. They are the cellular motor proteins responsible for generating approximately 85% of traction forces, indicating they might have an important role in transmigration (Cai et al., 2006). Despite its critical function in traction force generation, inhibition of NM-II motor activity with the NM-II specific inhibitor blebbistatin can actually increase cell migratory rate during free migration on a 2-D substrate (Even-Ram et al., 2007;Liu et al., 2009). However, blebbistatin treatment has been shown to selectively inhibit leukocyte migration in dense collagen gels (3 mg ml−1) compared to less dense collagen gels (0.75 mg ml−1) (Lammermann et al., 2008).
Despite the ubiquity and importance of transmigration, it remains a difficult process to study, in part because transmigration occurs in complex environments not readily amenable to live cell microscopic imaging. A common assay for studying transmigration is the Boyden chamber assay in which cells migrate across a filter towards a passive chemotactic gradient. While much knowledge has been gained from typical in vitro assays such as Boyden chambers, migration assays in matrigel, or their combination (Shaw, 2005), these assays suffer from three primary drawbacks when it comes to studying cell migration dynamics. First, they are relatively bulky and the migration events occur too far from the surface to readily image cells during migration, consequently they are primarily end-point assays and cannot be used for live cell imaging. Second, these systems rely on uncontrolled chemo-attractant gradients to induce migration; the gradients dissipate over time providing an unstable stimulus to the cells. Third, specifically regarding Boyden chambers, each chamber consists of pores of the same diameter. In order to study the effect of pore dimension using the same experimental conditions, multiple experiments need to be run using multiple chambers. Particularly in view of the temporal decay of the gradient in Boyden chambers, this introduces hard to control variability. A more useful tool to gain increased understanding of transmigration would provide the ability to perform time-lapse live cell imaging as cells squeeze through narrow pores of graded dimensions.
Microfabrication techniques allow precise control over the stability and shape of biochemical gradients, improving on the uncontrolled gradients of previous assays. Microfabrication has been used to implement numerous approaches to study chemotaxis, providing valuable insights. However, most follow unconstrained cell migration and cannot be used to study the effects of transmigration through mechanically restrictive pores. Gradient generators using pyramidal mixing networks or parallel dividers to the direction of flow can be used to generate stable, linear or nonlinear gradients, respectively (Jeon et al., 2000;Irimia et al., 2006). Standard soft-lithography techniques permits these devices to be made on coverslip glass such that cellular response to these gradients can be monitored using time-lapse microscopy to study chemotactic behavior (Li et al., 2002;Saadi et al., 2006). Other techniques have created devices that generate gradients by using microvalves to control free diffusion between a source and sink microchannel or diffusion through a membrane (Frevert et al., 2006;Wu et al., 2006;Abhyankar et al., 2006). Still other techniques have used microfluidics to apply a diffusional gradient across cells cultured within, or migrating through, hydrogels (Cheng et al., 2007;Wong et al., 2008).
Recently, approaches have been utilized that separate convective flow from diffusion by connecting two or more delivery channels with a microchannel (or chamber) perpendicular to the direction of flow (Irimia et al., 2007;Saadi et al., 2007;Atencia et al., 2009). These devices allow the study of chemotaxis in linear or complex gradients without the confounding effects caused by convective flow (Walker et al., 2005;Beta et al., 2008). Saadi et al. (2007) filled their microchannels with collagen type I to study migration within gels, while Irimia D. et al. (2007) look specifically at cell migration within mechanically restrictive pores by keeping the pore length 15× greater than the length of a leukocyte, and the pore dimensions uniform throughout the chamber. To further the understanding of transmigration mechanisms, this work presents a complementary device for the examination of how pore dimension affects transmigration. Constrained migration initiates migratory mechanisms different from those used during standard cell migration (Wolf et al., 2003;Friedl, 2004;Lammermann et al., 2008). In order to identify the cytoskeletal components that are differentially engaged during restrictive transmigration one must be able to differentiate between degrees of restrictive transmigration. Here we present the “transpore chamber,” a microfluidic device to study the effects of pore dimension on chemotactic transmigration. The transpore chamber couples a chemotactic gradient with transverse micro-pores that vary in width and length. This provides a unique tool to study differential engagement of cytoskeletal components at different levels of restrictive migration.
The transpore chamber is a novel microfluidic device that generates relatively stable gradients within transverse microchannels between a chemoattractant chamber and cell chamber. It expands on similar designs by included pores of graded width and length to better understand how pore dimension affects transmigration. To demonstrate the efficacy of the transpore chamber for studying cytoskeletal dynamics during transmigration studies, we monitored the effects of blebbistatin treatment on the speed of the breast cancer cell MDA-MB-231 as they migrate through pores of different dimension. Blebbistatin treatment differentially affects migration at narrower dimensions suggesting that NM-II force is specifically engaged during transmigration. The transpore chamber provides a robust experimental assay for the expanded study of cytoskeletal dynamics during transmigration.
2 Materials and methods
2.1 Fabrication and characterization
Chambers were designed using AutoCAD (Autodesk, Inc.) and used to generate a chrome coated soda-lime glass transparency mask. Master molds for the devices were made by patterning SU-8 2025 (Microchem Corp.) coated silicon wafers using standard photolithography techniques. Poly(dimethyl siloxane) (PDMS, Sylgard, Dow Chemical) replicas were made by casting PDMS over the SU-8 masters. Flow ports were punched into the PDMS replica using a sharpened 3/8” diameter copper tube. PDMS replicas were then bonded to coverslip glass (22 × 60 × 0.15 mm) via treatment with oxygen plasma followed by heating at 100°C for 5 min. Scanning electron microscope micrographs were taken of non-bonded PDMS replicas using the environmental mode of a Quanta 200 3D SEM (FEI). Molecular transport through the pores was characterized by using a 0.001% (w v−1) fluorescein isothyocynate dye dissolved in PBS as a small molecule marker flowed in one inlet and PBS alone flowed in the other inlet. All linescans and image analysis was performed in Matlab (The Mathworks, Inc.).
2.2 Computation fluid dynamics (CFD) and transport modeling
To verify gradient formation and stability, we carried out simulations using Comsol CFD software (3.5a, Comsol, Inc.). The chamber model in 2D was imported into Comsol and extruded to obtain a full 3D model of the chamber and the gates. The 3D model was meshed to obtain 613672 elements. Fluid dynamics calculations utilized the Navier-Stokes equations with a fluid density of 1000 kg m−3 and viscosity of 8×10⁻⁴ Pa-sec. Molecular transport calculations involved the species conservation law and Fick’s diffusional transport with a diffusion coefficient of 1×10⁻⁹ m2 sec−1. The solution for velocity profile was first obtained followed by the concentration profile.
2.3 Experimental setup
Human breast cancer cells (MDA-MB-231) were obtained from American Type Culture Collection and maintained in Minimal Essential Media (Gibco) supplemented with 10% fetal bovine serum (FBS), 1% L-glutamine, and 1% penicillin/streptomycin. Cells were incubated in low serum (1% FBS) media for 12–16 hours prior to loading into the transpore chamber. The chamber was pretreated with a 50 µg mL−1 bovine fibronectin solution and incubated for 1 hour at room temperature. The fibronectin solution was then flushed out of the chamber with low serum media. Adherent cells were detached using a non-enzymatic dissociation buffer (Invitrogen, cat. 13151014), and resuspended in low serum media. DNA was stained by adding the far-red fluorescent DNA dye DRAQ5 (Biostatus Limited) at a concentration of 40 µM to media prior to cell loading into the chamber. Cells at a density of 8×10⁶ cells mL−1 were injected into one inlet while low serum media was injected into the other channel. The chamber was then incubated at 37°C and 5% CO2 for one hour to allow the cells to attach and spread. The cell side channel was then connected to a syringe with serum free media and the opposite channel connected to a syringe with 10% serum media. The device was then placed on a Leica AM TIRF MC System (Leica Microsystems) temperature controller and CO2 incubation chamber (Leica Microsystems, GmbH) and an ImageEM C9100-13 EMCCD camera (Hamamatsu). The syringes were connected to a syringe pump (Harvard apparatus PHD 22/2000 Advance Syringe Pump). Media was then pumped into the chamber at 2 µl min−1. For experiments using the nonmuscle myosin II inhibitor blebbistatin, blebbistatin was added to the perfusion media of both syringes at a concentration of 100 uM (Calbiochem, USA). All images were acquired using a 20× 0.5 NA dry objective. Fluorescent images were acquired using a 633 nm laser.
3 Results
3.1 Chamber characterization
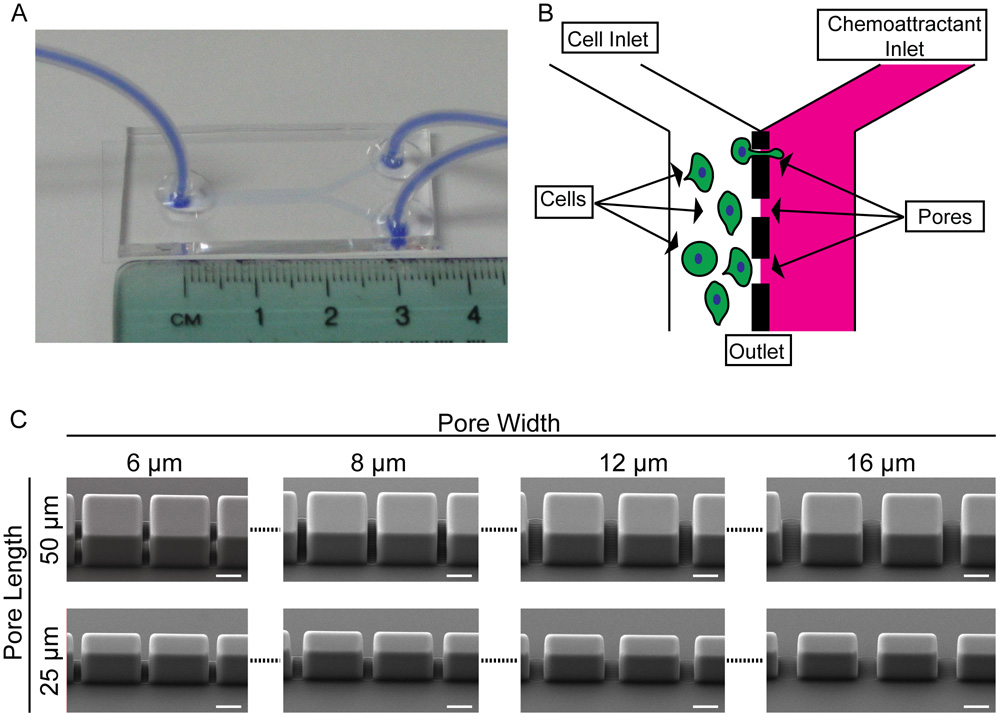
The transpore chamber is made of PDMS bonded to coverslip glass (Fig. 1A). The chamber consists of two channels separated by a vertical barrier with a series of gaps, like a picket fence, creating pores for cells to crawl through. Pores of the same size are grouped into clusters of ten and each new cluster starts 500µm downstream from the previous cluster. The length of each pore, determined by the wall thickness, is initially 50 µm long. Beginning 1000 µm downstream from the inlets there is a cluster of 6 µm wide pores, then a cluster of 8 µm wide pores, then a cluster of 12 µm wide pores, then a cluster of 16 µm wide pores (Fig. 1C upper row). The length of the pores is then reduced to 25 µm and the same sequence of pore widths is repeated (Fig. 1C, lower row). Experiments are run by preferentially loading cells in one channel and monitoring transmigration while a chemoattractant is flowed in the other channel (Fig. 1B). SEM images were taken of the different pores within the chamber, illustrating that the pores have vertical sidewalls and dimensions consistent with the design(Fig. 1C). The entire chamber is 2,800 µm across, consisting of the cell loading channel (1,375 µm wide) and the chemoattractant channel (1,375 µm wide) separated by the 50 µm or 25 µm barrier. The height of the chamber is ~ 40 µm. The entire device design is such that it can fit onto a 22 × 60 mm glass coverslip.
Fig. 1. Layout of transpore chamber.
A. The transpore chamber is a ‘Y’ shaped microfluidic device in which the two incoming channels are separated by a vertical wall of varying thickness (50 µm or 25 µm) with gates of varying widths (6, 8, 12, 16 µm). Serum starved cells are plated in the left channel and serum rich media is flowed through the opposite chamber. B. Schematic illustrating the design of the chamber. C. SEM images of different pores. The features of the device are within ±0.2 µm of the design parameters while maintaining vertical sidewalls presenting a uniform pore width to the migrating cells. Scale bars = 20 µm.
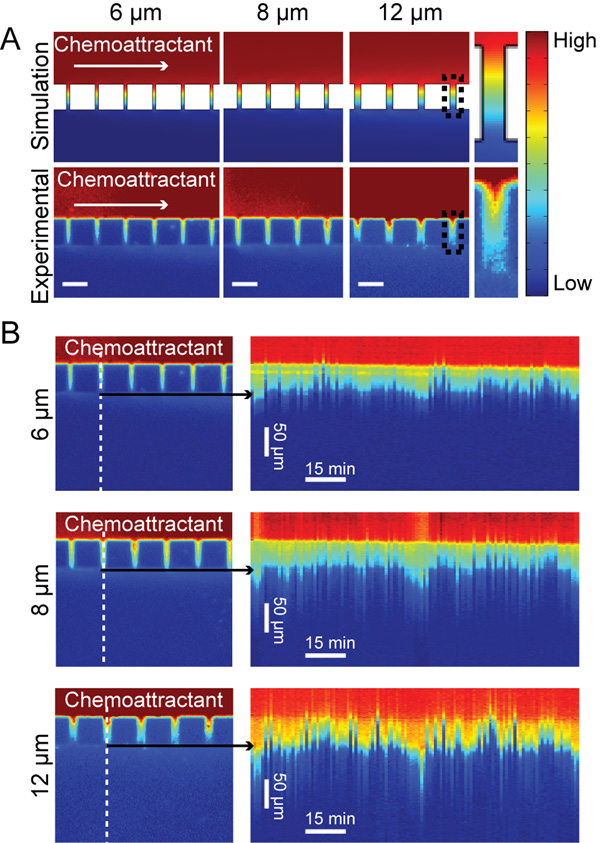
Fetal bovine serum (FBS) contains a mixture of chemokines varying in size from 430 Da (formyl-methionyl-leucyl-phenylalanine) to 13 kDa (chemokine ligand 2) and is often used to study the chemotactic response of various cell types(Li and Bresnick, 2006;Beadle et al., 2008;Mishima and Lotz, 2008;Bulotta et al., 2009). For ordinary diffusion-based transport in a pore of length L the concentration gradient will depend on the solution concentration at the two ends of the channel, irrespective of the molecular size of any particular compound (Bird et al., 2006). Therefore, fluorescein (376 Da) provides an appropriate tracer to analyze the shape of the serum chemoattractant gradient used for live-cell experiments. To better understand the behavior of the chemoattractant gradient, a fluorescein gradient was established within the pores by connecting a syringe with 0.001% fluorescein solution to one inlet and a syringe with PBS to the other inlet. The solutions were then pumped into the chamber with a flow rate of 2 µl min−1. For experiments with cells, 10% FBS media was flowed into one channel while serum free media was flowed into the cell loaded channel. After flow began it took approximately 15 minutes for the solutions to reach the chamber, at which point the gradient was established immediately. The gradient concentration profiles of fluorescein were analyzed and a 3D simulation of small molecule transport at steady state was performed using COMSOL Multiphysics. Details of the gradient at 50 µm long pores at 6, 8, and 12 µm widths from both simulation and experimental data (Fig 2A) show a gradient forming within the each pore with the gradient broadening slightly at each pore size downstream in the channel. The dynamics and stability of the gradient were analyzed by performing a timelapse experiment of the fluorescein flow (Fig. 2B). The direction of the gradient is stable over long periods of time but the magnitude has a mild oscillatory behavior, possibly due to bulk flow effects introduced by the syringe pump.
Fig. 2. Chemoattractant establishes a gradient within pores to bias cell migration.
A. Small molecule transport within the chambers was simulated in COMSOL Multiphysics and compared with experimental data using fluoroscein as a marker for the chemoattractant and a 2 µl min−1 flow rate. Experimental data verified that there was a gradient forming across the pores. Black boxes at 12 µm pores indicates pores used for close up view. For fluorescein concentration goes from 0.001% (High) to 0% (Low). B. From the same fluoroscein experiment, time lapse images were used to generate kymographs showing the dynamics of the gradient over time. A line scan (indicated by the dashed line) was taken at each frame of the time series through a single pore. The linescans were then plotted next to each other to generate the kymograph. Kymographs show that the gradient does oscillate slightly over time.
In order to assess the effectiveness of the gradient on biasing the transmigration of MDA-MB-231 cells, the migratory direction through all pores was monitored in the presence and absence of a gradient. To load cells into the chamber, they are manually injected into one channel. During this process, cells flow through the larger pores, and during mixing will populate the entire length of the both channels. Because the cells were attaching in both channels, this provided the opportunity to determine the effectiveness of the serum gradient to stimulate chemotactic migration by monitoring the direction of transmigration with and without a serum gradient. Migration events across the chamber barrier typically occur in five distinct steps. Cells first come into contact with the central barrier. Second, they identify a pore by extending processes into it and then migrate to the pore opening. Third, the cells begin moving their cell body into the pore and begin transmigration. Fourth, the cells then extend processes out of the other side of the pore. Finally the cell body exits the pore and the cell crawls out into the opposite channel. The time it takes to identify and approach a pore varied depending on the initial position of the cell and the local cell density. In order to isolate the transmigration mechanism as much as possible, transmigration events were scored as the time it took the cell to go from step three to step five (initiation of cell body movement into the pore until cell body exit). The cell body was identified manually in bright field images, or by the location of the nucleus in fluorescent images. In the absence of gradient (1% serum in both channels of the device) cells migrate randomly, showing no bias in their migratory direction (53% migrated in one direction, 47% in the opposite direction). When there is a gradient present, 86% of all control transmigration events are towards the gradient. The serum gradient provided appropriate directional cues for the cells to interpret and migrate towards while the mild oscillations did not have a noticeable deleterious effect on migration. The cells may not have been able to sense the oscillations due to the time averaging of chemotactic signals that occurs during signal transduction, or the magnitude of the oscillations may not have been severe enough to disrupt polarized migration (Berg and Purcell, 1977;Bialek and Setayeshgar, 2005).
3.2 Cells migrate through narrow pores at two different rates
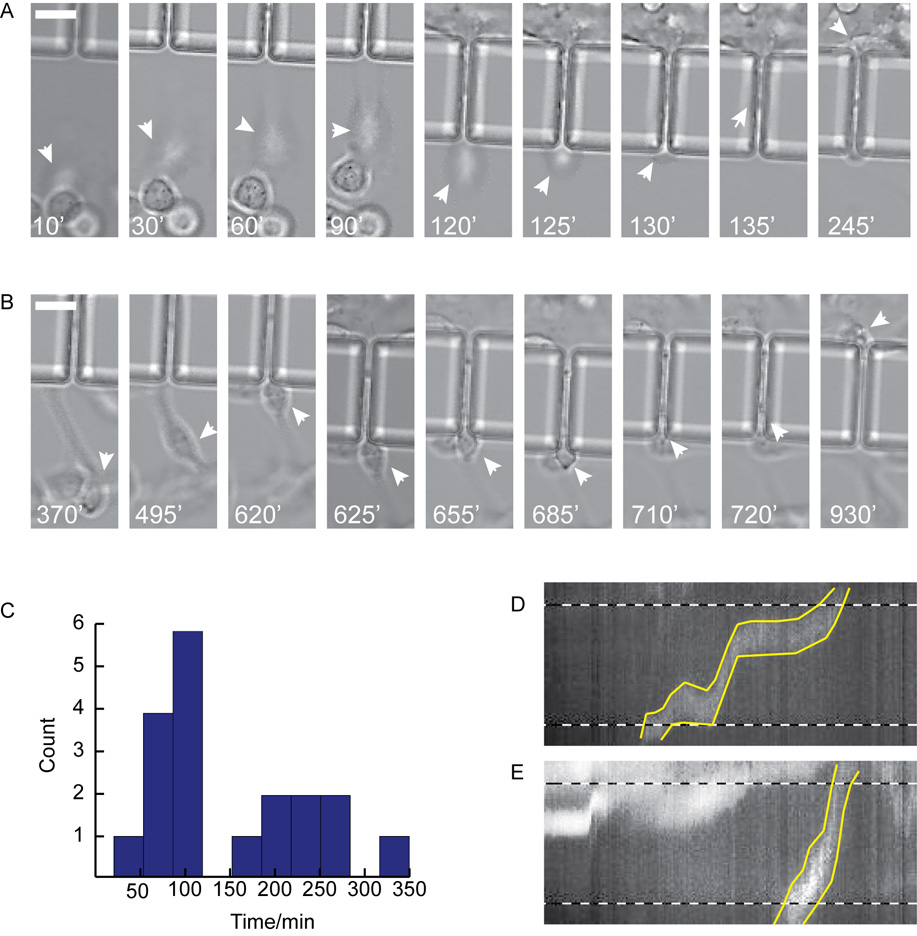
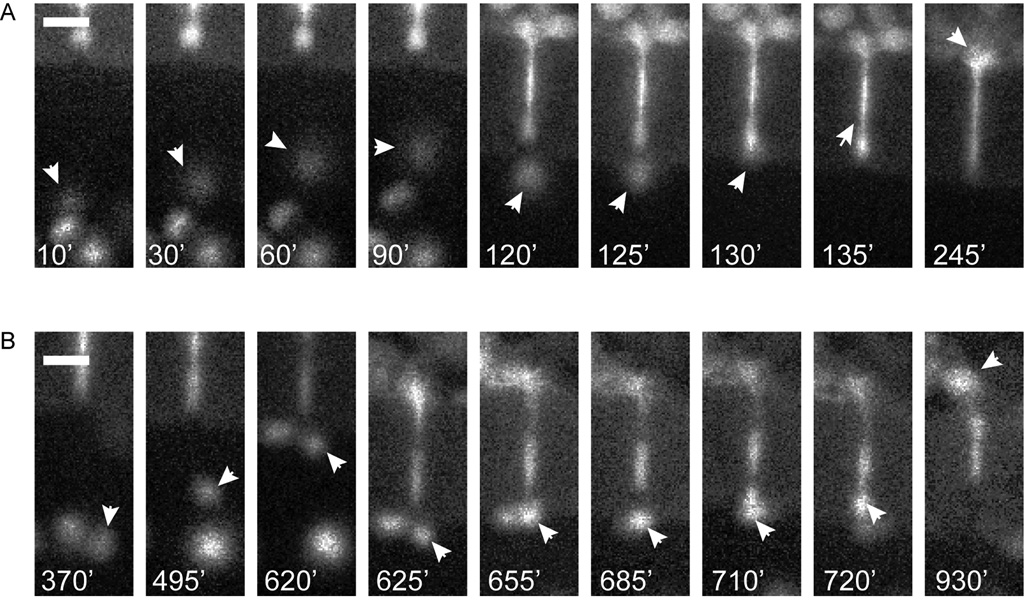
The benefit of the transpore chamber is that it allows the visualization of all steps in the transmigration process. Once cells have oriented themselves in the gradient, they identify the pore opening by extending lamellipodia in the direction of the pore opening (Fig. 3A and 3B). Once the cell has contacted the pore opening with a protrusion, its body is pulled towards the pore opening. Within the transpore chamber there appear to be two distinct rates of transmigration that can be differentiated once the cell body is wedged into the pore opening: either the cell body and nucleus are rapidly contracted to fit within the pore (Fig. 3A, Fig. 4A and Online Resource 1) or the cell continues extending through the pore until the cell body is slowly pulled behind it (Fig. 3B, Fig. 4B and Online Resource 1).
Fig. 3. Cells demonstrate bimodal migration rates through 6 µm pores.
A. ‘Fast’ MDA-MB-231 cell shown migrating towards and through a pore. White arrows point to cell body as cell approaches pore (10 min – 120 min), contracts into pore (125 min – 130 min), migrates through the pore and exits from the opposite side (135 min – 245 min). B. ‘Slow’ MDA-MB-231 cell shown migrating towards the pore opening (370 min – 620 min), contracting the cell body into the pore (625 min – 720 min), migrating through pore and exiting from the opposite side (720 min – 930 min). Arrows indicate position of cell body, time shown in white at bottom of each frame. C. Histogram of nuclear translocation through 6 µm pores for all control experiments. D & E. Kymographs where made of ‘slow’ (D) and ‘fast’ (E) cells from images where the nucleus was fluorescently labeled with draq5. Dashed lines indicate pore boundaries, yellow lines indicate nuclear boundaries. Scale bars = 20 µm.
Fig. 4. Fluorescent images to corresponding to Fig. 3A and 3B.
A. Fluorescent images of ‘fast’ MDA-MB-231 cell nucleus shown migrating towards and through a 50 × 6 µm pore. White arrows point to nucleus as cell approaches pore (10 min – 120 min), contracts into pore (125 min – 130 min), migrates through the pore and exits from the opposite side (135 min – 245 min). B. Fluorescent images of ‘slow’ MDA-MB-231 cell nucleus transmigration through a 50 × 6 µm pore. White arrows indicate nucleus as cell migrates towards the pore opening (370 min – 620 min), contracts its cell body into the pore (625 min – 720 min), migrates through pore and exits from the opposite side (720 min –930 min). Arrows indicate position of nucleus, time shown in white at bottom of each frame. Scale bars = 20 µm.
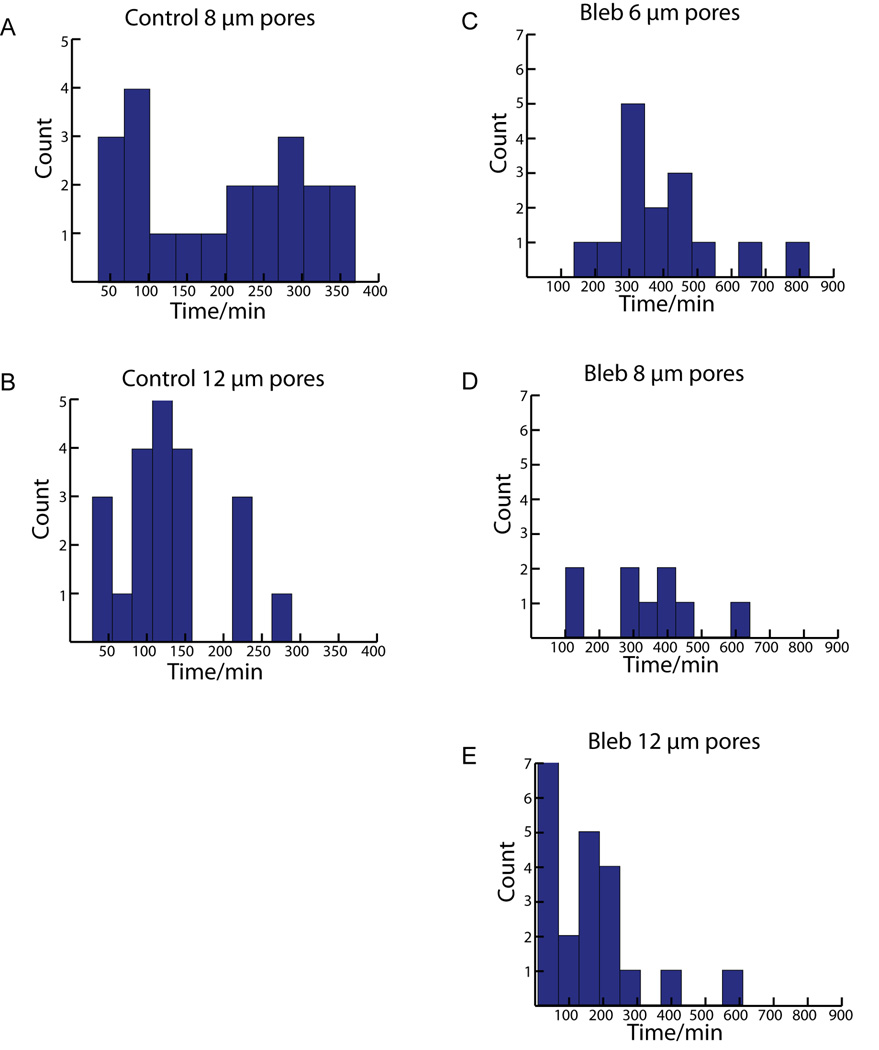
While we expected to differentiate transmigration times at different pore sizes, it was surprising to see such a wide range of transmigration times at the same pore size. Transmigration times were scored as the time it takes the nucleus to traverse from one side of the 50 µm pore to the other. The 150 minute point was chosen to delineate between ‘fast’ and ‘slow’ populations of cells based on the apparent separation in the distributions of transmigration at 50 × 6 µm and 50 × 8 µm pores (Fig. 3C and Fig. 5A). At 50 × 6 µm pores, there was a population of ‘fast’ cells (n = 11) that had an average transmigration time of 87±25 minutes and a population of ‘slow’ cells (n = 8) that had an average transmigration time of 241±57 minutes. (Fig. 3C). At 50 × 8 µm pores the ‘fast’ pool (n = 8) had an average transmigration time of 70±28 minutes while the ‘slow’ pool (n=13) had an average transmigration time of 270±64 minutes (Fig. 5A). However, at 50 × 12 µm the slower population is absent and cells appear to have a single mode of transmigration with a time of 130±66 minutes (Fig. 5B).
Fig. 5. Histograms of transmigration time distribution for all 50 µm long pores.
A. Control experiments at 50 × 8 µm pores shows clusters of cells at both ‘fast’ and ‘slow’ transmigration times, similar to 50 × 6 µm pores. B. Control cells seem to have more consistent transmigration times at 50 × 12 µm pores. C & D. Inhibition of NM-II motor activity greatly reduces ‘fast’ population of transmigration times at 50 × 6 and 50 × 8 µm pores. E. At 50 × 12 µm pores NM-II inhibition no longer effectively prevents ‘fast’ transmigration.
Because the transpore chamber allows for live imaging of cells as they migrate through pores, we were able to further characterize the behavior of both pools of cells. The ‘slow’ cells took longer to both contract their nuclei into the pore and had a longer dwell time within the pore compared to ‘fast’ cells (Fig. 3A and B). While traversing the pore the nuclei of ‘slow’ cells often stalled at the pore entrance while they extended protrusions into the pore compared to ‘fast’ cells which underwent a single smooth movement, suggesting that contracting the nuclei into the pore might be rate limiting during transmigration (Fig. 3D and E)
3.3 Nonmuscle myosin II is required for rapid transmigration
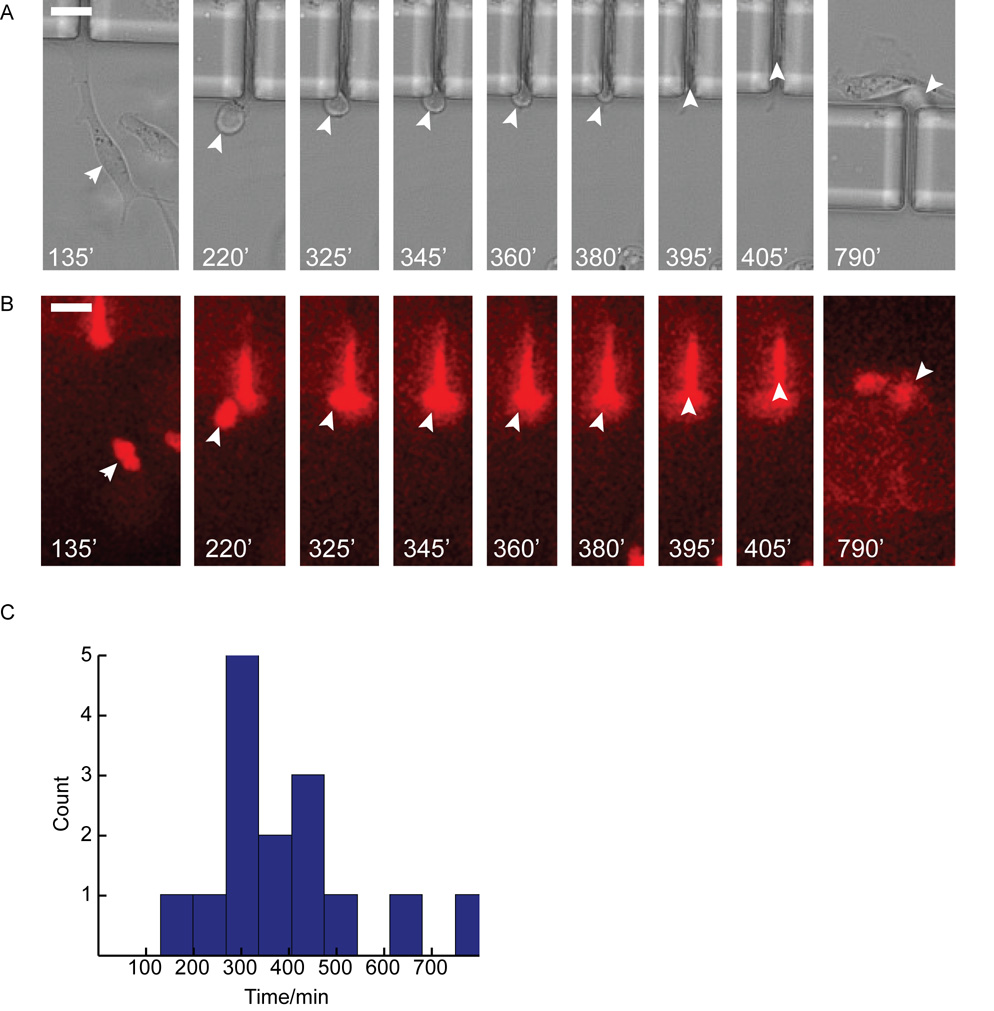
NM-II is the primary protein involved in generating contractile forces within the cell and has been shown to be instrumental in generating traction forces required for the retraction of the trailing edge during integrin-dependent migration and protrusive forces during amoeboid like migration (Ridley et al., 2003;Lammermann and Sixt, 2009). To better understand NM-II’s involvement in transmigration, the effect of inhibiting NM-II motor activity on migration at the different pore sizes was analyzed. Experiments performed with 100 µM blebbistatin in the perfusion media caused the leading edge of cells to change from the standard broad lamellipodia to multiple long string-like projections and caused the typically tapered cell rear to have trailing string-like attachments (Fig. 6A). Blebbistatin treatment also affected how cells were able to migrate, largely eliminating the faster transmigration times seen in control cells (Fig. 6C, Fig. 5C–E). At 50 × 6 µm pores the average transmigration time was 392±173 minutes (n=19) which was comparable to the ‘slow’ pool from the control. This effect can also be seen at 50 × 8 µm pores as well, where the mean transmigration time is also slow, 342±162 minutes (n=21). However at 50 × 12 µm pores; the blebbistatin treated cells migrated faster(159±146 min) than cells at the smaller pore dimensions and had a distribution of transmigration times visually indistinguishable from control cells at pores of the same dimension (Fig. 7).
Fig. 6. Blebbistatin treatment eliminates ‘Fast’ mode of migration through 6 µm pores.
A. Brightfield image sequence of a blebbistatin treated cell migrating through 6 µm pore. Arrows indicate cell body as lamellipodia identify pore (135 min), cell body contraction into pore (220 min – 295 min), cell body within pore (405 min) and cell exit from far side of pore (790 min). Note blebbistatin treatment lengthens both the time of the cell to contract its cell body into the pore as well as translocate its nucleus through the pore. B. Corresponding fluorescent image of A. Cell stained with live cell nuclear dye (draq5). White arrows indicate nucleus. A cell can be seen already occupying the pore as the migratory cell transmigrates through the pore. C. Histogram of nuclear translocation through 6 µm pores for all blebbistatin experiments. Note the lack of a ‘Fast’ mode (≤ 150 min) of translocation compared to control. Scale bars = 20 µm.
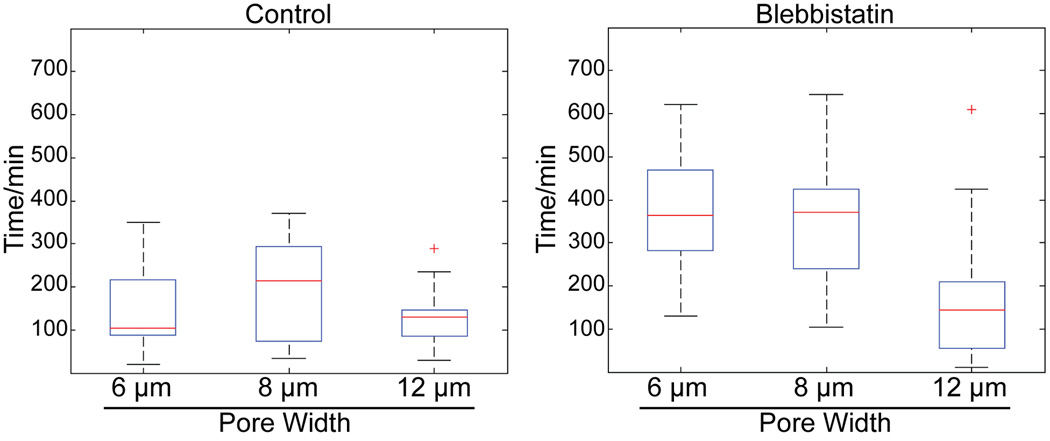
Fig. 7. Nonmuscle myosin-II dependent contraction is important for nuclear translocation through narrow pores.
Boxplots of time for nuclear translocation through 50 µm long pores. Red line is the median, top and bottom of box indicates upper and lower quartile, whiskers indicate the range, and ‘+’ indicate outliers.
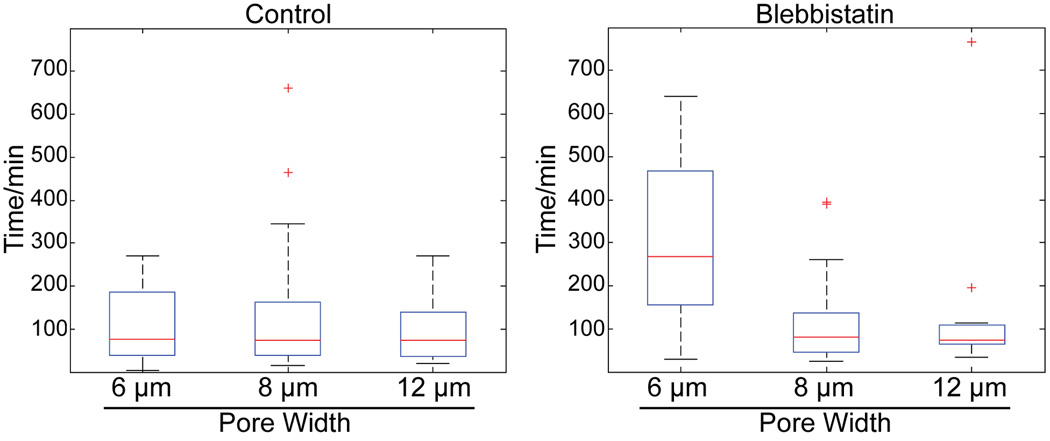
Boxplots of transmigration times ± blebbistatin emphasize that blebbistatin’s inhibitory effect on transmigration is manifest primarily at the smaller pore dimensions (Fig. 7). The role of NM-II in rapid migration is less prominent at shorter pore lengths. At 25 µm pore lengths, blebbistatin treatment only inhibits rapid migration 25 × 6 µm pores, while transmigration rates at 25 × 8 and 25 × 12 were apparently unaffected (Fig 8).
Fig. 8. Nonmuscle myosin-II dependent contraction is important for nuclear translocation through narrow pores.
Boxplots of time for nuclear translocation through 25 µm long pores. Red line is the median, top and bottom of box indicates upper and lower quartile, whiskers indicate the range, and ‘+’ indicate outliers. Distribution of transmigration times at different pore dimensions is indistinguishable under control conditions at 25 µm long pores. Inhibition of NM-II preferentially slows down transmigration times at 25 × 6 µm, however at 25 × 8 µm pores cells are again able to migrate quickly.
4 Discussion
In this work we demonstrate the efficacy of a microfluidic device for high-throughput studies of pore dimension effects on chemotactic transmigration. During in vivo transmigration the cell must squeeze its cell body through a narrow space. This process requires the coordinated contraction of the cell body in addition to the normal propulsive and contractile forces of cell migration. The cell nucleus is the stiffest component of the cell, and therefore a likely rate limitation during transmigration (Hu et al., 2005;Ofek et al., 2009). In fact, previous studies have shown that nuclear kinesis is rate limiting during neuronal cell migration (Schaar and McConnell, 2005). Expanding on that finding, we demonstrate a differential effect of blebbistatin treatment on transmigration times that suggests that NM-II activity is required for nuclear kinesis during rapid transmigration (Fig. 7). Without NM-II activity, cells were unable to rapidly migrate through narrower pores while transmigration times through wider pores were unaffected, indicating that nuclear contraction is a vital step for rapid transmigration. However, the inability of NM-II inhibition to completely inhibit transmigration indicates that there are other NM-II independent mechanisms contributing to transmigration.
During in vivo transmigration across endothelial layers, NM-II most likely serves multiple functions. During migration, NM-II is localized both at the cells leading and trailing edge. NM-II at the leading edge has been indicated in pulling the nucleus forward and in acting at the base of leading edge protrusions differentially contracting some protrusions over others, giving direction to cell migration (Galbraith and Sheetz, 1999;Lo et al., 2004). At the trailing edge, NM-II has been implicated in both disruption of adhesions at the cell rear and generating propulsive forces that push the nucleus forward (Pan et al., 2009).
Although paracrine signaling and chemotaxis are clearly involved in cancer cell intravasation and extravasation, the signaling and mechanical events that mediate this form of transmigration are poorly understood (Condeelis and Pollard, 2006). Metastatic cancer cells almost certainly utilize both integrin-based ‘mesenchymal’ and ‘amoeboid’ like migration mechanisms during this process, transitioning between the two modes as environment dictates (Pankova et al., 2009). Some of the most interesting and unknown aspects of transmigration are what cytoskeletal machinery is involved as the cell penetrates the tissue barrier, protrudes through the barrier, as it retracts its nucleus across the barrier, and how each of these steps is coordinated. The transpore system will facilitate dissecting these processes, and in particular will facilitate dissecting rate-limiting steps in transmigration under conditions that allow resistance to migration to be modulated (via pore dimension) within a single device. The transpore chamber complements the design of previous devices from Irimia et al. (2007) and Saadi et al. (2007) by varying the pore widths and lengths on the same device making it simpler to look at many different conditions during a single experiment. The differential effects of blebbistatin treatment reported here demonstrate that cells have the ability to use multiple mechanisms to achieve transmigration. The results further support the model that moving the nucleus forward is a key rate-limiting step in cancer cell migration through tight spaces, and that NM-II has a critical role in facilitating this movement. This conclusion has relevance not only to vessel penetration, but is likely relevant to cancer cell migration in other settings, such as glioma movements within the brain. Further optimization and refinement of the transpore chamber could allow its use to study migration in a 3D matrix milieu, or to study transmigration of smaller cells such as neutrophils.
5 Conclusion
The high resolution capabilities of the Transpore Chamber provide an ideal in vitro system to study coordination between cellular compartments and cytoskeletal mechanisms during transmigration. This work establishes an ideal pore range for future studies investigating cytoskeletal and focal adhesion dynamics during chemotactic transmigration, or inhibitor studies that target designed to identify potential signaling pathways involved in transmigration.
Supplementary Material
Table 1. NM-II is required for rapid transmigration at narrow pores.
The mean and median times for transmigration events at different pore widths, both in the absence (Control) and presence of blebbistatin (Bleb).
| Mean (min) | Median (min) | |
|---|---|---|
| Control 6 µm (n = 19) | 151 | 105 |
| Control 8 µm (n = 21) | 194 | 215 |
| Control 12 µm (n = 21) | 129 | 130 |
| Bleb 6 µm (n = 15) | 392 | 365 |
| Bleb 8 µm (n = 9) | 342 | 370 |
| Bleb 12 µm (n = 21) | 159 | 145 |
Acknowledgment
The authors thank Wan-Hsiang Liang for help with SEM. The research is supported by a NIH grant (EB006203) to H. Baskaran and a NIH grant (GM077224) to T. Egelhoff.
Reference List
- Abhyankar VV, Lokuta MA, Huttenlocher A, Beebe DJ. Characterization of a membrane-based gradient generator for use in cell-signaling studies. Lab Chip. 2006;6:389–393. doi: 10.1039/b514133h. [DOI] [PubMed] [Google Scholar]
- Atencia J, Morrow J, Locascio LE. The microfluidic palette: a diffusive gradient generator with spatio-temporal control. Lab Chip. 2009;9:2707–2714. doi: 10.1039/b902113b. [DOI] [PubMed] [Google Scholar]
- Beadle C, Assanah MC, Monzo P, Vallee R, Rosenfeld SS, Canoll P. The role of myosin II in glioma invasion of the brain. Mol.Biol.Cell. 2008;19:3357–3368. doi: 10.1091/mbc.E08-03-0319. [DOI] [PMC free article] [PubMed] [Google Scholar]
- Berg HC, Purcell EM. Physics of chemoreception. Biophysical Journal. 1977;20:193–219. doi: 10.1016/S0006-3495(77)85544-6. [DOI] [PMC free article] [PubMed] [Google Scholar]
- Beta C, Frohlich T, Bodeker HU, Bodenschatz E. Chemotaxis in microfluidic devices--a study of flow effects. Lab Chip. 2008;8:1087–1096. doi: 10.1039/b801331d. [DOI] [PubMed] [Google Scholar]
- Bialek W, Setayeshgar S. Physical limits to biochemical signaling. Proc.Natl.Acad.Sci.U.S.A. 2005;102:10040–10045. doi: 10.1073/pnas.0504321102. [DOI] [PMC free article] [PubMed] [Google Scholar]
- Bird RB, Stewart WE, Lightfoot EN. Transport Phenomena. Wiley: 2006. [Google Scholar]
- Bulotta S, Ierardi MV, Maiuolo J, Cattaneo MG, Cerullo A, Vicentini LM, Borgese N. Basal nitric oxide release attenuates cell migration of HeLa and endothelial cells. Biochem.Biophys.Res.Commun. 2009;386:744–749. doi: 10.1016/j.bbrc.2009.06.118. [DOI] [PubMed] [Google Scholar]
- Cai Y, Biais N, Giannone G, Tanase M, Jiang G, Hofman JM, Wiggins CH, Silberzan P, Buguin A, Ladoux B, Sheetz MP. Nonmuscle myosin IIA-dependent force inhibits cell spreading and drives F-actin flow. Biophysical Journal. 2006;91:3907–3920. doi: 10.1529/biophysj.106.084806. [DOI] [PMC free article] [PubMed] [Google Scholar]
- Cheng SY, Heilman S, Wasserman M, Archer S, Shuler ML, Wu M. A hydrogel-based microfluidic device for the studies of directed cell migration. Lab Chip. 2007;7:763–769. doi: 10.1039/b618463d. [DOI] [PubMed] [Google Scholar]
- Condeelis J, Pollard JW. Macrophages: obligate partners for tumor cell migration, invasion, and metastasis. Cell. 2006;124:263–266. doi: 10.1016/j.cell.2006.01.007. [DOI] [PubMed] [Google Scholar]
- Even-Ram S, Doyle AD, Conti MA, Matsumoto K, Adelstein RS, Yamada KM. Myosin IIA regulates cell motility and actomyosin-microtubule crosstalk. Nat.Cell Biol. 2007;9:299–309. doi: 10.1038/ncb1540. [DOI] [PubMed] [Google Scholar]
- Frevert CW, Boggy G, Keenan TM, Folch A. Measurement of cell migration in response to an evolving radial chemokine gradient triggered by a microvalve. Lab Chip. 2006;6:849–856. doi: 10.1039/b515560f. [DOI] [PMC free article] [PubMed] [Google Scholar]
- Friedl P. Prespecification and plasticity: shifting mechanisms of cell migration. Curr.Opin.Cell Biol. 2004;16:14–23. doi: 10.1016/j.ceb.2003.11.001. [DOI] [PubMed] [Google Scholar]
- Galbraith CG, Sheetz MP. Keratocytes pull with similar forces on their dorsal and ventral surfaces. J.Cell Biol. 1999;147:1313–1324. doi: 10.1083/jcb.147.6.1313. [DOI] [PMC free article] [PubMed] [Google Scholar]
- Hu S, Chen J, Butler JP, Wang N. Prestress mediates force propagation into the nucleus. Biochem.Biophys.Res.Commun. 2005;329:423–428. doi: 10.1016/j.bbrc.2005.02.026. [DOI] [PubMed] [Google Scholar]
- Irimia D, Charras G, Agrawal N, Mitchison T, Toner M. Polar stimulation and constrained cell migration in microfluidic channels. Lab Chip. 2007;7:1783–1790. doi: 10.1039/b710524j. [DOI] [PMC free article] [PubMed] [Google Scholar]
- Irimia D, Geba DA, Toner M. Universal microfluidic gradient generator. Anal.Chem. 2006;78:3472–3477. doi: 10.1021/ac0518710. [DOI] [PMC free article] [PubMed] [Google Scholar]
- Jeon NL, Dertinger SKW, Chiu DT, Choi IS, Stroock AD, Whitesides GM. Generation of solution and surface gradients using microfluidic systems. Langmuir. 2000;16:8311–8316. [Google Scholar]
- Lammermann T, Bader BL, Monkley SJ, Worbs T, Wedlich-Soldner R, Hirsch K, Keller M, Forster R, Critchley DR, Fassler R, Sixt M. Rapid leukocyte migration by integrin-independent flowing and squeezing. Nature. 2008;453:51–55. doi: 10.1038/nature06887. [DOI] [PubMed] [Google Scholar]
- Lammermann T, Sixt M. Mechanical modes of 'amoeboid' cell migration. Curr.Opin.Cell Biol. 2009;21:636–644. doi: 10.1016/j.ceb.2009.05.003. [DOI] [PubMed] [Google Scholar]
- Li JN, Baskaran H, Dertinger SK, Whitesides GM, Van de WL, Toner M. Neutrophil chemotaxis in linear and complex gradients of interleukin-8 formed in a microfabricated device. Nat.Biotechnol. 2002;20:826–830. doi: 10.1038/nbt712. [DOI] [PubMed] [Google Scholar]
- Li ZH, Bresnick AR. The S100A4 metastasis factor regulates cellular motility via a direct interaction with myosin-IIA. Cancer Res. 2006;66:5173–5180. doi: 10.1158/0008-5472.CAN-05-3087. [DOI] [PubMed] [Google Scholar]
- Liu Z, van Grunsven LA, Van Rossen E, Schroyen B, Timmermans JP, Geerts A, Reynaert H. Blebbistatin inhibits contraction and accelerates migration in mouse hepatic stellate cells. Br.J.Pharmacol. 2009 doi: 10.1111/j.1476-5381.2009.00477.x. [DOI] [PMC free article] [PubMed] [Google Scholar]
- Lo CM, Buxton DB, Chua GC, Dembo M, Adelstein RS, Wang YL. Nonmuscle myosin IIb is involved in the guidance of fibroblast migration. Mol.Biol.Cell. 2004;15:982–989. doi: 10.1091/mbc.E03-06-0359. [DOI] [PMC free article] [PubMed] [Google Scholar]
- Mishima Y, Lotz M. Chemotaxis of human articular chondrocytes and mesenchymal stem cells. J.Orthop.Res. 2008;26:1407–1412. doi: 10.1002/jor.20668. [DOI] [PubMed] [Google Scholar]
- Ofek G, Natoli RM, Athanasiou KA. In situ mechanical properties of the chondrocyte cytoplasm and nucleus. J.Biomech. 2009;42:873–877. doi: 10.1016/j.jbiomech.2009.01.024. [DOI] [PMC free article] [PubMed] [Google Scholar]
- Pan Z, Ghosh K, Liu Y, Clark RA, Rafailovich MH. Traction stresses and translational distortion of the nucleus during fibroblast migration on a physiologically relevant ECM mimic. Biophysical Journal. 2009;96:4286–4298. doi: 10.1016/j.bpj.2009.02.039. [DOI] [PMC free article] [PubMed] [Google Scholar]
- Pankova K, Rosel D, Novotny M, Brabek J. The molecular mechanisms of transition between mesenchymal and amoeboid invasiveness in tumor cells. Cell Mol.Life Sci. 2009 doi: 10.1007/s00018-009-0132-1. [DOI] [PMC free article] [PubMed] [Google Scholar]
- Ridley AJ, Schwartz MA, Burridge K, Firtel RA, Ginsberg MH, Borisy G, Parsons JT, Horwitz AR. Cell migration: integrating signals from front to back. Science. 2003;302:1704–1709. doi: 10.1126/science.1092053. [DOI] [PubMed] [Google Scholar]
- Rowe RG, Weiss SJ. Breaching the basement membrane: who, when and how? Trends Cell Biol. 2008;18:560–574. doi: 10.1016/j.tcb.2008.08.007. [DOI] [PubMed] [Google Scholar]
- Saadi W, Rhee SW, Lin F, Vahidi B, Chung BG, Jeon NL. Generation of stable concentration gradients in 2D and 3D environments using a microfluidic ladder chamber. Biomed.Microdevices. 2007;9:627–635. doi: 10.1007/s10544-007-9051-9. [DOI] [PubMed] [Google Scholar]
- Saadi W, Wang SJ, Lin F, Jeon NL. A parallel-gradient microfluidic chamber for quantitative analysis of breast cancer cell chemotaxis. Biomed.Microdevices. 2006;8:109–118. doi: 10.1007/s10544-006-7706-6. [DOI] [PubMed] [Google Scholar]
- Schaar BT, McConnell SK. Cytoskeletal coordination during neuronal migration. Proc.Natl.Acad.Sci.U.S.A. 2005;102:13652–13657. doi: 10.1073/pnas.0506008102. [DOI] [PMC free article] [PubMed] [Google Scholar]
- Shaw LM. Tumor cell invasion assays. Methods Mol.Biol. 2005;294:97–105. doi: 10.1385/1-59259-860-9:097. [DOI] [PubMed] [Google Scholar]
- Sherwood DR. Cell invasion through basement membranes: an anchor of understanding. Trends Cell Biol. 2006;16:250–256. doi: 10.1016/j.tcb.2006.03.004. [DOI] [PubMed] [Google Scholar]
- Walker GM, Sai J, Richmond A, Stremler M, Chung CY, Wikswo JP. Effects of flow and diffusion on chemotaxis studies in a microfabricated gradient generator. Lab Chip. 2005;5:611–618. doi: 10.1039/b417245k. [DOI] [PMC free article] [PubMed] [Google Scholar]
- Wolf K, Muller R, Borgmann S, Brocker EB, Friedl P. Amoeboid shape change and contact guidance: T-lymphocyte crawling through fibrillar collagen is independent of matrix remodeling by MMPs and other proteases. Blood. 2003;102:3262–3269. doi: 10.1182/blood-2002-12-3791. [DOI] [PubMed] [Google Scholar]
- Wong AP, Perez-Castillejos R, Christopher LJ, Whitesides GM. Partitioning microfluidic channels with hydrogel to construct tunable 3-D cellular microenvironments. Biomaterials. 2008;29:1853–1861. doi: 10.1016/j.biomaterials.2007.12.044. [DOI] [PMC free article] [PubMed] [Google Scholar]
- Wu H, Huang B, Zare RN. Generation of complex, static solution gradients in microfluidic channels. J.Am.Chem.Soc. 2006;128:4194–4195. doi: 10.1021/ja058530o. [DOI] [PubMed] [Google Scholar]
Associated Data
This section collects any data citations, data availability statements, or supplementary materials included in this article.


