Abstract
Mammalian cells take up nanoparticles (NPs) and some NPs increase ROS. We use imaging and measure ROS in parallel to evaluate NP-cell interactions with type I-like alveolar epithelial cells exposed to NPs at 1.2 µg/cm2 . Titanium dioxide (Ti02), gold (Au), silver (Ag), and manganese (Mn) were internalized by R3-1 cells; copper (Cu) NPs were observed at the cell surface only. TiO2 and Au did not increase cell death but Mn and Cu did, with surviving cells recovering after initial Cu exposure. Ag NPs caused 80% of R3-1 cells to lift off the slides within one hour. Amplex Red was used to report H2O2 production after exposure to 0.4 µg/cm2 TiO2, Au, Cu, Mn and Ag. TiO2, Au, and Ag caused no significant increase in H2O2 while Cu and Mn increased H2O2. NPs that give up electrons, increase ROS production and cause cell death in R3-1 cells.
1. Introduction
NPs of many types are increasingly being used for diverse purposes. Titanium dioxide (TiO2) NPs, for example, are used in making paint and in sun block lotion/spray; Gold (Au) NPs are tested for delivery of genes, drugs and vaccines [1] and also as an x-ray contrast agent [2]; Silver (Ag) NPs are used in photography, as bactericidal agents [3] and becoming more widespread in medical related applications; and Manganese (Mn) NPs and other paramagnetic NPs have been suggested for use as contrast agents in magnetic resonance imaging [4]. There are an increasing number of engineered NPs being made, as well as those produced as by-products of manufacture of other goods. A characteristic that makes NP very useful in new applications is their size. The nanometer size often makes their chemistry, physical and functional properties quite different from those of the same element in solution or of the same element in much larger particles. These unusual properties may render NPs toxic to living cells and organisms.
Some NPs have been reported to generate production of reactive oxygen species (ROS) in cells and ROS production and cellular uptake of NPs are active areas of investigation. ROS are produced in all living cells, the majority at specific locations in the mitochondrial electron transport chain (ETC), such as complexes I and III and some agents such as Ca2+ have been reported to increase ROS production [5, 6]. NP uptake into mammalian cells and mitochondria has been documented [7–9] and we are interested in visualizing how metal and metal oxide NPs in the size range between 20 and 50 nm enter cells and in what time frame. Did the NPs show similar distribution within cells and was the mode of entry similar? We were also interested in the characteristics of NPs that produce ROS in cells. Did the same NPs produce ROS in cell free media or do the cells drive the ROS production? We hypothesized that the presence of certain NPs would increase cellular ROS from two distinct sources. The first ROS source, as mentioned above, is the mitochondrial ETC and the second ROS source is oxidation of NPs, inducing the NPs to give up electrons. The evidence indicates that in the case of Cu and Mn the later process is dominant. Further, the ROS production by Cu and Mn NPs correlates with increased cell morphology related to cell death in R3-1 cells.
We have studied NPs of low cyto toxicity (Au {~20 nm} and TiO2 {~25 nm}), NPs which are more reactive (Mn {~40 nm} and Cu {~40 and ~60 nm}) [9], and a NP that is known to kill bacteria (Ag {~39 nm}) [10]. The determination of NP concentration and cell exposure time for these studies was based on preliminary tests of R3-1 cell tolerance as well as having a sufficient NP concentration to allow particle visualization by transmission electron microscopy (TEM).
Concentrations of NPs were lower for ROS measurements. A common route of exposure to NPs is via the respiratory tract, ~95% of the alveolar epithelium is comprised of type I cells but studies to date have generally not focused on the entry and localisation of NPs inside this cell type. In order to understand NP-cell interactions in the lung our studies were all conducted in R3-1 cells, which are type I alveolar epithelial cells [11]. The goals of this study are to determine the period of time it takes NPs to get into R3-1 cells, to determine which NPs localize to mitochondria or other cell organelles, and to determine if the presence of NPs in the cell increases ROS.
2. Materials and Methods
2.1 Cell Culture
R3-1 cells were cultured in F-12 media (Invitrogen) supplemented with 10% FBS and penicillin/streptomycin at 37°C in 5% CO2.
2.1.1 Visualization of cell nuclei
HOECHST 33342, a cell membrane permeant, minor groove-binding blue fluorescent DNA stain was used to label live R3-1 cells. Triplicate random fields of view (FOV) were chosen, counting 100 cells per FOV and differentiating normal vs. condensed nuclei. The triplicate FOV were averaged for each sample total to get % condensed nuclei observed.
2.2 Isolation of mitochondria
Rat liver mitochondria were prepared as described in Wingrove and Gunter 1986 [12].
2.3 NPs and Dosing
Cells were dosed when 80% confluent with: TiO2 ~25 nm, from Degussa, Düsseldorf Germany; Mn and Mn oxide (Mn2+ and Mn3+) ~ 40 nm, generated from manganese rods in the PALAS spark generator URMC, Rochester NY; Au ~20 nm, Colloid from BBI International, Lakewood CA; Ag suspension ~39 nm from Applied Nanoscience, Carlsbad, CA; Cu ~40 nm and ~60 nm from Nanotechnologies, Austin TX. Dosing of all particles was based on mass of particles per available surface area on growth dishes (1.2 µg/cm2 is ~3–6 µg/ml in cell media depending on the dish size for TEM studies and 0.4 µg/cm2 is ~1 ug/ml in cell media in T-25 flasks for the Amplex Red assay).
2.3.1 Generation of Mn oxide
We generated Mn oxide particles via electric arc discharge (Palas GmbH, Karlsruhe, Germany) in an argon-filled chamber between two opposing Mn rods (purity 99.95%; Electronic Space Products International, Ashland OR). Oxygen was introduced into the generator (20mL/min) to ensure the formation of metal oxide mixture. Electron-energy loss spectroscopy results indicate of the oxidized Mn; ~60% is Mn2+ and ~40% is Mn3+.
2.3.2 Sonication Protocol (cell culture experiments)
Each type of NP was sonicated as a stock solution at 200 µg/ml in media with no FBS for 10 minutes, pulse at 50% duty (~10 watts/pulse) with a Branson Sonifier Model200 probe sonicator, Danbury, CT. Immediately after sonication, FBS was added to the sonicated solution at 10% of volume. The stock solution was diluted as required into a full set of media for the entire experiment set and then NP media was applied to the cell monolayer. Cells were incubated at 37°C with 5% CO2 in NP media for the planned experiment.
2.3.3 Sonication Protocol (H2O2 production experiments)
Each type of NP was sonicated as a stock solution at 100 µg/ml in distilled water for 10 minutes, pulse at 50% duty (~10 watts/pulse) with a Branson Sonifier Model200 probe sonicator, Danbury, CT. The stock solution was diluted with PBS and then PBS containing NPs was applied to cell monolayer. Cells were kept at 37°C, with PBS containing NPs.
2.4 Transmission Electron Microscopy (TEM) and Elemental Analysis (EDS)
R3-1 cells were plated on chamber slides and grown to 70–80% conflucency. The cells were exposed to NPs in their culture media at 37°C. The culture media was removed at timed intervals and replaced with 0.1M sodium phosphate buffered 2.5% glutaraldehyde for fixation overnight at 4°C. The slides were rinsed in 2 changes of 0.1M sodium phosphate buffer, post-fixed in 1.0% osmium tetroxide (same buffer), dehydrated through a graded series of ethanol to 100%, transitioned into propylene oxide and infiltrated with Spurr epoxy resin overnight. The next day size 3 BEEM capsules were filled with fresh Spurr resin and inverted and placed over the cells on the slides. The slides were polymerized overnight at 70°C and the next day were dipped several times in liquid nitrogen to break the surface tension between the glass and the polymerized epoxy capsules until the capsules “popped off” the glass slide. The capsules with the entrapped cells were trimmed to an area with the most cells for thin sectioning with a diamond knife. The sections were placed onto 200 mesh carbon coated copper grids and were not stained with heavy metals to prevent contamination with stain precipitates. The grids were examined using the URMC EM Core Facility’s Hitachi 7100 and an analytical Hitachi 7650 transmission electron microscope with an attached Electron Dispersive X-Ray Spectrometer (EDS) for elemental analysis. A subset of grids were examined at the University of Minnesota’s Institute of Technology and Mechanical Engineering’s Characterization Facility using a FEI Technai G2/F30 Field Emission Transmission Electron Microscope with an attached EDS (EDX) at 300kv for elemental detection of “suspect” NPs within mitochondria.
2.5 Measurement of H2O2 production in R3-1 cells
R3-1 cells were grown to 80% confluency in T-25 flasks, growth media removed and cells rinsed with PBS then 20.587 ml of fresh PBS was added to each flask as well as 63 µl of 1 mM amplex red (in DMSO), 140 µl of 100 units/ml horse radish peroxidase (HRP)in water and 210 µl of 100 µg/ml PBS NP sonicated stock solution. Three ml samples were placed in a cuvette with the excitation and emission settings: EX: 566nm, EM:587nm. Measurements were carried out in a Photon Technology International (PTI) spectrometer by exciting amplex red and reading its emission. The cuvette was kept at 37°C during measurements. Samples of the PBS/AMPLEX RED/HRP solution were taken from each flask at 0,2,5,10,15 and 20 min time points preliminarily, reported data is from the 20-minute time point.
3. Results
3.1 Uptake and Effects of NPs
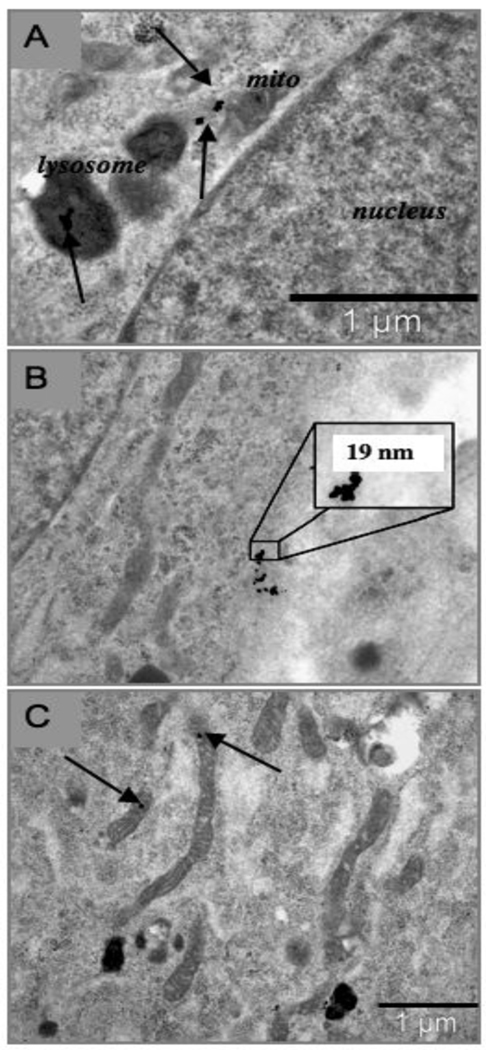
Of the metal/metal oxide NPs studied, all except Cu NPs entered R3-1 cells and are seen in the cytoplasm as well as in large numbers in lysosomes within minutes to hours of exposure. Ag NPs were widely distributed throughout the R3-1 cells within minutes.
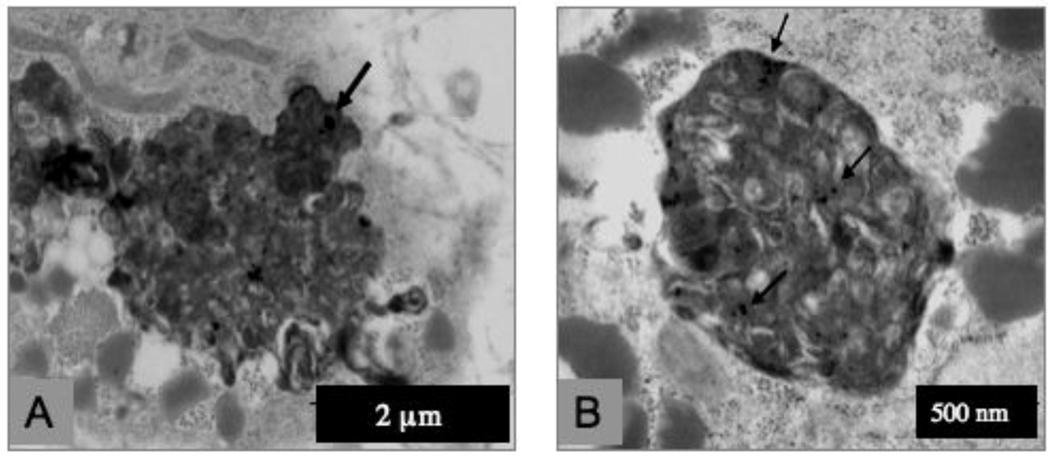
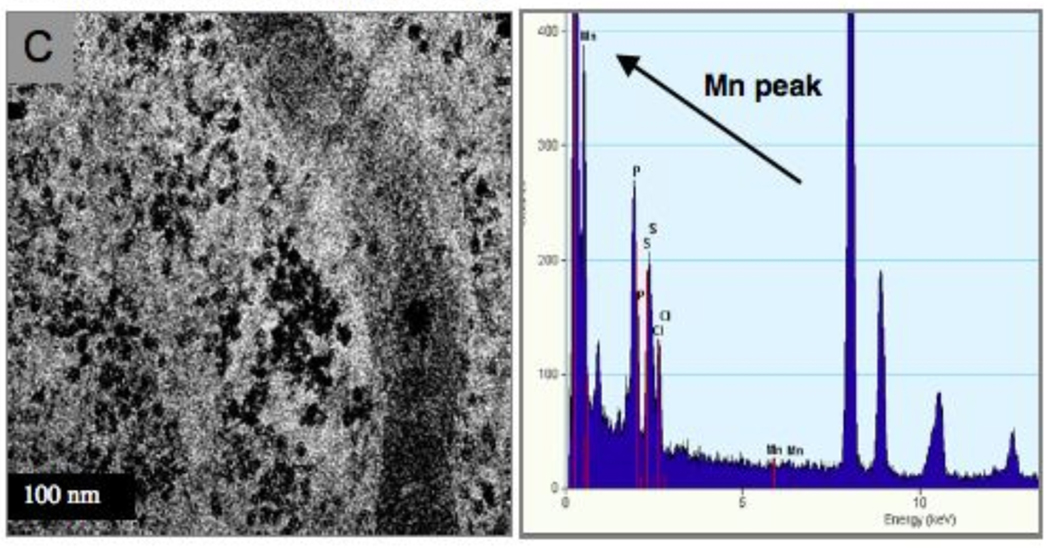
The result of exposure of R3-1 cells to 1.2 µg/cm2 (~4 µg/ml) PALAS-generated (see materials and methods) Mn oxide NPs of approximately 40 nm average diameter were mainly localized to lysosomes in R3-1 cells. Panels A and B of figure 1 display uptake of Mn NPs into lysosomes resulting in hyper activated lysosomes, termed heterolysosomes in 48 hours. Panel C of figure 1 shows an occasional Mn particle present inside a mitochondrion. The elemental content of one particular NP was verified by electron dispersive X-ray spectrometry (EDS - see materials and methods).
Figure 1. R3-1 cells treated with 1.2 ug/cm2 PALAS Mn oxide (~40nm) for 48 hours.
(A) and (B) show activated lysosomes in different R3-1 cells. Arrows indicate Mn particles. (C) High resolution of a mitochondrion with Mn particle (bar bottom left = 100 nm). 43.3 Mn particle - verified by EDX (at bottom right) at the University of Minnesota, School of Engineering.
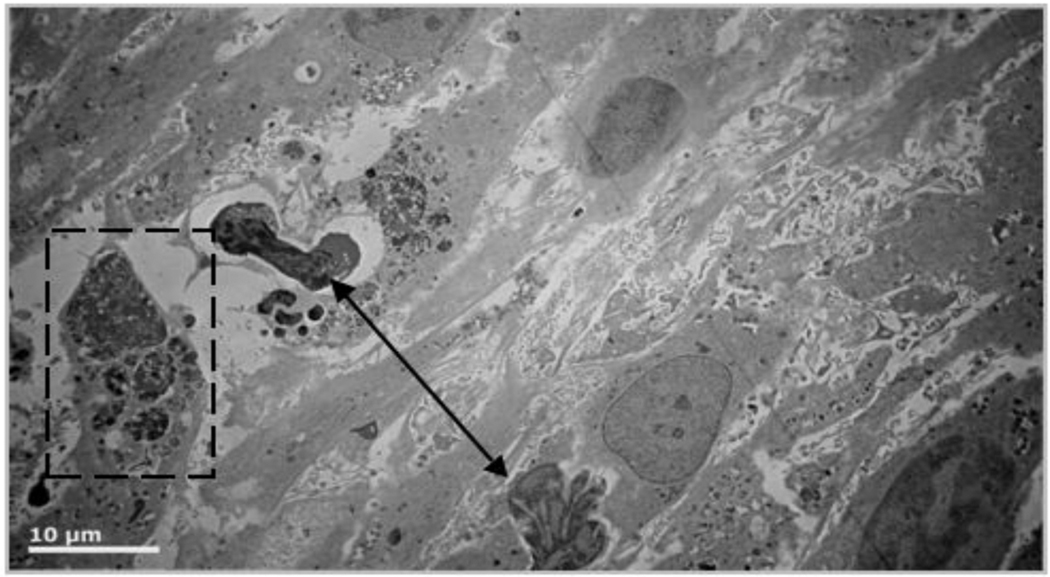
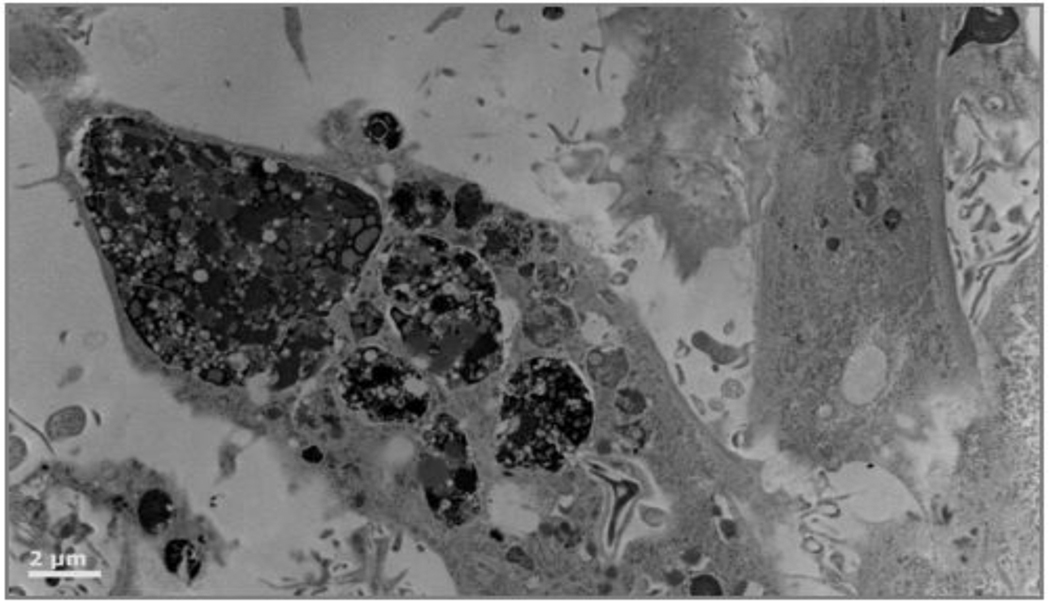
At 72 hours, more than 50% of the cells show morphological signs of cell death such as heterochromatin condensation, distorted nuclei, and whole cell condensation. A sample field of view is shown in figure 2.
Figure 2.
R3-1 cells exposed to 1.2 µg/cm2 PALAS Mn ~40nm for 72 hours. Double arrow above indicates apoptotic nuclei in 2 cells in field; white line = 10 µm Below - higher magnification (white bar = 2µm) shows cell in dashed box from above full of hyperactivated lysosomes.
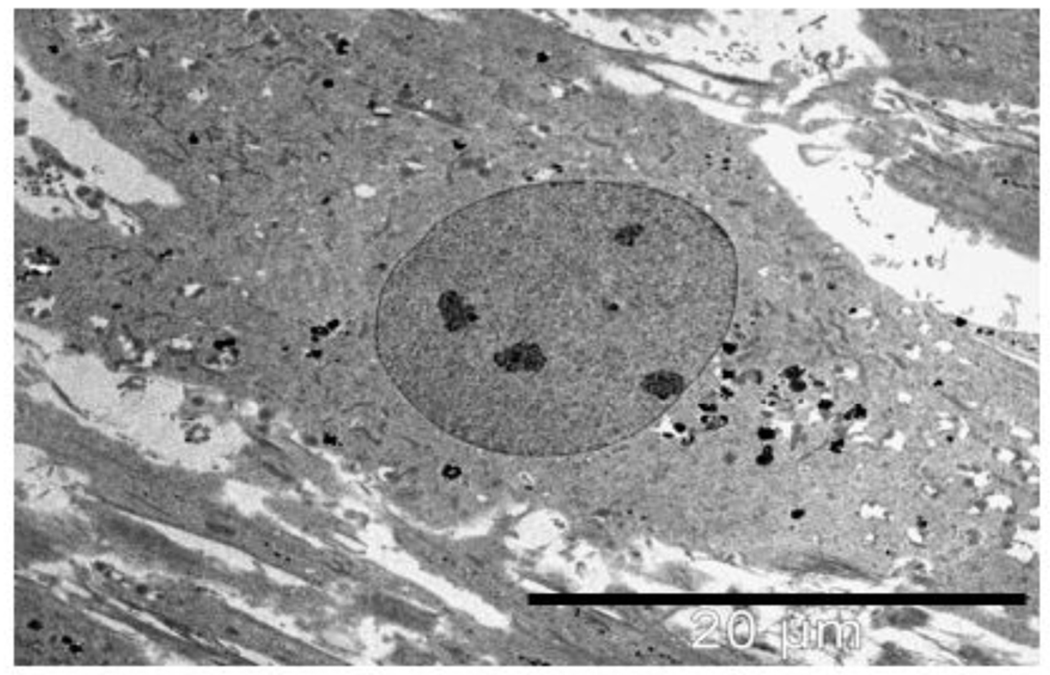
Results after 24–72 hours exposure to 1.2 µg/cm2 20 nm Au NPs are shown in figure 3 and figure 4. The Au particles are electron dense and found singly and as agglomerates in the cytosol, lysosomes and mitochondria, of exposed R3-1 cells. Panels A and B demonstrate particle distribution throughout the cytoplasm and in lysosomes, while panel C shows Au NPs in mitochondria. The Au particles, inside the R3-1 cells, were verified using EDS. Lack of cellular response to longer incubations (72 hours) with Au is shown in figure 4. The R3-1 cells thrive in the presence of Au NPs with no visible cell death even when cultured for several days. The representative R3-1 cell shown in figure 4 gives no evidence of activation of lysosomes although the cell has taken up many Au NPs. There is no indication of chromatin condensation or any other cell morphology related to apoptosis after Au exposure.
Figure 3. R3-1 cells treated with 1.2 ug/cm2 20 nm Au particles for 24–48 hours.
Au verified by EDS.
(A) 24 hours - Arrows indicate Au particles in a lysosome and free in the cytosol in close proximity to a mitochondrion; black line = 1 µm.
(B) 48 hours - magnified view of Au agglomerate free in the cytosol. Diameter across one Au particle shown.
(C) 48 hours - Arrows indicate Au particles in mitochondria; black line = 1 µm.
Figure 4. R3-1 cell treated with 1.2 ug/cm2 20 nm Au for 72 hours.
Black particles seen throughout cell cytosol, Au verified by EDS; black line = 20 µm.
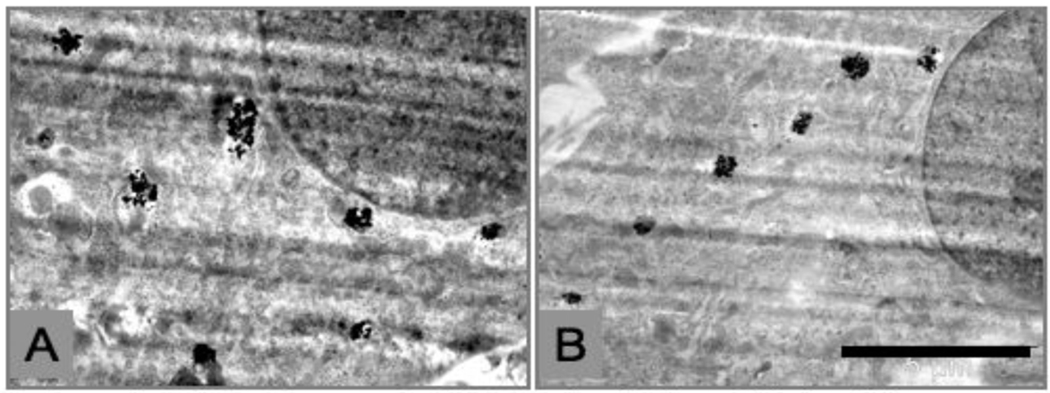
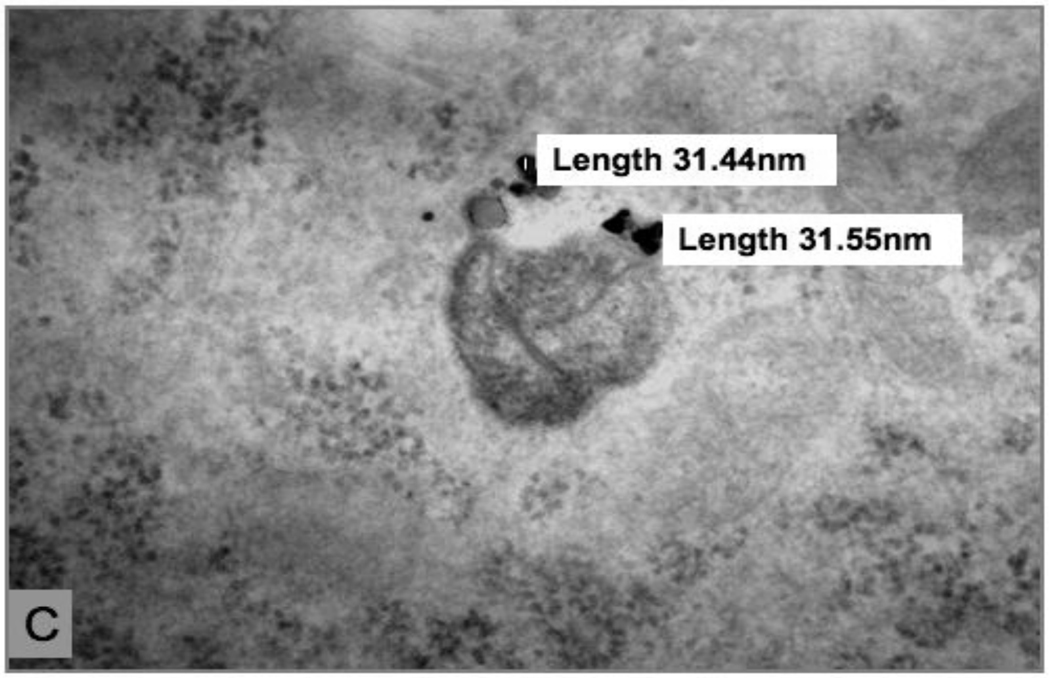
After 24-hour exposure to 1.2 µg/cm2 25 nm TiO2 NPs, R3-1 cells appear very similar to the Au treated cells. Panels A and B of figure 5 show particle agglomerates both in the cytoplasm and in lysosomes, while Panel C shows a TiO2 NP inside a mitochondrion. As with the Au NPs, the TiO2 NPs are found numerously and as agglomerates within these cells.
Figure 5. R3-1 cells treated with 1.2 ug/cm2 25 nm Ti02 for 24 hours.
(A) and (B) two different cells at 24 hours; black line (B) = 5 µm. (C) Ti02 particles agglomerate inside a cross section of a mitochondrion. Individual particle measurements shown. TiO2 verified by EDS.
Note: TiO2 causes furrows in the diamond knife, producing the striations seen in images above.
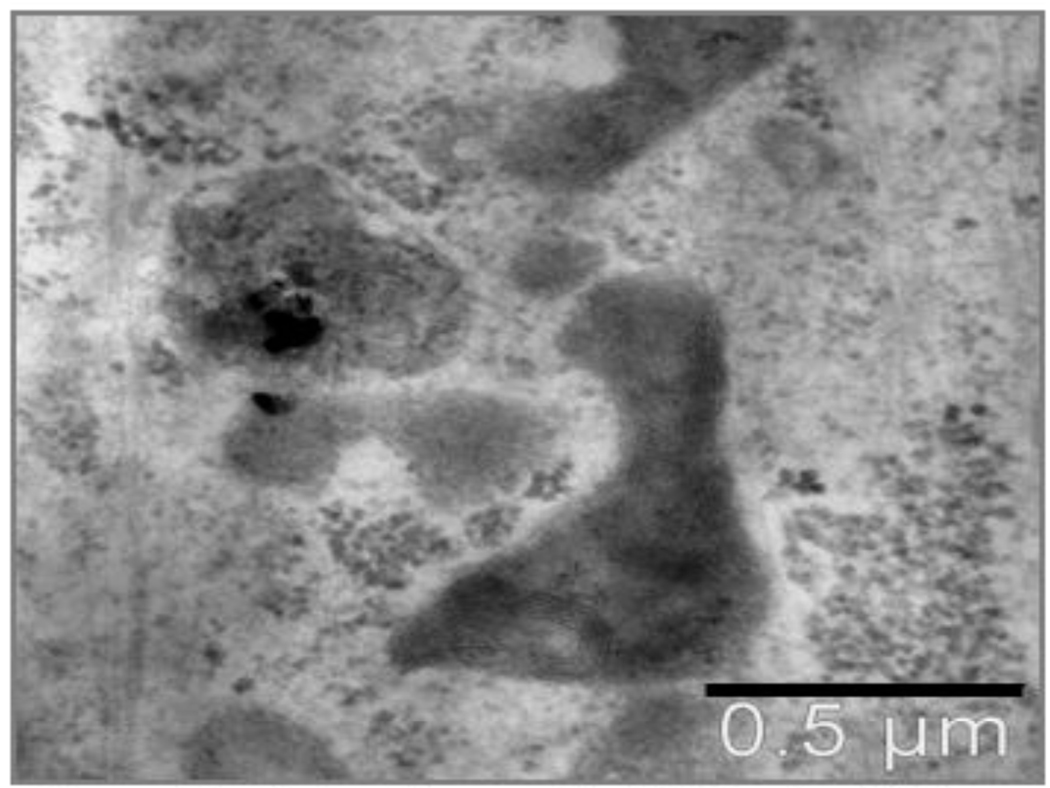
The results of exposure of R3-1 cells to TiO2 NPs for 48 hours are shown in figure 6. Lysosomes display little to mild activation and there is no indication of chromatin condensation or other cell morphology related to apoptosis at any time point, similar to the R3-1 cell response to 20 nm Au particle exposure. The TiO2 particles were verified in these R3-1 cells using EDS.
Figure 6. R3-1 cells treated with 1.2 ug/cm2 25 nm Ti02 for 48 hours.
Lysosome containing particles is mildly activated compared to others in view. TiO2 verified by EDS; black line = 0.5 µm.
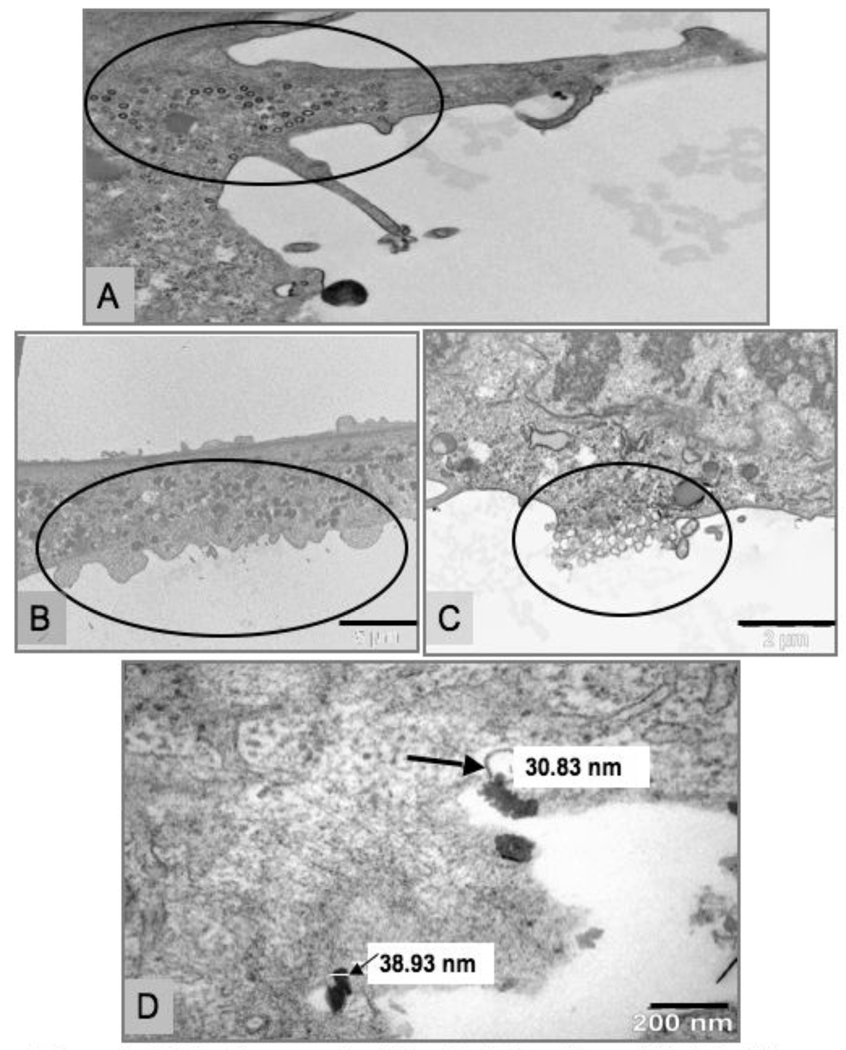
The R3-1 cells respond to 1.2 µg/cm2 40 nm Cu NPs quite differently. We have observed that Cu NPs disappear from the culture media within hours (data not shown) due to dissolution. They are non-detectable by TEM inside the cells even just minutes after exposure, in contrast to Au, TiO2, and Mn NPs which can easily be detected as single particles and agglomerates within hours up to several days. On occasion, small numbers of Cu NPs can be detected outside, between, or at the surface of R3-1 cells at very short time points (minutes) as seen in panel D of figure 7. Interestingly, Cu NPs disappeared more rapidly in cellular suspensions than they do in media alone.
Figure 7. R3-1 cells exposed to 1.2 µg/cm2 Cu ~40 nm.
(A), (B), (C) 3 min - vesicle formation & plasma membrane blebbing/rupture circled. (D) 5 min - Cu at plasma membrane, large arrow shows measurement at tip inside a vesicle, small arrow/white line - measurement across particle; black line (B) = 5 µm, (C) = 2 µm and (D) = 200 nm.
Also on display in figure 7, R3-1 cells exposed to Cu NPs rapidly degenerate at the cell surface, exhibiting small cytoplasmic vesicle formation (see panel A, figure 7) and blebbing/rupture of the plasma membrane (panels B and C, figure 7) within minutes of Cu exposure. When Cu NPs were dissolved in media for 48 hours prior to exposure no cellular damage was observed as shown in table 1.
Table 1.
Cu40 TEM
| Particle Type |
Exposure Time |
Visible Particles |
Nuclei (TEM) |
Dead Cells |
|---|---|---|---|---|
| Fresh Cu 40 | 1 hours | suspect | normal | none |
| Fresh Cu 40 | 3 hours | none | apoptotic | yes |
| Fresh Cu 40 | 6 hours | none | apoptotic | yes |
| Fresh Cu 40 | 12 hours | none | apoptotic | yes |
| Dissolved Cu 40 | 1 hours | none | normal | none |
| Dissolved Cu 40 | 3 hours | none | normal | none |
| Dissolved Cu 40 | 6 hours | none | normal | none |
| Dissolved Cu 40 | 12 hours | none | normal | none |
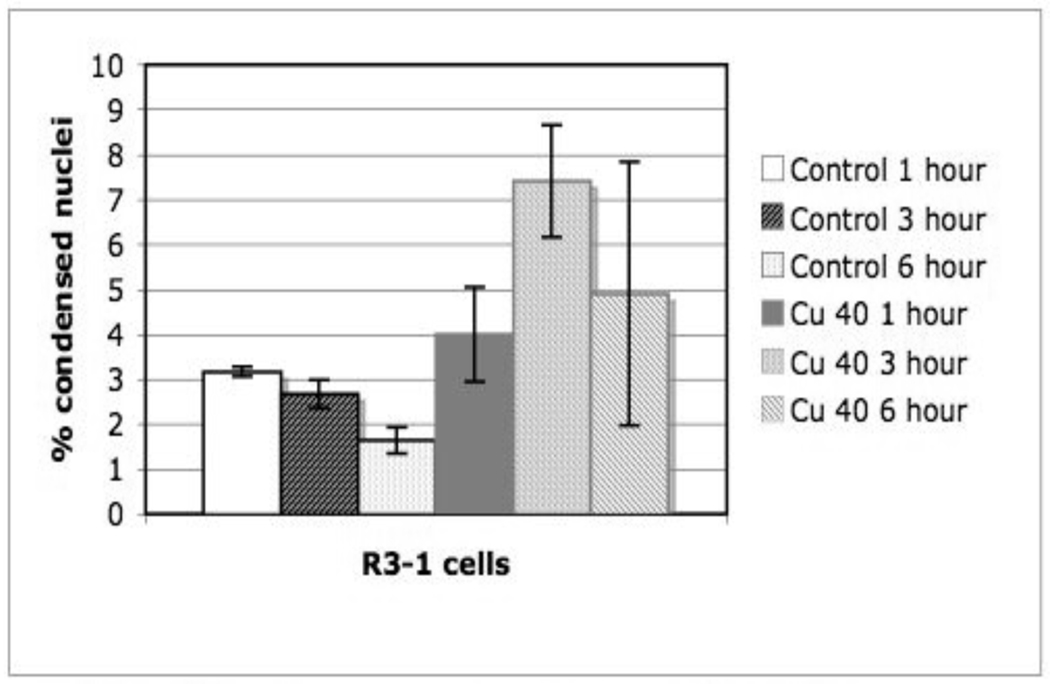
R3-1 cells in media were exposed to fresh Cu NPs and moderate activation of lysosomes was observed along with the appearance of unaffected mitochondria in the cytoplasm. More than 50% of these cells died within 24 hours of Cu exposure; figure 8 shows an increase in condensed nuclei by 3 hours post Cu exposure.
Figure 8. R3-1 cells exposed to 1.2 µg/cm2 Cu ~40 nm.
Nuclei visualized with HOECHST 33342.
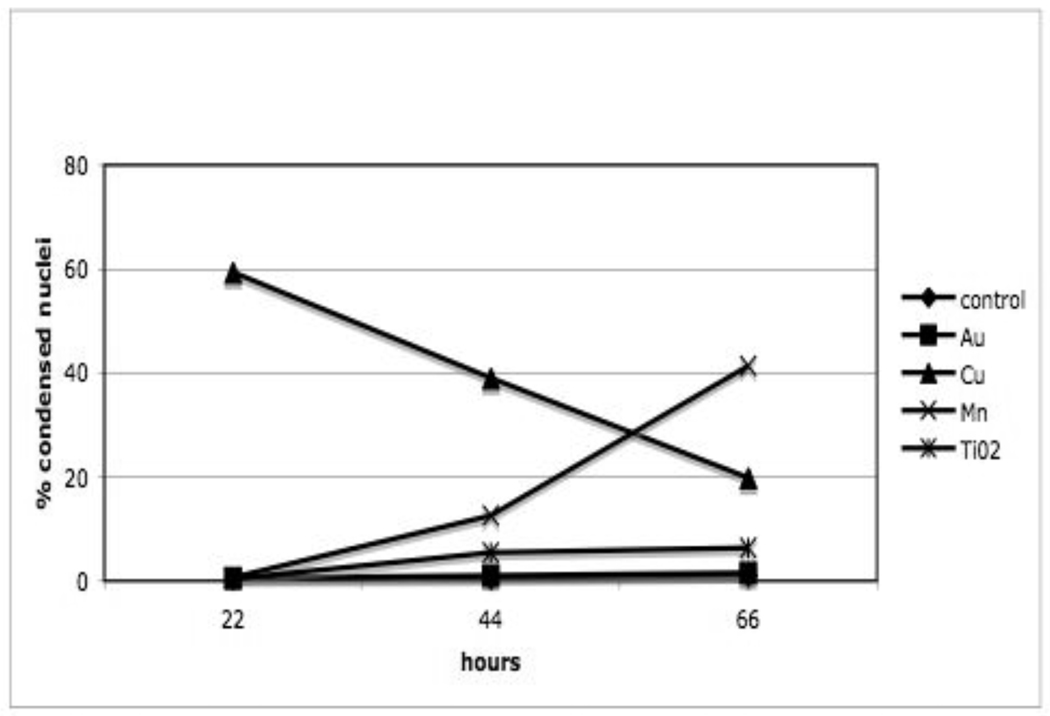
By 44 hours, the cell preparations recovered from the Cu NP exposure and began to proliferate. These “recovered” cells appeared to have normal nuclei, shown in figure 9.
Figure 9. R3-1 cells exposed to various nanoparticles @ 1.2 µg/cm2.
Nuclei visualized with HOECHST 33342.
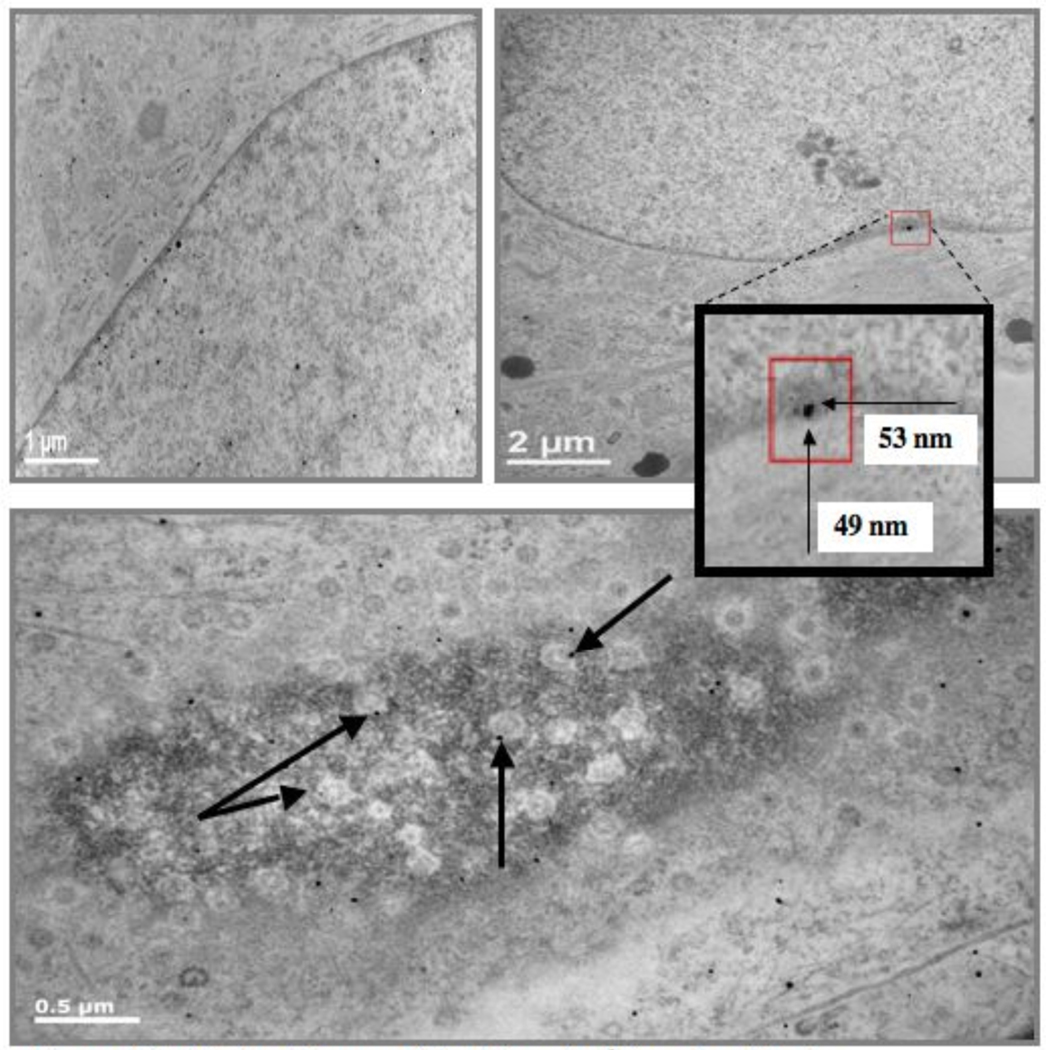
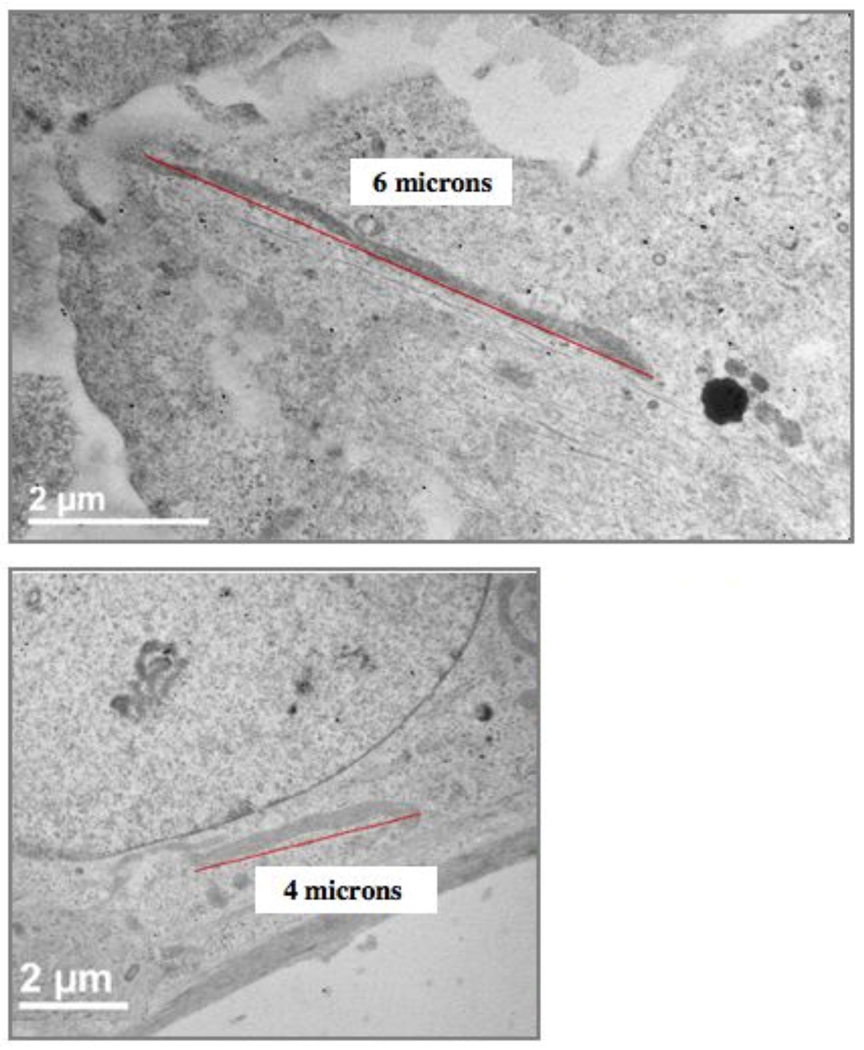
R3-1 cells were also exposed to 1.2 µg/cm2 Ag NPs. Observations were made at 12, 20 and 30 minutes after exposure because the cells became detached and were not visible on the slides after one hour of Ag exposure. Electron dense particles (less than 20 nm) were evenly distributed as individual particles inside the R3-1 cells, which were observed in filipodia, the cytosol, mitochondria and the cell nucleus. Figure 10 shows Ag particles in the cytosol, in the nucleus and in the nuclear membrane 30 minutes after Ag exposure. Numerous elongated mitochondria were also observed in many R3-1 cells 30 minutes after Ag exposure, as represented in figure 11.
Figure 10. R3-1 cells exposed to 1.2 µg/cm2 Ag after 30 min.
Top Left: Ag seen in cytosol and nucleus; white line = 1 µm.
Top Right: Smallest square shows an electron dense particle in the nuclear membrane. Larger squares: Dense particle in smallest box magnified, it is an agglomerate of two particles, too large for nuclear pore of less than ~39 nm; white line =2 µm.
Bottom: Tangential section through nuclear membrane to obtain view of nuclear pores. Arrows indicate electron dense particles inside nuclear pores; white line = 0.5 µm.
Figure 11.
Two examples of R3-1 cells containing elogated mitochondria after 30 minute exposure to 1.2 µg/cm2 Ag. White boxes indicate mitochondrial length. White lines (left corners) = 2 µm.
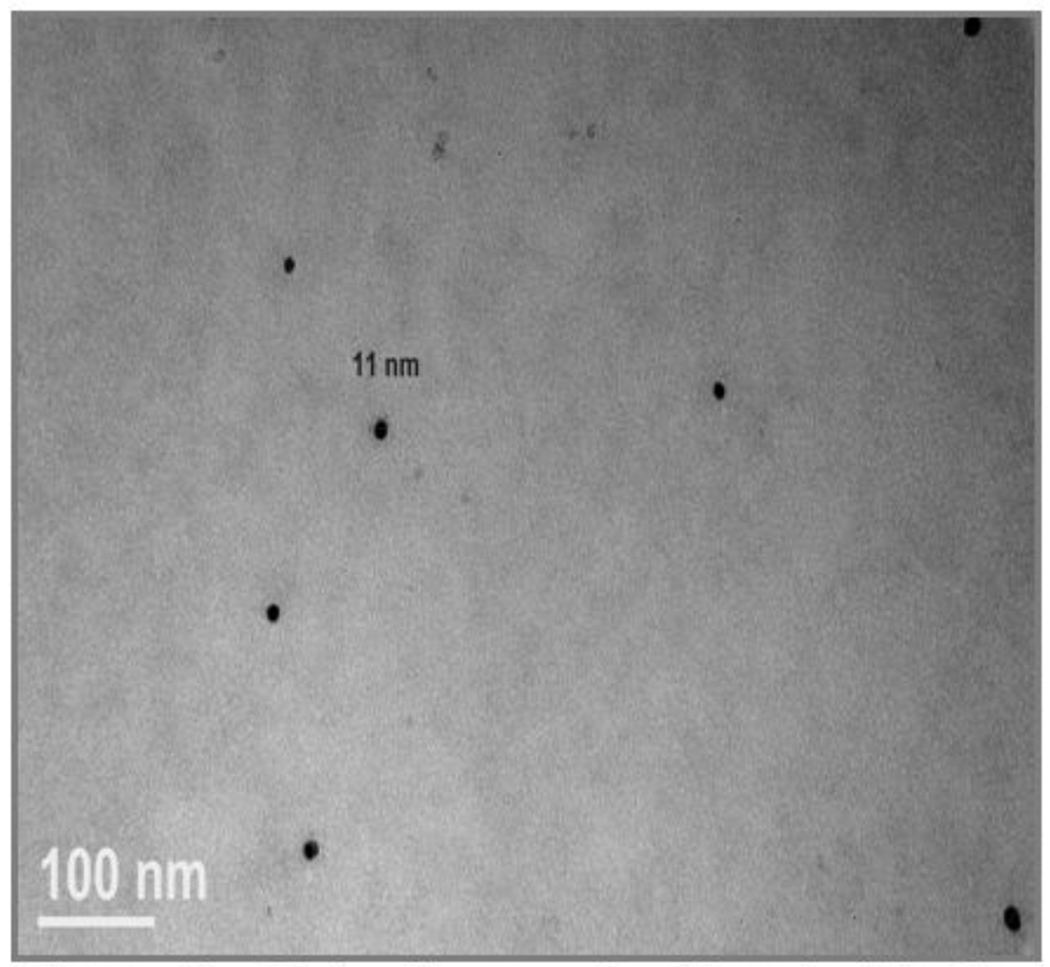
The Ag particles were significantly smaller than the documented average size of ~40 nm (see figure 12). We could not confirm the silver content of the particles with EDS due to poor sensitivity (individual particles too small and non-agglomerated). However, the cells were treated only with Ag and the electron dense particles have the appearance expected of Ag NPs in comparison to TEM grids with the same Ag particles applied in cell media (no cells) after sonication. The Ag particles in cell media alone were aggregated on the TEM grids and range in size from the small size observed inside the R3-1 cells (9–18 nm) up to 60–70 nm, which were not observed at 12, 20 or 30 minutes inside or outside the R3-1 cells by TEM.
Figure 12. R3-1 cells exposed to 1.2 µg/cm2 Ag for 20 minutes.
Magnification of cytoplasm of two R3-1 cells. Singlets shown in each panel. White line (left corner) = 100 nm.
3.2 ROS Production
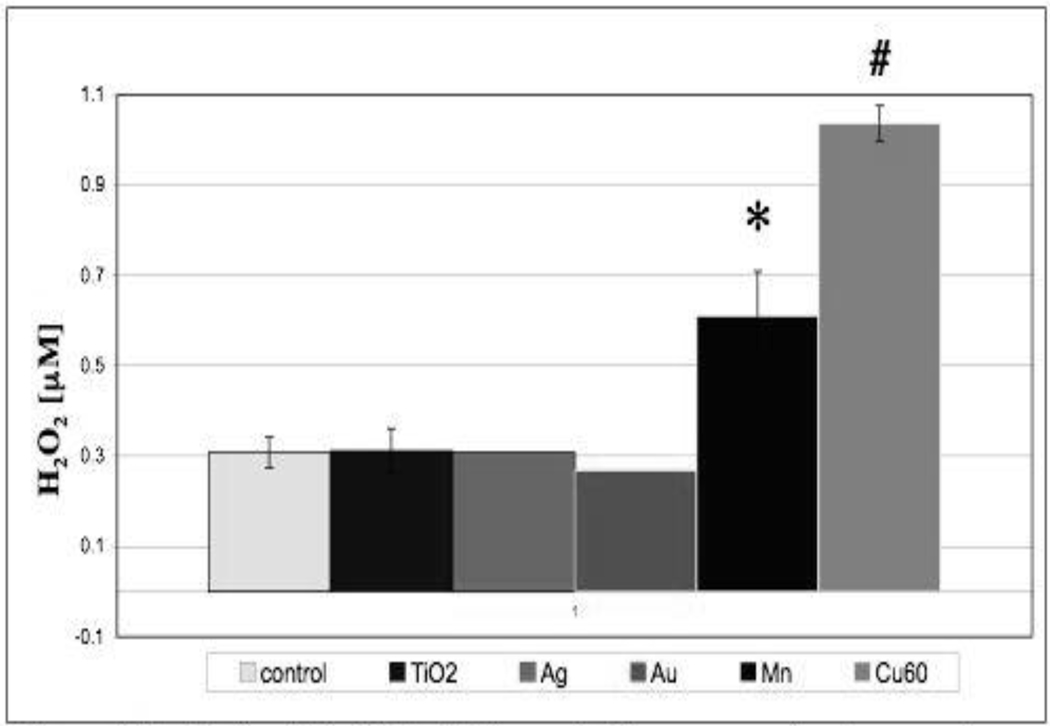
Production of reactive oxygen species (ROS) in R3-1 cells following exposure to the NPs discussed previously was measured using the Amplex Red assay (see figure 13). The concentration of the NPs was lower than that used previously for our TEM studies. The figure 13 graph represents separate experiments all done in triplicate for most NPs. This assay primarily measures H2O2. The advantage of measuring H2O2 is that it is membrane permeable while super oxide, the initial product of the mitochondrial electron transport chain and other producers of ROS, are not. Super oxide is converted to H2O2 by super oxide dismutase (SOD) inside the mitochondria (MnSOD) and also in the cytoplasm (Cu, Zn SOD). The results shown in figure 13 demonstrate that there is no increase in H2O2 production over control after exposure of R3-1 cells to 0.4 µg/cm2 Au, TiO2, or Ag NPs. There is a statistically significant increase in H2O2 production in R3-1 cells exposed to 0.4 µg/cm2 Mn NPs. It has been demonstrated clearly that when the cells are exposed to Au, TiO2, or Mn NPs, the NPs enter the cells and are found in the cytoplasm and in organelles. Therefore, mitochondria in R3-1 cells are directly exposed to these NPs. Preliminary tests exposing isolated liver mitochondria to the same NPs in suspension media show H2O2 production trends similar to those seen in R3-1 cells. There is no increase in H2O2 production by exposure of isolated mitochondria to either Au or TiO2 NPs; however, there is a significant increase in H2O2 production when mitochondria alone are exposed to Mn NPs (data not shown).
Figure 13. R3-1 cells in PBS, H2O2 production measured using amplex red over 20 min while cells were exposed to various nanoparticles at 0.4 ug/cm2.
Control, and Mn are n=4; Cu60 and TiO2 n=3; Ag and Au n=1. p values based on student T test are:
* p = less than 0.006 and # p= less than 0.0001.
H2O2 production in R3-1 cells is increased even more in the presence of 0.4 µg/cm2 Cu NPs (figure 13); however, the characteristics differ from those observed with Mn NPs. In the Cu case, there is a greater rate of production of H2O2 early in the exposure period in the same time range that the NPs are dissolving. This H2O2 production can be seen in media alone in the absence of either R3-1 cells or mitochondria; however, the H2O2 production is greater in the presence of the R3-1 cells. We have associated this ROS production with the following redox equations:
| (1) |
| (2) |
| (3) |
These equations indicate that oxidation of Cu(s) to Cu2+ is energetically favorable along with a coupled production of H2O2 from O2 and H+ ions [13].
4. Discussion
Au, TiO2 and Mn NPs are readily taken up by R3-1 cells in a matter of hours. In each case, the NPs are found both as agglomerates and as single particles in lysosomes, the cell cytoplasm, and occasionally a NP is found inside a mitochondrion. The Cu NPs, on the other hand, are not found inside the cell cytoplasm or in the lysosomal compartment. Very likely, this is because the Cu NPs dissolve rapidly over the time frame of the uptake experiments. Finding a large percentage of the Au, TiO2 and Mn NPs inside lysosomes suggests that these NPs get into the cellular endosomal system, since late endosomes are thought to merge with the lysosomal system [14]. In the case of uptake of Au and TiO2 NPs, there is no indication that the NPs get into the cytoplasm by rupturing the lysosomes, since the lysosomes generally have a non-active appearance. Heterolysosomes, as defined morphologically, are activated by uptake of Mn NPs; nevertheless, the distribution of the Mn NPs is very similar to that seen with Au and TiO2 NPs, suggesting a common mechanism of entry into lysosomes.
Ag NPs appear to enter the cells by a different yet undefined mechanism. They are evenly dispersed widely throughout R3-1 cells in a matter of minutes, appearing in the nucleus in as little as 12 minutes. Interestingly, the particles that get in are small compared to the primary particle size and are smaller than the functional diameter of the nuclear pore complex of ~39 nm. Our sonication method does not change the particle size based on observations of the same Ag particles on TEM grids after sonication with no cells present. This may indicate that only very small Ag particles get into the R3-1 cells and that the smaller Ag NPs rapidly traverse membranes. It might also suggest that Ag dissolution in cell media and in the presence of the cell membranes contributes to the reduction in particle size even at short times (12–30 minutes). The presence of the tiny particles in the nucleus may contribute in some yet undescribed way to the rapid and very potent cell death caused by Ag NPs. Greater than 80% of the R3-1 cells detach from the slides within one hour of Ag exposure.
All of the NP types, except Cu, are occasionally found in mitochondria. They appear not to be restricted to the mitochondrial intermembrane space, but also to be found inside the matrix. While the literature contains suggestions of transfer of components between endosomes and mitochondria [15], the NPs should have been found in the mitochondrial intermembrane space if this process had occurred. Furthermore, it is likely that many more NPs would be found in mitochondria since large numbers of NPs are transferred to lysosomes. Mitochondria are dynamic structures, moving within the cell while undergoing fusion and fission [5, 16, 17]. Based on our observations, we suggest it more likely that NPs are occasionally seen inside mitochondria because they were on the edge of a mitochondrion just before it fused to another, thus trapping the NP inside the resultant fused structure.
The mitochondrial electron transport chain is the largest source of ROS in mammalian cells, with most being produced as super oxide at complexes I and III [5]. The super oxide is converted to H2O2 by intramitochondrial Mn super oxide dismutase. Mitochondrial uptake of Ca2+ has been reported to increase ROS production; however, several possible mechanisms for this have been proposed and the exact mechanism by which it occurs is not apparent [5]. We have found that both Mn2+ and Mn NPs increase ROS production by mitochondria. Mn2+ generally binds to Ca2+ binding sites with an affinity greater than that of Ca2+ [18], so it may be that the increased ROS observed after Mn2+ uptake by mitochondria represents an effect similar to that seen with Ca2+. However, almost all of the Mn NPs are outside the mitochondria and the mechanism by which this increases ROS production is not clear. One possibility is that Mn ions leach from the particles over time increasing local Mn concentrations and the soluble Mn contributes to the damage and death observed in cells which have sequestered Mn NPs.
While Au, TiO2, and Mn NPs were all found inside lysosomes after uptake by the cell, only the Mn NPs led to the appearance of heterolysosomes. This is likely to be an effect distinct from that of the NPs on the mitochondria. It is possible that this is caused by H2O2 production inside the lysosome due to Mn NP dissolution enhanced by the acidity of the lysosome [19]. While Mn NPs did not dissolve rapidly in normal cell media, the acidic environment of the lysosome drives production of H2O2 according to equations for Mn similar to those shown previously for Cu in equation 3:
| (4) |
This would contribute to an intracellular ROS increase. Similar equations for Ag and Au yield significant positive changes of free energy, making the production of H2O2 by oxidation of Au and Ag NPs energetically unfavorable, even at low pH [13].
H2O2 production by Mn NPs in our experiments was significantly greater than the increase caused by dissolved Mn2+acting at the mitochondrial level; however, any dissolved Mn2+ released from lysosomes could be sequestered by mitochondria and contribute in an independent way to the total ROS produced in or near the mitochondria. This is important because ROS production in or near mitochondria has been shown to increase the probability of induction of the mitochondrial permeability transition (MPT) and this has been shown to induce apoptosis [20]. Clearly shown in figure 2 is an increase in condensed, distorted nuclei, and R3-1 cell condensation, all morphological signs of apoptotic cell death. After 72 hours PALAS Mn exposure it is likely there is high localized Mn concentration in the cytoplasm that may be in close proximity to mitochondria due to dissolving Mn NPs which would promote apoptosis via the MPT.
The process occurring with the Cu NPs was consistent with previous observations by our lab that the presence of cells (R3-1 cells, HL60 cells, or red blood cell ghosts) increases the rate of H2O2 production (data not shown). It is believed that the concentration of O2 is around 3 fold higher [21] in the membranes of cells than in the media bathing them (i.e. O2 partitions into the membrane phase); however, it is lower in mitochondrial membranes due to oxidative phosphorylation. Dissolution of Cu particles causes alkalinization of the medium coupling H2O2 production with oxidation (data not shown). Furthermore, experimentally the addition of 80 units of Mn super oxide dismutase (MnSOD) which would convert super oxide to H2O2 does not increase the observed signal in our Amplex Red tests (data not shown), suggesting the observed ROS were already in the H2O2 form and were not formed by conversion of super oxide. These observations support the hypothesis that oxidation of Cu and any Cu+, which may be present in the NP, and dissolution of the NPs work together to drive the consumption of protons and direct formation of H2O2.
Our use of H2O2 specific Amplex Red indicates that H2O2 production was not increased in R3-1 cells exposed to Ag NPs. Other investigators have shown that Ag increases ROS production using DCF-DA [22]. The type of Ag used (pure silver versus silver with carbon coating), the concentration of Ag, the cell type specificities, and the assay being used to measure ROS (DCF-DA versus Amplex Red) could all contribute to these observed inconsistencies in ROS production.
There are many possible ways in which NPs and other toxicants damage cells. We have focused these studies on cell morphology effects of NPs paired with redox reactions as summarized in table 2.
Table 2.
Data Summary
| NP (type) |
size (~nm) |
solubility in cell media |
particle uptake in R3-1 |
localisation in R3-1 |
ROS increase |
cell death evidence |
|---|---|---|---|---|---|---|
| TiO2 | 25 |
not very soluble |
yes |
cytoplasm mitochondrion lysosomes |
no | none |
| Au | 20 |
not very soluble |
yes |
cytoplasm mitochondrion lysosomes |
no | none |
| Ag | 39 |
may be soluble inside cells |
yes |
filipodia cytoplasm mitochondria nucleus |
no |
80% of cells lift off slides |
| Mn | 40 |
soluble inside lysosomes |
yes |
cytoplasm mitochondrion lysosomes |
yes |
condensed nuclei condensed cells |
| Cu | 40 |
very soluble |
no | cell surface | yes |
cell surface damage 60% of cells lift off plates initially |
| Cu | 60 |
very soluble |
not tested |
not tested | yes |
50% of cells lift off plates condensed nuclei (HOECHST data not shown) |
We have found that where the free energy change for giving up electrons is negative, NPs containing oxidizable components, such as neutral Cu, Cu+, or neutral Mn, can be induced to give up electrons and form ROS. In the case of Cu, which dissolves readily, it is likely that the Cu NPs, which can have different shapes and therefore many ways of associating with the cell surface, are more easily oxidized when interacting with the cell because the cell membrane contains higher O2 concentration than the medium. Rapid dissolution of the particles while passing electrons from Cu on to O2 produces a high rate of H2O2 production through which the cell exterior is damaged. This seems to be what causes initial cell death upon Cu NP exposure (60% by 22 hours shown in figure 9). The lack of morphological damage to the cell interior is likely due to the fact that the Cu NPs dissolve so rapidly that they are not effectively transported as particles into the cell interior. Mn, on the other hand, dissolves much more slowly and like Au, TiO2, and Ag, is found in lysosomes. With time, and exposure to the acidic lumen of the lysosome, heterolysosomes are observed at 48 hours, followed by the morphological evidence of cell death observed at 72 hours post Mn. In addition, dissolved Mn2+, sequestered by mitochondria, like Ca2+, then increase ROS production by the mitochondrial ETC. This could contribute to long-term damage to mitochondria and the observed changes in cell morphology associated with apoptosis. Au, TiO2, and Ag NPs exposed cells do not show morphology as evidence of redox-induced cell death.
Cu and Mn NP entry, localization and effect on cellular ROS production correlate with cellular time-of-death in exposed R3-1 cells. Mn increases ROS, dissolution occurs in lysosomes and Mn NPs cause R3-1 cell death over a period of days whereas Cu increases ROS, dissolution is rapid at the cell surface, cell death is observed within hours and then the surviving R3-1 cells recover over time. Future studies are required related to Cu exposure and upregulation of antioxidants or other pro-survival mechanisms allowing some cells to adapt. Ag particles rapidly enter these cells and cause immediate R3-1 cell detachment without significantly increasing H2O2 production in these experimental conditions. Still other particles like Au and TiO2 do not dissolve, accumulate inside the cells and do not cause the R3-1 cells to die. We have used cell death as an end point in these studies in order to make sense of localization and entry into this particular cell model. As observed by others previously [23], it is important to relate uptake and ROS production findings with each particular NP type and to consider that in vivo NP concentration may not be sufficient for cell death but in the absence of death, the passage of NPs, or ions derived from NPs, through this cell type may be key to entry into the circulation and beyond after inhalation exposure.
Acknowledgements
Special thanks for the R3-1 cells provided by Dr Erik Rushton in the Finkelstein lab, URMC. We wish to thank Ms. Gayle Schneider and Mr. Ian Spinelli for technical support in the URMC Electron Microscope Research Core. We also wish to thank Mr. Bob Gelein and Mrs. Pamela Mercer at URMC for technical support, information about and preparation of all NPs. Parts of this work were carried out at the Minnesota Characterization Facility that receives support from the NSF through the NNIN program. The work was supported by funding from DoD MURI FA9550-04-1-0430 (G.O), NIH RO1 ES10041 and DoD MHRP W81 XWH-05-1-0239 (T.E.G.), NIH RO1 CA134218 (A.E.), and with partial support through NIEHS Center Grant P30ES01247.
References
- 1.Paciotti GF, et al. Colloidal gold: a novel NP vector for tumor directed drug delivery. Drug delivery. 2004;11:169–183. doi: 10.1080/10717540490433895. [DOI] [PubMed] [Google Scholar]
- 2.Hainfeld JF, et al. Gold NPs: a new X-ray contrast agent. British Journal of Radiology. 2007;79:248–253. doi: 10.1259/bjr/13169882. [DOI] [PubMed] [Google Scholar]
- 3.Ji JH, et al. Twenty-eight day inhalation study of silver NPs in Sprague-Dawley rats. Inhalation Toxicology. 2007;19:857–871. doi: 10.1080/08958370701432108. [DOI] [PubMed] [Google Scholar]
- 4.Arbab AS, Liu W, Frank JA. Cellular magnetic resonance imaging: current status and future prospects. Expert Review of Medical Devices. 2006;3:427–439. doi: 10.1586/17434440.3.4.427. [DOI] [PubMed] [Google Scholar]
- 5.Brookes PS, et al. Calcium, ATP, and ROS: a mitochondrial love-hate triangle. Amer. Journ. of Physiol. 2004;287:C817–C833. doi: 10.1152/ajpcell.00139.2004. [DOI] [PubMed] [Google Scholar]
- 6.Turrens JF. Mitochondrial formation of reactive oxygen species. J. Physiol. 2003;552:335–344. doi: 10.1113/jphysiol.2003.049478. [DOI] [PMC free article] [PubMed] [Google Scholar]
- 7.Li N, et al. Ultrafine particulate pollutants induce oxidative stress and mitochondrial damage. Environmental Health Perspectives. 2003;111(4):455–460. doi: 10.1289/ehp.6000. [DOI] [PMC free article] [PubMed] [Google Scholar]
- 8.Hussain SM, et al. The interaction of manganese NPs with PC-12 cells induces oapamine depletion. Toxicol. Sciences. 2006;92(2):456–463. doi: 10.1093/toxsci/kfl020. [DOI] [PubMed] [Google Scholar]
- 9.Limbach LK, et al. Exposure of engineered NPs to human lung epithelial cells: influence of chemical composition and catalytic activity on oxidative stress. Environmental Science and Technology. 2007;41:4158–4163. doi: 10.1021/es062629t. [DOI] [PubMed] [Google Scholar]
- 10.Alt V, et al. An in vitro assessment of the antibacterial properties and cytotoxicity of nanoparticulate silver bone cement. Biomaterials. 2004;25:4383–4391. doi: 10.1016/j.biomaterials.2003.10.078. [DOI] [PubMed] [Google Scholar]
- 11.Koslowski RBK, Augstein A, Tschering T, Bargsten G, Aufderheide M, et al. A new rat typeI-like alveolar epithelial cell line R3/1: blemycin effects on caveolin expression. Histochemistry and Cell Biology. 2004;121(6):509–519. doi: 10.1007/s00418-004-0662-4. [DOI] [PubMed] [Google Scholar]
- 12.Wingrove DE, Amatruda JM, Gunter TE. Glucagon effects on the membrane potential and calcium uptake rate of rat liver mitochondria. J. Biol. Chem. 1984;259:9390–9394. [PubMed] [Google Scholar]
- 13.Weast RC, editor. Handbook of Chemistry and Physics. 52nd ed. Cleveland, OH: The Chemical Rubber Company; 1971. pp. D111–D113. [Google Scholar]
- 14.Johnson ALJ, Roberts K, Raff M. Molecular Biology of the Cell. 5 ed. Routledge; 2007. p. 1268. [Google Scholar]
- 15.Sheftel AD, et al. Direct interorganellar transfer of iron from endosome to mitochondrione. Blood. 2007;110(1):125–132. doi: 10.1182/blood-2007-01-068148. [DOI] [PubMed] [Google Scholar]
- 16.Bleazard W, et al. The dynamin-related GTPase Dnm 1 regulates mitochondrial fission in yeast. Nat. Cell Biol. 1999;1:298–304. doi: 10.1038/13014. [DOI] [PMC free article] [PubMed] [Google Scholar]
- 17.Chen H, et al. Mitofusins Mfn1 and Mfn2 coordinately regulate mitochondrial fusion and are essential for embryonic development. J. Cell Biol. 2003;160:189–200. doi: 10.1083/jcb.200211046. [DOI] [PMC free article] [PubMed] [Google Scholar]
- 18.Gunter TE, et al. Speciation of manganese in cells and mitochondria: A search for the proximal cause of manganese neurotoxicity. NeuroToxicology. 2006;27:765–776. doi: 10.1016/j.neuro.2006.05.002. [DOI] [PubMed] [Google Scholar]
- 19.Elder AOG, OG Translocation and effects of ultrafine particles outside of the lung. Clin Occup Environ Med. 2006;5(4):785–796. doi: 10.1016/j.coem.2006.07.003. [DOI] [PubMed] [Google Scholar]
- 20.Kroemer G, et al. Mitochondrial control of apoptosis. Immunol. Today. 1997;18:44–51. doi: 10.1016/s0167-5699(97)80014-x. [DOI] [PubMed] [Google Scholar]
- 21.Moller MN, LQ, Lancaster JR, Jr, Denicola A. Acceleration of nitric oxide autoxidation and nitrosation by membranes. IUBMB Life. 2007 Apr–May;59(4–5):243–248. doi: 10.1080/15216540701311147. [DOI] [PubMed] [Google Scholar]
- 22.Carlson C, HSM, et al. Unique Cellular Interaction of Silver NPs: Size-Dependent Generation of Reactive Oxygen Species. J. Phys. Chem. B. 2008;112:13608–13619. doi: 10.1021/jp712087m. [DOI] [PubMed] [Google Scholar]
- 23.Shukla A, Gulumian M, Hei TK, Kamp D, Rahman Q, Mossman BT. Multiple Roles of Oxidants in the Pathogenesis of Abestos-Induced Diseases. Free Radical Biology & Medicine. 2003;Vol.34(No. 9):1117–1129. doi: 10.1016/s0891-5849(03)00060-1. [DOI] [PubMed] [Google Scholar]


