

Abstract
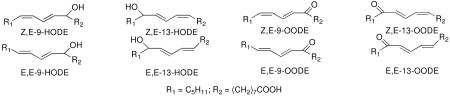
The primary products from peroxidation of linoleate in biological tissues and fluids are the hydroperoxy octadecadienoates and the products normally assayed, after reduction of the hydroperoxides, are the corresponding hydroxy octadecadienoates (HODEs). The HODEs are found in tissues and fluids as a mixture of Z,E and E,E stereoisomers. Two regioisomeric sets of Z,E and E,E stereoisomers are normally observed with substitution at the 9 and 13 position of the 18-carbon chain. The Z,E/E,E product ratio has proved to be a useful means for assessing the reducing capacity of the medium undergoing peroxidation. The HODE Z,E/E,E product ratios previously reported for tissues such as liver and brain vary from 0.5 to 2.0 and plasma ratios are somewhat higher, between 2.0 and 3.0. The reported literature protocols for HODE assay in tissues involve homogenization, reduction with sodium borohydride in the presence of BHT, and ester hydrolysis with KOH to give the free HODEs. This is followed by either reverse-phase HPLC of the free acid HODEs or by conversion to TMS derivatives and GC/MS. When sodium borohydride is replaced in the protocol by triphenylphosphine, a gentler reducing agent, HODE Z,E/E,E product ratios are much higher and lower total HODEs levels of are found. It is proposed that inclusion of sodium borohydride in the isolation procedures leads to ex vivo reactions that are avoided if triphenylphosphine is used as the reducing agent. Modified protocols for HODE analyses (Tissue and Plasma Methods #2) are described that should be used for assays of tissues and fluids.
Keywords: Peroxidation, Linoleate, HODEs, HODE stereoisomers
The analysis of lipid peroxidation products derived from plants and animals subjected to oxidative stress has received increased attention over the past two decades (1-4). The formation of malondialdehyde, detected by the product it forms with thiobarbituric acid (TBA), was used as early as the 1940s to infer peroxidation of polyunsaturated lipids (5-12). Malondialdehyde is formed by peroxidation of unsaturated fatty acids containing three or more double bonds, presumably by decomposition of intermediate endoperoxides (13-15). Thus, malondialdehyde essentially serves as a marker for peroxidation of ω-6 arachidonate and the ω-3 lipids eicosapentaenoic (EPA) and docosahexaenoic acid (DHA). More recently, the isoprostanes (IsoPs), oxidation products of arachidonic acid, have been used as biomarkers of lipid peroxidation since the F2-IsoPs appear to be reasonably stable end products of arachidonic acid and ester oxidation and they can be analyzed routinely by GC/MS methods (16-20). Analogous products, the neuroprostanes, are formed from docosahexaenoic acid, an ω-3 lipid.
Lipid peroxidation gives a complex set of products and in recent years the peroxidation products of linoleic acid and linoleate esters have also been suggested as potentially useful biomarkers since linoleate is usually present at substantially higher levels than arachidonate, EPA and DHA in human fluids and tissues. The linoleate peroxidation products, hydroxyoctadecadienoates (HODEs), can be readily detected in tissue and fluids of control rodents and animals suffering from oxidative stress (21-26). The compounds have also been detected in human blood plasma, isolated lipoproteins, erythrocytes, (25) and in human carotid and aortic fatty lesions (27, 28). Total linoleate peroxidation products correlate directly with oxidative stress as initiated, for example, by carbon tetrachloride. Antioxidant status also has an influence on levels of these potential biomarkers.
We have a long-standing interest in the mechanism and the products formed in linoleic acid and ester free radical oxidation (29-34) and we have proposed a mechanistic scheme to account for the distribution of HODE products formed from linoleate peroxidation. Two Z,E-conjugated diene peroxyl radicals, 1a and 1b, are formed in linoleate oxidation and trapping of these radicals by hydrogen atom transfer gives rise to Z,E-conjugated HODEs, after reduction of the primary hydroperoxide products, 2a and 2b. (For convenience, HODEs are analyzed for all of the oxidation mixtures following reduction of the corresponding hydroperoxides) β–Fragmentation of the peroxyl radicals 1a and 1b, leading ultimately to E,E-HODEs, competes with hydrogen atom transfer.
Based upon the mechanism shown in Scheme 1, the ratio of (Z,E/E,E)-HODEs from linoleate, [(2a + 2b)/(3a +3b)] formed after reduction of the corresponding hydroperoxides, can be related to the concentrations and rate constants of all hydrogen atom donors present in the reaction mixture. Experiments to determine important fragmentation rate constants and oxygen partitioning parameters for processes shown in Scheme 1 have been carried out for reactions in organic solvents at 37 °C and this permits the formulation of a simple kinetic expression for peroxidation under these standard
Scheme 1.

| Eq. 1 |
conditions, relating the (Z,E/E,E)-HODE ratio and kinetic rate constants, as shown in Equation 1.
Under conditions in which good H-atom donors are present, the reaction is under kinetic control and the Z,E-HODEs dominate the product mixture. One such H-atom donor is α–tocopherol, which reacts with peroxyl radicals with a rate constant of more than 106 M-1s-1.(35-37) Examination of Eq. 1 suggests that sub-mM concentrations of α–tocopherol should result in ratios of (Z,E/E,E)-HODEs greater than 5 to 10. On the other hand, if tocopherol is not present and if the mixture undergoing oxidation consists of poor H-atom donors such as saturated lipids, then the (Z,E/E,E)-HODE ratio will approach the thermodynamic limit of 0.16. Studies of linoleate peroxidation in mixed liposomes show the same effect. If good H-atom donors are present in the lipid bilayer, the HODE product ratio is high but if the bilayer mixture is devoid of good donors, then the product mixture favors the E,E-HODEs.(38)
Reports of (Z,E/E,E)-HODE ratios in biological tissues and fluids give values that are quite variable. In human carotid and aortic fatty lesions, these ratios were found to be in the range of 4 to 5,(27, 28) the values in older lesions being somewhat lower while in mouse liver and brain, ratios were less than 1 and in mouse plasma, product ratios as low as 0.48 were reported.(21) Analysis for HODEs in human erythrocytes gave (Z,E/E,E) ratios of about 2.5.
In the course of our studies on oxidative stress, we have recently re-examined HODE assays, particularly the (Z,E/E,E) determination as a part of our protocol. We found HODE (Z,E/E,E) ratios in our experiments generally greater than the ratios reported in the literature. Mouse liver and brain (Z,E/E,E)-HODE ratios, for example, were greater than 6 while literature values for those product ratios were generally reported to be less than 1.0. (21, 22, 26) Because of the potential importance of HODE as biomarkers and the determination of (Z,E/E,E)-HODE ratios in biological fluids and tissues in particular, we have re-examined the procedures used for assaying these peroxidation products and we report here the results of those studies. We conclude that precautions are required in HODE assays to eliminate ex vivo peroxidation and we recommend a modified workup protocols for HODE analyses of biological tissues and fluids, Tissue and Plasma Methods #2 (BHT and triphenylphosphine) described in Materials and Methods.
Materials and Methods
Materials
8-iso-PGF2α-3,3′,4,4′-d4, 13(S)-hydroxy-9Z,11E-octadecadienoic-9,10,12,13-d4 acid (13-HODE-d4), 5(S)-hydroxyeicosa-6E,8Z,11Z,14Z-tetraenoic-5,6,8,9,11,12,14,15-d8 acid (5-HETE-d8), and linoleic acid-9,10,12,13-d4 (d4-LA) were purchased from Cayman Chemical Co. (Ann Arbor, MI). Diisopropylethylamine and pentafluorobenzyl (PFB) bromide were obtained from Sigma (St. Louis, MO). Dimethylformamide and undecane were obtained from Aldrich (Milwaukee, WI). N,O-bis(trimethylsilyl)-trifluoroacetamide (BSTFA) was obtained from Supelco Inc. (Bellefonte, PA). C18 and silica Sep-Paks were purchased from Waters Associates (Milford, MA). TLC was performed on silica gel 60ALK6D plates (Whatman International Ltd., Maidstone, UK). Other materials were of highest grade available commercially.
Tissue and plasma
Female BALB/c mice were purchased from Harlan (St. Louis, MO) and Sprague-Dawley rats were purchased from Charles Rivers (Wilmington, MA). Treated rats/mice were administered CCl4 (1 mL/kg) intraperitoneally in corn oil to induce oxidative stress, control animals were simply administered corn oil as described above. After four hours, the animals were anesthetized with pentobarbital (60 mg/kg) and killed, and the livers were removed immediately and flash-frozen in liquid nitrogen. Human blood samples were collected from healthy volunteers in heparinized tubes and plasma was prepared by centrifugation at 4200 rpm for 10 min at 4 °C and immediately flash-frozen in liquid nitrogen. Livers and plasma samples were stored at -80 °C until analysis. All animal experiments were performed according to animal care guidelines and were approved by the Vanderbilt University IACUC and the Vanderbilt University Institutional Review Board approved the human plasma study. (39, 40)
Sample Preparation
Tissue method #1(BHT then sodium borohydride)
The sample (∼ 100 mg) was homogenized in 1 mL of ice-cold saline with a blade homogenizer (POLYTRON system PT 1200 E, Kinematica AG, Switzerland) on ice for 0.5 min. Subsequently, 1 mL of 100 μM butylated hydroxytoluene (BHT) in methanol containing the internal standard 13-HODE-d4 (570 ng) was added to the samples. This was followed by the reduction of hydroperoxides and ketones by using an excess of sodium borohydride (5 mg) at room temperature for 5 min. The reduced sample was then mixed with 1 M potassium hydroxide (KOH) in methanol (1 mL) under nitrogen and incubated for 30 min at 37 °C. The mixture was cooled on ice and acidified to pH 3 with 10% acetic acid or 1 N hydrochloric acid (HCl) in water and then extracted with chloroform/ethyl acetate (4:1, v/v) or hexane.(41) The organic layer was separated and evaporated to dryness under a stream of nitrogen and the sample was stored at -80 °C until it was analyzed by liquid chromatography-tandem mass spectrometry (LC-MS/MS).
Tissue method #2 (BHT with triphenylphosphine)
Tissue (∼ 100 mg) obtained as described in method #1 was homogenized with a blade homogenizer (POLYTRON system PT 1200 E, Kinematica AG, Switzerland) on ice for 0.5 min in 5 mL of an ice-cold mixture of chloroform: methanol (2:1, v/v) containing 50mg/L BHT, internal standard 13-HODE-d4 (570 ng), and excess triphenylphosphine (TPP, 10 mg). The sample was then let stand at room temperature under nitrogen with occasional shaking for 30 min. After addition of 2 mL of 0.9 wt% NaCl, the sample was then vigorously vortexed and centrifuged. The organic layer was separated and dried under a stream of nitrogen. The residue was reconstituted in 1 mL methanol containing 50mg/L BHT and was then mixed with 1 mL 1 M aqueous potassium hydroxide under nitrogen and incubated for 30 min at 37 °C. The mixture was cooled on ice and acidified to pH 3 with 10% acetic acid or 1 N HCl in water followed by extraction with chloroform/ethyl acetate (4:1, v/v) or hexane. The organic layer was separated and evaporated to dryness under a stream of nitrogen. The sample was stored at -80 °C until it was analyzed by LC-MS/MS.
Tissue method #3 (BHT then triphenylphosphine)
Tissue (∼ 100 mg) obtained as described in method #1 was homogenized in 1 mL of ice-cold saline with a blade homogenizer (POLYTRON system PT 1200 E, Kinematica AG, Switzerland) on ice for 0.5 min. Subsequently, 1 mL of 50mg/L BHT in methanol containing internal standard 13-HODE-d4 (570 ng) was added to the samples, which was then reduced by adding an excess amount of TPP (10 mg) in methylene chloride (50 μL) at room temperature for 30 min. Then the reduced sample was mixed with 1 M KOH in methanol (1 mL) under nitrogen and incubated for 30 min at 37 °C. The mixture was cooled on ice and acidified to pH 3 with 10% acetic acid or 1 N HCl in water and then extracted with chloroform/ethyl acetate (4:1, v/v) or hexane. The organic layer was separated and evaporated to dryness under a stream of nitrogen. The sample was stored at -80 °C until LC-MS/MS analysis.
Plasma method #1 (BHT then sodium borohydride)
Human plasma (0.5 mL) was added to 0.5 mL of 100 μM BHT in methanol containing internal standard 13-HODE-d4 (570 ng). This was followed by the reduction of hydroperoxides and ketones by the use of an excess amount of sodium borohydride (5 mg) at room temperature for 5 min. The reduced sample was then treated as in Tissue Method #1.
Plasma method #2 (BHT with triphenylphosphine)
0.5 mL of human plasma was added to 5 mL of an ice-cold mixture of chloroform:methanol (2:1, v/v) containing internal standard 13-HODE-d4 (570 ng), an excess amount of TPP (10 mg), and 50mg/L BHT. The sample was let stand for 30 min at room temperature under nitrogen with occasional shaking. After the addition of 2 mL of 0.9wt% NaCl, the sample was then vigorously vortexed and centrifuged. The organic layer was separated and dried under a stream of nitrogen. KOH hydrolysis and analysis was then as in Tissue Method #2.
Plasma method #3 (BHT then triphenylphosphine)
Human plasma (0.5 mL) was added to 0.5 mL of methanol containing internal standard 13-HODE-d4 (570 ng) and 100 μM BHT. The sample was reduced by adding an excess amount of TPP (10 mg) in methylene chloride (50 μL) at room temperature for 30 min. Hydrolysis and assay then follows the procedures of Tissue Method #3.
Assessing ex vivo oxidation of d4-linoleic acid (LA)
The methods for analysis of samples to which d4-linoleic acid has been added follow directly from the procedures described above. Two of these methods are described here in detail, the others can be translated from the previous procedures.
Tissue/d4-LA method #1(BHT then sodium borohydride)
A liver sample (∼ 100 mg) was homogenized for 0.5 min in 1 mL of ice-cold saline containing d4-LA (100 μg) with a blade homogenizer (POLYTRON system PT 1200 E, Kinematica AG, Switzerland). Subsequently, 1mL of 100 mM butylated hydroxyl toluene (BHT) in methanol containing the internal standard 5-HETE-d8 (450 ng) and 100 uM BHT was added to the samples. This was followed by the reduction of hydroperoxides and ketones by the use of an excess of sodium borohydride (5 mg) at room temperature for 5 min. The reduced sample was then mixed with 1 M KOH in methanol (1 mL) under nitrogen and incubated for 30 min at 37 °C. The mixture was cooled on ice and acidified to pH 3 with 10% acetic acid or 1 N HCl in water and then extracted with chloroform/ethyl acetate (4:1, v/v) or with hexane. The organic layer was separated and evaporated to dryness under a stream of nitrogen and the sample was stored at -80 °C until LC-MS/MS analysis.
Tissue/d4-LA method #2
Tissue (∼ 100 mg) was homogenized in 5 mL ice-cold mixture of chloroform:methanol (2:1, v/v) containing internal standard 5-HETE-d8 (450 ng), d4-LA (100 μg), an excess amount of TPP (10 mg), and 0.005 wt% BHT. The procedures presented in Tissue method #2 were then followed.
Analysis of HODEs and ketones by HPLC-MS/MS and F2-IsoPs by GC-MS
The sensitivity of the MS was monitored before every analysis by injecting a standard HODE mixture before the sample of interest (taken up in benzene (200 μL)) was subjected to LC-MS/MS analysis. HPLC-MS/MS was conducted using a Thermofinnigan TSQ Quantum Ultra equipped with a Finnigan Surveyor Autosampler Plus. Normal phase HPLC was performed using a Beckman Ultrasphere silica column (250 × 4.6 mm, 5 μm) with isocratic hexane/1.2% isopropanol/0.1% acetic acid at a flow rate of 1 mL/min. The MS was operated in the negative ion mode using atmospheric pressure chemical ionization (APCI) in the selective reaction-monitoring (SRM) mode. MS parameters were optimized for 13-HODE-d4 and 5-HETE-d8 and were as follows: auxiliary gas pressure was set at 20 psi, sheath gas pressure was 19 psi, utilizing nitrogen for both. Discharge current was set at 20 eV and the vaporizer temperature was set at 370 °C. Collision induced dissociation (CID) for the HETEs, HODEs and ketones were optimized at respectively at 14, 21 and 24 eV under 1.5 mTorr of argon. Data acquisition and analysis were performed using Xcaliber software, version 2.0 (San Jose, CA).
Response Factors
A standard mixture of HODEs was prepared by free radical oxidation of LA as follows. LA (1.0 M) and MeOAMVN (0.1 M) in benzene were added to a vial and the solvent was removed by a flow of nitrogen. LA was allowed to oxidize as a thin film at 37 °C for 1.5 hours. The sample was reduced by adding 400 μL of benzene containing an excess amount of TPP and 0.005wt% BHT. HODEs were analyzed by normal phase HPLC-UV using a Beckman Ultrasphere silica column (250 × 4.6 mm, 5 μm) with a isocratic of hexane/1.2% isopropanol/0.1% acetic acid at a flow rate of 1 mL/min. The detection was monitored by the absorbance at 234 nm. For LC-MS/MS analysis, 50 μL of the HODE mixture was diluted to 200 μL with benzene containing internal standard 13-HODE-d4 and analyzed by LC-MS/MS. Response factors were determined versus the 13-Z,E-HODE.
Statistical Analyses
Results were expressed as mean ± standard deviation (SE). Statistical analysis was performed using a commercial package (GraphPad Prism 4). The ratios of total HODEs, 13-ZE/EE, and 9-ZE/EE for mouse liver and human plasma (Figure 4A and C) were compared using one-way analysis of variance (ANOVA). The ratios of HODEs in CCl4 treated rat liver samples (Figure 4B) were analyzed using the Student t test. Statistical significance was taken when P < 0.05.
Figure 4.

HODE ratios determined in mouse liver (A), CCl4 rat liver (B), and human plasma (C) analyzed by three methods. Method 1; tissue or plasma homogenized and then reduced in methanol with NaBH4 in the presence of BHT. Method 2; tissue or plasma homogenized in chloroform/methanol in the presence of PPh3 and BHT. Method 3; tissue or plasma homogenized and then reduced with PPh3 and BHT. Data are expressed as mean values ± SD. *, P < 0.05; **, P < 0.01; ***, P < 0.001.
Analysis of F2-IsoPs by GC-MS
The purification and derivatization of F2-IsoPs was performed as reported previously.(42) Briefly, the sample was reconstituted with methanol (200 μL) and diluted to 10 mL with pH 3 water. 1 ng 8-iso-PGF2α-3,3′,4,4′-d4 standard was then added and the sample was purified by Sep-Pak extraction. Purified IsoPs were converted to PFB esters trimethylsilyl ether derivatives and analyzed by GC-MS. GC-MS was performed using a Hewlett-Packard HP5989A GC-MS instrument interfaced with an IBM Pentium III computer system. GC was performed using a 15 m, 0.25 mm diameter, 0.25 μm film thickness, DB1701 fused silica capillary column (Fisons, Folsom, CA). The column temperature was programmed from 190 to 300 °C at 15 °C/min. Methane was used as the carrier gas at a flow rate of 1 mL/min. The ion source temperature was 250 °C, electron energy was 70 eV, and filament current was 0.25 mA. For analysis, compounds were dissolved in 10 μL of undecane, which was dried over a bed of calcium hydride.
Preparation of Phospholipid Standards
PLPC hydroperoxide (13S-PLPC-OOH)
Soybean lipoxygenase (20mg) (Sigma, St. Louis, MO) was taken up in 30 mL of pH 9.0 borax buffer that contained 10 mM deoxycholate. PLPC (25 mg) was taken up in 3 mL of the same buffer and added to the enzyme solution. The reaction was stirred at room temperature for 30–60 min. The progress of the reaction was monitored by UV at 234 nm. The unreacted PLPC and hydroperoxide were extracted with chloroform:methanol (2:1, v/v) The collected organic solvent was evaporated to dryness under nitrogen and reconstituted with methanol. 13S-PLPC-OOH was purified by reverse-phase HPLC (Discovery C18 HPLC column, 25 cm × 21.2 mm, 5 μm) equilibrated with methanol/water (95/5) at a flow rate of 15 mL/min. The chromatogram was monitored by the absorbance at 234 nm.(43)
Synthesis of PLPC ketone (13-PLPC-ketone)
13S-PLPC-OOH (42 mg) was dissolved in dry methylene chloride (1 mL), cooled and treated dropwise with a mixture of acetic anhydride/pyridine (90 μL, 1:2 v/v) in methylene chloride (500 ul). The mixture was left overnight at 4°C. Subsequently it was poured into ice/water and extracted with methylene chloride. The extract was washed with sodium hydrogen carbonate and evaporated to dryness under nitrogen and reconstituted with methanol.(44) 13-PLPC-ketone was purified by reversed-phase HPLC (Discovery C18 HPLC column, 25 cm × 21.2 mm, 5 μm) equilibrated with methanol/water (90/10) at a flow rate of 15 mL/min. The detection was monitored by absorbance at 210 nm.
Results
Preparation of Standards and Chromatographic Separations
The hydroxy-octadecadionoic acids (HODEs) are well-known oxidation products of linoleic acid, the oxo-octadecadienoic acids (OODEs) have been reported less often. We prepared a mixture of all of the HODEs and OODEs by free radical oxidation of linoleic acid or a linoleoyl-containing phospholipid. The oxidation mixtures were reacted with excess triphenylphosphine and the phospholipid was hydrolyzed with KOH/MeOH after reduction. An HPLC-MS/MS normal phase separation that permitted analysis of each HODE and OODE in a single run was developed, vide infra.
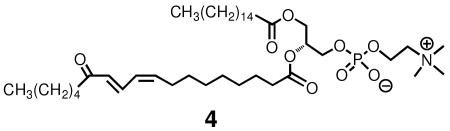
The compound 4, a phospholipid having a 13-OODE attached at sn-2 was independently prepared by a reaction sequence involving conversion of a 2-linoleoyl glycerophospholipid to the corresponding 13-hydroperoxide by reaction with soybean lipoxygenase. This was followed by reaction of the hydroperoxide with pyridine-acetic anhydride, a reaction that gives the 13-keto compound. The 1H NMR spectra of compound 4, presented in Supporting Information, shows essentially that only a Z,E stereoisomer (45) is present in the reaction mixture and MS fragmentation indicates that the major regioisomer present is the 13-oxo compound.
MS/MS on the free acid HODEs and OODEs was carried out in the negative ion mode. Selected Reaction Monitoring (SRM) distinguishes the 13 substituted octadecadienenoates, both the hydroxy and oxo compounds, from their 9-substituted counterparts. Thus, the 13-hydroxy (m/z= 295) and oxo (m/z= 293) molecular ions give characteristic fragment ions as do the analogous 9 substituted compounds.(45) A typical HPLC-MS/MS chromatogram of a synthetic mixture of all hydroxy and oxo-octadecadienoic acids is presented in Figure 1. Clean separation of the HODEs and the oxo-octadecadienoates (OODEs) was achieved in the normal-phase mode and standardization of all HODEs and OODEs was carried out vs. the commercially available d413-Z,E-HODE, shown in the bottom panel of the Figure.
Figure 1.

Typical LC-MS/MS chromatogram of standard OODE/HODE mixture (normal phase: hexane/1.2% isopropanol/0.1% acetic acid). For MS/MS product ion spectra and CID fragment structures, see references (45, 53).
Figures 2 and 3 show the analysis by two different methods of HODE and OODE products obtained from rat liver samples. Figure 2 shows the results of the protocol described in the Materials and Methods section as Tissue Method #1, a procedure in which tissue is homogenized in saline followed by the addition of BHT and reduction with sodium borohydride. Figure 3 shows the chromatogram obtained from the same liver sample by Tissue Method #2 in which homogenization takes place in ice-cold chloroform: methanol (2:1, v/v) containing BHT, internal standard and excess triphenylphosphine. Comparison of the chromatograms presented in Figures 2 and 3 makes clear that the results obtained are critically dependent on the workup procedures used in the analysis. In particular, the (Z,E/E,E)-HODE product ratios are dramatically different for samples analyzed by Tissue Methods #1 (Z,E/E,E)= 0.79 and #2 (Z,E/E,E)= 18. In Figure 4 are presented Z,E/E,E product ratios obtained from several biological samples by the use of different methods of analysis and these results again show a different result when Method #1 is compared to either Method #2 or #3. Use of sodium borohydride always gives significantly lower (Z,E/E,E) product ratios than reactions worked up in the presence of triphenylphosphine.
Figure 2.

Typical LC-MS/MS chromatogram for mouse liver reduced with sodium borohydride. Note that MS sensitivity is set much higher for the OODE analysis than is the case for HODEs. For MS/MS product ion spectra and CID fragment structures, see references (45, 53).
Figure 3.

Typical LC-MS/MS chromatogram for mouse liver reduced with triphenylphosphine. Note that MS sensitivity is set much higher for the OODE analysis than is the case for HODEs. For MS/MS product ion spectra and CID fragment structures, see references (45, 53).
Table 1 presents quantitative information of HODE and OODE oxidation products for standard rodent liver samples, livers from rodents treated with carbon tetrachloride, and standard human plasma samples by the three methods described in Materials and Methods. The notable difference between the quantitative HODE product analyses observed by the three methods is the fact that the sodium borohydride procedure generally registered higher levels of oxidation products as compared to the two procedures that incorporated triphenylphosphine as a reducing agent. In some examples the HODE levels determined by Method #1, in which borohydride was used as the reductant, were 5 to 10 fold higher than those measured by the procedure making use of triphenylphosphine, Method #2. The F2-IsoPs were also assayed by standard methods and the results of those assays are also presented in Table 1 for two of the biological samples.
Table 1.
Analysis of Linoleate HODE and OODE Oxidation Products Isolated from Rodent Liver and Human Plasmaa
| Method 1 | Method 2 | Method 3 | |
|---|---|---|---|
| Mouse liver (HODE: ng/mg tissue) | |||
| Total HODE | 4.3 ± 0.3 | 0.86 ± 0.01 | 1.3 ± 0.2 |
| Total ZE HODE | 1.9 ± 0.1 | 0.81 ± 0.01 | 1.2 ± 0.2 |
| Total EE HODE | 2.4 ± 0.2 | 0.045 ± 0.005 | 0.11 ± 0.03 |
| 13 ZE HODE | 0.80 ± 0.02 | 0.42 ± 0.09 | 0.63 ± 0.05 |
| 13 EE HODE | 0.95 ± 0.03 | 0.021 ± 0.001 | 0.05 ± 0.01 |
| 9 ZE HODE | 1.1 ± 0.1 | 0.39 ± 0.08 | 0.60 ± 0.10 |
| 9 EE HODE | 1.5 ± 0.2 | 0.023 ± 0.001 | 0.06 ± 0.01 |
| Total ketone | 0.15 ± 0.02 | 0.23 ± 0.04 | 0.12 ± 0.04 |
| % yield of d4 HODE from d4 LA in mouse liver | |||
| Total d4HODE | 0.093 ± 0.006 | 0.018 ± 0.001 | |
| Total ZE d4HODE | 0.048 ± 0.004 | 0.018 ± 0.001 | |
| Total EE d4HODE | 0.045 ± 0.002 | 0.0004 ± 0.0001 | |
| 13 ZE d4 HODE | 0.016 ± 0.001 | 0.010 ± 0.001 | |
| 13 EE d4 HODE | 0.018 ± 0.001 | 0.0004 ± 0.0001 | |
| 9 ZE d4 HODE | 0.032 ± 0.004 | 0.008 ± 0.001 | |
| 9 EE d4 HODE | 0.027 ± 0.003 | - | |
| Rat liver (HODE, OODE, IsoP ng/mg tissue) | |||
| Total HODE | 1.2 ± 0.3 | 0.050 ± 0.01 | |
| Total ZE HODE | 0.59 ± 0.06 | 0.046 ± 0.01 | |
| Total EE HODE | 0.60 ± 0.02 | 0.004 ± 0.001 | |
| 13 ZE HODE | 0.34 ± 0.04 | 0.025 ± 0.004 | |
| 13 EE HODE | 0.33 ± 0.01 | 0.002 ± 0.001 | |
| 9 ZE HODE | 0.25 ± 0.01 | 0.021 ± 0.004 | |
| 9 EE HODE | 0.27 ± 0.08 | 0.002 ± 0.001 | |
| Total ketone | 0.05 ± 0.02 | 0.010 ± 0.004 | |
| Iso-F2 | 0.07 ± 0.02 | 0.007 ± 0.001 | |
| CCl4 rat liver (HODE, OODE, IsoP ng/mg tissue) | |||
| Total HODE | 1.6 ± 0.6 | 0.26 ± 0.17 | |
| Total ZE HODE | 0.99 ± 0.1 | 0.23 ± 0.15 | |
| Total EE HODE | 0.65 ± 0.02 | 0.033 ± 0.016 | |
| 13 ZE HODE | 0.59 ± 0.01 | 0.11 ± 0.03 | |
| 13 EE HODE | 0.43 ± 0.01 | 0.015 ± 0.007 | |
| 9 ZE HODE | 0.40 ± 0.01 | 0.12 ± 0.08 | |
| 9 EE HODE | 0.22 ± 0.01 | 0.018 ± 0.008 | |
| Total ketone | 0.06 ± 0.03 | 0.025 ± 0.004 | |
| Iso-F2 | 0.28 ± 0.07 | 0.11 ± 0.02 | |
| Human plasma (HODE, OODE ng/ml plasma) | |||
| Total HODE | 72 ± 12 | 24 ± 1 | 24 ± 1 |
| Total ZE HODE | 38 ± 5 | 21 ± 1 | 19 ± 1 |
| Total EE HODE | 34 ± 8 | 2.9 ± 0.1 | 4.9 ± 0.3 |
| 13 ZE HODE | 23 ± 3 | 11 ± 1 | 9.8 ± 0.6 |
| 13 EE HODE | 16 ± 2 | 1.5 ± 0.1 | 2.4 ± 0.1 |
| 9 ZE HODE | 15 ± 1 | 10 ± 1 | 9.2 ± 0.1 |
| 9 EE HODE | 18 ± 5 | 1.4 ± 0.1 | 2.5 ± 0.2 |
| Total ketone | 0.32 ± 0.07 | 5.4 ± 0.5 | 3.4 ± 0.4 |
Method 1; tissue or plasma homogenized and then reduced in methanol with NaBH4 in the presence of BHT. Method 2; tissue or plasma homogenized in chloroform/methanol in the presence of PPh3 and BHT. Method 3; tissue or plasma homogenized and then reduced with PPh3 and BHT.
Discussion
The major free radical oxidation products from linoleic acid or its esters are hydroperoxy octadecadienoates (HPODEs) but HODE and OODE termination products are always present in linoleate autoxidation product mixtures, normally as minor constituents. The HODEs are normally the linoleate oxidation products that are isolated and analyzed by chromatographic methods however, following reduction of the HPODE primary products.(30, 46) Figure 1 shows normal-phase chromatography of a relatively clean mixture of HODEs and OODEs generated by free radical oxidation of linoleic acid followed by reduction of HPODEs. The chromatograms shown in the Figure utilize Selected Reaction Monitoring (SRM) to distinguish the 9 and 13-substituted octadecadienoates for both the HODEs and OODEs. The regioisomers give unique daughter ions that can be monitored by SRM, see Figure 1.(45)
The total level of HODE oxidation products has been used as a biomarker of oxidative stress and this index and the (Z,E/E,E) ratio has been used to provide information about antioxidant efficacy in vivo and in vitro.(21-26, 41) In mechanistic studies, the ratio of (Z,E/E,E) HODE products formed in the co-oxidation of linoleate and substrates such as sterols and polyunsaturated fatty acids has provided a useful kinetic probe for determining rate constants for the slow propagation step of the process.(38) Because of the breadth and potential importance of these applications, procedures used for analysis of the HODEs, particularly in biological fluids and tissues, should be robust and reproducible.
The experiments reported here focus on two agents that are commonly used to reduce primary lipid peroxidation products, sodium borohydride and triphenylphosphine. Sodium borohydride is soluble in methanol and water, but reacts with both in the absence of base. It reduces hydroperoxides and dialkylperoxides as well as ketones and aldehydes. Triphenylphosphine is insoluble in water but soluble in most organic solvents. It reduces hydroperoxides and strained cyclic peroxides such as the endoperoxide intermediates in prostaglandin biosynthesis, PGG2 and PGH2. It does not react with simple 1,2-dioxolanes or 1,2-dioxanes.(47) Triphenylphosphine is considered to be a gentler reducing agent than sodium borohydride since the hydride will promote reactions that the phosphine will not.
The protocol that has been reported for analysis of HODEs in biological tissues involves homogenization of the tissue sample, addition of BHT and sodium borohydride reduction. Analogous procedures for assay of HODEs in plasma start with addition of BHT followed by borohydride reduction. For both tissue and plasma, borohydride reduction in one literature protocol is followed by hydrolysis of lipid esters and analysis of the HODE TMS ether/esters by GC/MS.(24) An alternative approach recently reported is assay of the HODE free acids by the use of an ODS reverse-phase HPLC in conjunction with MS/MS detection.(41) Internal deuterated standards are used to measure total HODEs in the samples, and the (Z,E/E,E) HODE ratio is determined directly from the GC or reverse-phase HPLC chromatograms.
When the literature procedures for HODE analysis of rodent liver involving tissue homogenization, borohydride reduction and ester hydrolysis were carried out (Tissue method #1) and this protocol was followed by analysis of the products by normal-phase HPLC-MS/MS, chromatograms like those shown in Figure 2 were reproducibly obtained. The chromatograms are understandably not as clean as those from the product mixture obtained from oxidation of linoleic acid alone. Nevertheless, the major HODE and OODE products can be identified by comparison of retention times with authentic standards and the (Z,E/E,E) HODE ratios can be readily determined. Note that the OODEs are only a minor component of the product mixture, the sensitivity used for their detection in Figure 2 is over an order of magnitude greater than that used for detection of the HODEs. Note also that the m/z SRM assay of the internal standard is complicated by the fact that additional compounds are detected in this channel at 11.25, 13.45 and 20.73 min. Analysis of the MS fragmentation of these additional compounds show that the 20.73 min peak is d413-E,E-HODE, the geometric isomer of the internal standard. The compounds that elute at 11.25 and 13.45 in the chromatogram are apparently hydroxyoctadecenoates (from oleate, 18:1), not hydroxyoctadeca-dienolates (from linoleate, 18:2). The presence of the 11.25 and 13.45 compounds is observed only in samples that include borohydride and extracts from a biological sample (plasma or tissue) while d413-E,E-HODE, the 20.7 min eluting compound is observed only from biological extracts containing the internal standard that have undergone workup by the borohydride procedure. If the isolated Z,E-oxo-octadecadienoate 4 or the corresponding precursor hydroperoxide is exposed to the borohydride reduction procedure, the product mixture is clean, the 11.25, 13.45 and 20.73 min products are not observed.
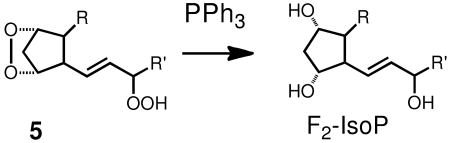
Peroxide-derived products of arachidonic acid, the isoprostanes (IsoPs) have been used as primary standards for measuring oxidative stress and the protocols developed for isolation and analysis of the IsoPs would also appear to be appropriate for the analysis of HODEs.(16, 17, 42, 48) The IsoPs are a family of regio and stereoisomers of the bicyclic endoperoxide 5, of which PGG2 is a member, and triphenylphosphine is used in the standard IsoP assay to reduce the endoperoxide and allylic hydroperoxide of 5. Triphenylphosphine reduction is usually followed in the IsoP assay by a KOH/MeOH hydrolysis to convert any esterified IsoPs to the free acid form. Subsequent conversion of the free acid F2-IsoPs to TMS derivatives is followed by GC/MS analysis.
Elements of the IsoP assay do indeed prove to be useful for analysis of HODEs. Thus, when methods for measuring IsoP levels in tissues and plasma are followed through the protocol steps involving extraction of lipids, triphenylphosphine reduction and ester hydrolysis, (Tissue method #2) a relatively clean mixture of HODEs and OODEs can be assayed by HPLC-MS/MS using the normal-phase SRM mode. When this approach to analyze HODE products in rodent tissue was carried out, the chromatogram shown in Figure 3 was obtained. In fact, the same liver tissue was used in the assays shown in Figures 2 and 3 and the HPLC-MS/MS analysis shown in Figure 3 is very clean by comparison, the major products present are the HODEs and again they are present in great excess compared to the OODEs. Note also that the internal standard HPLC-MS/MS analysis is clean in Figure 3, triphenylphosphine in combination with biological tissues and fluids does not generate the products that complicate the internal standard determination.
The most obvious differences between the liver tissue assays are the (Z,E/E,E) HODE ratios. The results from Method #1 (Figure 2) give (Z,E/E,E) = 0.79 while the value obtained from Method #2 (Figure 3) (Z,E/E,E) = 18. Indeed, the two methods for analysis of the HODEs in tissue samples always gave very different results, the borohydride method giving (Z,E/E,E) values of less than 2 and the triphenylphosphine method yielding much higher product ratios. This is shown graphically in Figure 4, the same conclusions can be extracted from the data in Table 1. The (Z,E/E,E) product ratios also differ when the borohydride and phosphine methods are used to assay HODEs in human plasma.
Table 1 and Figure 4 also show the results of analysis of tissues and fluids by Method #3 in which homogenization and then BHT is followed by triphenylphosphine reduction. This differs from Method #2 in which BHT and triphenylphosphine are present during the homogenization step. Method #3 generally gives somewhat lower (Z,E/E,E) product ratios than Method #2, although they are still substantially higher than the product ratios obtained from procedures which include the use of sodium borohydride. Indeed, comparison of the three methods suggests that the difference in the assay is principally due to the differential effects of sodium borohydride and triphenylphosphine as reductants. The fact that all protocols making use of triphenylphosphine gave high (Z,E/E,E) product ratios, and this reagent is generally considered to be a milder reducing agent than sodium borohydride, casts suspicion on the hydride reagent.
We conclude that sodium borohydride promotes ex vivo reactions during the workup procedure while triphenylphosphine does not. A number of observations support this suggestion. First, HODE product yields obtained with the borohydride Method #1 are 3 to 10 times higher than those determined with phosphine Methods #2 or #3, see Table 1. Addition of deuterated linoleic acid to the initial tissue or plasma samples before workup showed that significant amounts of deuterated HODEs are formed from the borohydride method but the yield of such products is significantly lower with phosphine methods, see Table 1. Isoprostane levels determined from tissues and fluids utilizing the borohydride procedure are significantly higher than those measured by the phosphine protocol. All of these observations suggest that borohydride has a role in the assay that involves more than simply reducing peroxide intermediates.
An alternative explanation for the borohydride result is that it acts as a non-selective reductant of OODE products like 4 while triphenylphosphine will not carry out this transformation. Thus, the high levels of HODEs determined when borohydride is used as a reducing agent reflects the fact that OODEs are converted to HODEs in the protocol. This suggestion is not consistent with the fact that OODE product yields are an order of magnitude lower than the HODE yields when determined by the phosphine protocols, see Table 1. Thus, OODE reduction by borohydride could not possibly account for the higher HODE yields and lower (Z,E/E,E) product ratio observed in the borohydride method.
Taken as a whole, the data support the notion that the use of borohydride in assays of biological tissues and fluids promotes free radical reactions during the workup. Total HODE as well as IsoP levels are generally high when the borohydride method is employed and reduction of OODEs by this reagent cannot account for the increase in HODE levels. While it may seem paradoxical to suggest that the reducing agent promotes additional lipid peroxidation during its use, it should be noted that there are a number of free radical reactions in which borohydride or its derivatives participate. Reduction of alkyl mercurials is attended by free radical reactions of intermediate carbon radicals with molecular oxygen and free radical mechanisms have been written for the reaction of the reducing agent with alkyl halides as well.(49-52) The borohydride ion has been proposed to be a source of hydrogen atoms with the radical anion of BH3 as a chain-propagating intermediate.
It is also apparent that the combination of borohydride and extracts from biological tissues and fluids compromises the determination of the HODE geometric isomer ratio. Not only are the (Z,E/E,E) product ratios of endogenous lipids affected by the borohydride workup procedure, but also the integrity of the internal standard is compromised, as shown in Figure 3. We conclude that the low (Z,E/E,E) product ratios determined by methods employing sodium borohydride do not represent the true ratio of products formed in vivo but rather reflect the aqueous-methanol conditions encountered in the ex vivo borohydride-promoted reaction step of the protocol.
The extracts of biological fluids and tissues obviously is a complex mixture of lipids and other species, including endogenous metals such as heme and non-heme iron. Aggregates such as inverted micelles or liposomes may be present and pinpointing the precise mechanism of the borohydride-initiated events that lead to ex vivo oxidation is not a straightforward exercise. We do have some data that may provide insight, however. Table 2 presents HODE, HETE and IsoP data from the analysis of rat brain tissue worked up by the borohydride and triphenylphosphine procedures but with added 100μM or 1mM EDTA. These analyses again show evidence of ex vivo oxidation in the borohydride workup compared to triphenylphosphine but they also show that EDTA attenuates the effect. Thus, the Z,E/E,E ratio for borohydride reduction is 2.2 but with 100μM or 1mM EDTA the ratios observed are 4.0 and 5.0 and the overall levels of HODEs, HETEs and IsoPs are modestly reduced. We suggest that sodium borohydride converts Fe(III) and methemoglobin to Fe(II) and further, that EDTA sequesters some of the Fe(II) generated in this way. Fe(II) can initiate Fenton chemistry, which may then have a significant role to play in a borohydride-mediated sequence. In support of this notion, we observed that the 630 nm absorption of methemoglobin is decreased after addition of sodium borohydride, a result consistent with reduction of the compound.
Table 2.
Analysis of Linoleate HODE, HETEs and Isoprostanes in Mouse Brain
| BHT, NaBH4 | BHT, NaBH4 100μM EDTA | BHT, NaBH4 1 mM EDTA | BHT, PPh3 | BHT, PPh3 100μM EDTA | BHT, PPh3 1 mM EDTA | |
|---|---|---|---|---|---|---|
| Mouse brain (HODE, HETE, isoPs: ng/mg tissue) | ||||||
| 9ZE HODE | 0.49 ± 0.1 | 0.56 ± 0.03 | 0.54 ± 0.05 | 0.51 ± 0.02 | 0.49 ± 0.004 | 0.49 ± 0.01 |
| 9EE HODE | 0.25 ± 0.1 | 0.18 ± 0.04 | 0.14 ± 0.01 | 0.028 ± 0.005 | 0.047 ± 0.01 | 0.039 ± 0.005 |
| 13 ZE HODE | 0.43 ± 0.2 | 0.54 ± 0.07 | 0.49 ± 0.06 | 0.55 ± 0.07 | 0.56 ± 0.07 | 0.54 ± 0.07 |
| 13 EE HODE | 0.21 ± 0.1 | 0.11 ± 0.03 | 0.069 ± 0.01* | 0.0054 ± 0.004 | 0.0056 ± 0.004 | 0.015 ± 0.008 |
| ZE HODE | 0.92 ± 0.3 | 1.1 ± 0.1 | 1.0 ± 0.1 | 1.1 ± 0.06 | 1.0 ± 0.08 | 1.0 ± 0.06 |
| EE HODE | 0.46 ± 0.1 | 0.29 ± 0.07 | 0.21 ± 0.02* | 0.033 ± 0.007 | 0.053 ± 0.01 | 0.054 ± 0.01 |
| ZE/EE | 2.2 ± 1 | 4.0 ± 1 | 5.0 ± 0.9 | 32 ± 5 | 21 ± 6 | 19 ± 3* |
| t-HODE | 1.4 ± 0.2 | 1.4 ± 0.04 | 1.2 ± 0.09 | 1.1 ± 0.07 | 1.1 ± 0.07 | 1.1 ± 0.06 |
| t-HETE | 8.3 ± 0.2 | 7.8 ± 0.7 | 7.5 ± 0.8 | 11 ± 0.2 | 12 ± 2 | 13 ± 2 |
| IsoPs | 0.44 ± 0.3 | 0.26 ± 0.04 | 0.27 ± 0.03 | 0.091 ± 0.01 | 0.079 ± 0.02 | 0.083 ± 0.009 |
We should mention that the borohydride procedure has been used in studies intended to assess antioxidant efficacy in vivo as reflected by the (Z,E/E,E) product ratio. Lower total HODEs and a higher (Z,E/E,E) value would indicate more efficient trapping of peroxyl radicals in a rodent on dietary antioxidant supplements. Indeed, this trend is observed for some rodent antioxidant studies. Given the data presented here however, it seems likely that the dietary antioxidants affect the (Z,E/E,E) product ratio of those HODEs that form during oxidation that occurs ex vivo during the assay and this product ratio does not reflect what is occurring in vivo. In short, the (Z,E/E,E) product ratio reflects the efficacy of the antioxidant at the site and time of oxidation and if the antioxidant is present in animal tissues and fluids and it is extracted into the assay medium, its effect on ex vivo oxidation will likely be measurable.
Finally, we propose that any future studies that involve the assessment of lipid peroxidation products from biological tissues and fluids avoid the use of sodium borohydride or other hydride reducing agents that might promote redox cycling of endogenous iron. Preferred protocols such as Tissue and Plasma Methods #2 described in Materials and Methods provide a solution to the ex vivo oxidation problem by the replacement of hydride or other strong reducing agents with mild reductants such as triphenylphosphine or trimethylphosphite. Presumably thioethers could also be used in place the phosphorous reagents since hydroperoxide functional groups are also reduced by agents such as dimethylsulfide.
Given the improved protocol for the HODE assay reported here, this analysis is recommended as an attractive alternative to existing measures for oxidative stress and lipid peroxidation. Linoleate is an important constituent in lipid pools and the product mixture from this fatty acid is relatively simple, so the total HODE levels determined provide a direct measure of peroxidation. An added bonus to the HODE assay, however, is the fact that the Z,E/E,E product ratio provides an assessment of the local environment of the lipid at the time of reaction. High Z,E/E,E product ratios indicate that good hydrogen donors (antioxidants, highly oxidizable lipids) are present at the site of peroxidation, low Z,E/E,E ratios reflect an environment where hydrogen donors are either not present or are present at relatively low levels. This feature of the HODE analysis and the improved protocol reported here may find new applications in the study of oxidative stress. For example, the efficacy of antioxidants in vivo should be reflected in the HODE Z,E/E,E ratios determined by the methods described here.
Supplementary Material
Acknowledgments
The National Institutes of Health (ES013125) and the National Science Foundation (CHE 0717067) supported this work.
Abbreviations
- tHODE
total hydroxyoctadecadienoic acid
- (Z,E/E,E) HODE ratio
molar ratio of HODE stereoisomer, (9- and 13-(Z,E)-HODE)/(9- and 13-(E,E)-HODE)
- HPODE
hydroperoxyocta-decadienoic acid
- t8-iso-PGF2_
total 8-iso-prostaglandin F2_
- PBS
phosphate-buffered saline
- αT
α-tocopherol
- TBARS
thiobarbituric acid reactive substances
Footnotes
Supporting Information Available: 1H- and 13C-NMR chemical shifts of compound 4 and HPLC-MS/MS chromatograms assays of liver/CCl4 and plasma, Figure S5-S9. This material is available free of charge via the Internet at http://pubs.acs.org.
References
- 1.Davies KJA. Oxidative Stress, Antioxidant Defenses, and Damage Removal, Repair, and Replacement Systems. IUBMB Life. 2000;50:279–289. doi: 10.1080/713803728. [DOI] [PubMed] [Google Scholar]
- 2.Niki E. Lipid peroxidation: physiological levels and dual biological effects. Free Radic Biol Med. 2009;47:469–484. doi: 10.1016/j.freeradbiomed.2009.05.032. [DOI] [PubMed] [Google Scholar]
- 3.Spiteller G. Lipid peroxidation in aging and age-dependent diseases. Exp Gerontol. 2001;36:1425–1457. doi: 10.1016/s0531-5565(01)00131-0. [DOI] [PubMed] [Google Scholar]
- 4.Esterbauer H. Estimation of peroxidative damage. A critical review. Pathol Biol. 1996;44:25–28. [PubMed] [Google Scholar]
- 5.Bird RP, Hung SSO, Hadley M, Draper HH. Determination of Malonaldehyde in Biological Materials by HPLC. Anal Biochem. 1983;128:240–244. doi: 10.1016/0003-2697(83)90371-8. [DOI] [PubMed] [Google Scholar]
- 6.Esterbauer H, Zollner H. Methods for determination of aldehydic lipid peroxidation products. Free Rad Biol Med. 1989;7:197–203. doi: 10.1016/0891-5849(89)90015-4. [DOI] [PubMed] [Google Scholar]
- 7.Porter N, Nixon J, Isaac R. Cyclic peroxides and the thiobarbituric assay. Biochim Biophys Acta. 1976;441:506–512. doi: 10.1016/0005-2760(76)90247-2. [DOI] [PubMed] [Google Scholar]
- 8.Inoue T, Ando K, Kikugawa K. Specific determination of malonaldehyde by N-methyl-2-phenylindole or thiobarbituric acid. J Am Oil Chem Soc. 1998;75:597–600. [Google Scholar]
- 9.Jentzsch AM, Bachmann H, Fürst P, Biesalski HK. Improved analysis of malondialdehyde in human body fluids. Free Radic Biol Med. 1996;20:251–256. doi: 10.1016/0891-5849(95)02043-8. [DOI] [PubMed] [Google Scholar]
- 10.Esterbauer H, Cheeseman KH. Determination of Aldehydic Lipid-Peroxidation Products - Malonaldehyde and 4-Hydroxynonenal. Methods in Enzymology. 1990;186:407–421. doi: 10.1016/0076-6879(90)86134-h. [DOI] [PubMed] [Google Scholar]
- 11.Seljeskog E, Hervig T, Mansoor MA. A novel HPLC method for the measurement of thiobarbituric acid reactive substances (TBARS). A comparison with a commercially available kit. Clin Biochem. 2006;39:947–954. doi: 10.1016/j.clinbiochem.2006.03.012. [DOI] [PubMed] [Google Scholar]
- 12.Bird RP, Draper HH. Comparative Studies on Different Methods of Malonaldehyde Determination. Methods Enzymol. 1984;105:299–305. doi: 10.1016/s0076-6879(84)05038-2. [DOI] [PubMed] [Google Scholar]
- 13.Yin H, Porter NA. New Insights Regarding the Autoxidation of Polyunsaturated Fatty Acids. Antiox Redox Sig. 2005;7:170–184. doi: 10.1089/ars.2005.7.170. [DOI] [PubMed] [Google Scholar]
- 14.Porter NA, Caldwell SE, Mills KA. Mechanisms of free radical oxidation of unsaturated lipids. Lipids. 1995;30:277–290. doi: 10.1007/BF02536034. [DOI] [PubMed] [Google Scholar]
- 15.Porter NA. Mechanisms for the autoxidation of polyunsaturated lipids. Accs Chem Res. 1986;19:262–270. [Google Scholar]
- 16.Morrow JD, Minton TA, Roberts LJ., II The F2-isoprostane, 8-epi-prostaglandin F2 alpha, a potent agonist of the vascular thromboxane/endoperoxide receptor, is a platelet thromboxane/endoperoxide receptor antagonist. Prostaglandins. 1992;44:155–163. doi: 10.1016/0090-6980(92)90077-7. [DOI] [PubMed] [Google Scholar]
- 17.Morrow JD, Awad JA, Boss HJ, Blair IA, Roberts LJ., II Non-cyclooxygenase-derived prostanoids (F2-isoprostanes) are formed in situ on phospholipids. Proc Natl Acad Sci USA. 1992;89:10721–10725. doi: 10.1073/pnas.89.22.10721. [DOI] [PMC free article] [PubMed] [Google Scholar]
- 18.Yin H, Gao L, Tai HH, Murphey L, Porter NA, Morrow JD. Urinary prostaglandin F2alpha is generated from the isoprostane pathway and not the cyclooxygenase in humans. J Biol Chem. 2007;282:329–336. doi: 10.1074/jbc.M608975200. [DOI] [PubMed] [Google Scholar]
- 19.Yin H, Havrilla CM, Gao L, Morrow JD, Porter NA. Mechanisms for the formation of isoprostane endoperoxides from arachidonic acid - “Dioxetane” intermediate versus beta-fragmentation of peroxyl radicals. J Biol Chem. 2003;278:16720–16725. doi: 10.1074/jbc.M300604200. [DOI] [PubMed] [Google Scholar]
- 20.Yin H, Havrilla CM, Morrow JD, Porter NA. Formation of isoprostane bicyclic endoperoxides from the autoxidation of cholesteryl arachidonate. J Am Chem Soc. 2002;124:7745–7754. doi: 10.1021/ja0201092. [DOI] [PubMed] [Google Scholar]
- 21.Yoshida Y, Hayakawa M, Habuchi Y, Niki E. Evaluation of the dietary effects of coenzyme Q in vivo by the oxidative stress marker, hydroxyoctadecadienoic acid and its stereoisomer ratio. Biochim Biophys Acta. 2006;1760:1558–1568. doi: 10.1016/j.bbagen.2006.06.007. [DOI] [PubMed] [Google Scholar]
- 22.Yoshida Y, Itoh N, Hayakawa M, Habuchi Y, Inoue R, Chen ZH, Cao J, Cynshi O, Niki E. Lipid peroxidation in mice fed a choline-deficient diet as evaluated by total hydroxyoctadecadienoic acid. Nutrition. 2006;22:303–311. doi: 10.1016/j.nut.2005.07.020. [DOI] [PubMed] [Google Scholar]
- 23.Yoshida Y, Niki E. Bio-markers of lipid peroxidation in vivo: Hydroxyoctadecadienoic acid and hydroxycholesterol. Biofactors. 2006;27:195–202. doi: 10.1002/biof.5520270117. [DOI] [PubMed] [Google Scholar]
- 24.Yoshida Y, Itoh N, Hayakawa M, Piga R, Cynshi O, Jishage K, Niki E. Lipid peroxidation induced by carbon tetrachloride and its inhibition by antioxidant as evaluated by an oxidative stress marker, HODE. Toxicol Appl Pharmacol. 2005;208:87–97. doi: 10.1016/j.taap.2005.01.015. [DOI] [PubMed] [Google Scholar]
- 25.Yoshida Y, Niki E. Detection of lipid peroxidation in vivo: total hydroxyoctadecadienoic acid and 7-hydroxycholesterol as oxidative stress marker. Free Radical Research. 2004;38:787–794. doi: 10.1080/10715760410001700460. [DOI] [PubMed] [Google Scholar]
- 26.Yoshida Y, Hayakawa M, Habuchi Y, Itoh N, Niki N. Evaluation of lipophilic antioxidant efficacy in vivo by the biomarkers hydroxyoctadecadienoic acid and isoprostane. Lipids. 2007;42:463–472. doi: 10.1007/s11745-007-3043-7. [DOI] [PubMed] [Google Scholar]
- 27.Upston JM, Terentis AC, Morris K, Keaney JF, Jr, Stocker R. Oxidized lipid accumulates in the presence of alpha-tocopherol in atherosclerosis. Biochem J. 2002;363:753–760. doi: 10.1042/0264-6021:3630753. [DOI] [PMC free article] [PubMed] [Google Scholar]
- 28.Upston JM, Witting PK, Brown AJ, Stocker R, Keaney JF. Effect of vitamin E on aortic lipid oxidation and intimal proliferation after arterial injury in cholesterol-fed rabbits. Free Radical Bio Med. 2001;31:1245–1253. doi: 10.1016/s0891-5849(01)00721-3. [DOI] [PubMed] [Google Scholar]
- 29.Porter NA, Weber BA, Weenen H, Khan JA. Autoxidation of polyunsaturated lipids. Factors controlling the stereochemistry of product hydroperoxides. J Am Chem Soc. 1980;102:5597–5601. [Google Scholar]
- 30.Porter NA, Wujek DG. Autoxidation of polyunsaturated fatty acids, an expanded mechanistic study. J Am Chem Soc. 1984;106:2626–2629. [Google Scholar]
- 31.Tallman KA, Pratt DA, Porter NA. Kinetic products of linoleate peroxidation: Rapid beta-fragmentation of nonconjugated peroxyls. J Am Chem Soc. 2001;123:11827–11828. doi: 10.1021/ja0169724. [DOI] [PubMed] [Google Scholar]
- 32.Pratt DA, Mills JH, Porter NA. Theoretical calculations of carbon-oxygen bond dissociation enthalpies of peroxyl radicals formed in the autoxidation of lipids. J Am Chem Soc. 2003;125:5801–5810. doi: 10.1021/ja034182j. [DOI] [PubMed] [Google Scholar]
- 33.Tallman KA, Roschek B, Porter NA. Factors Influencing the Autoxidation of Fatty Acids: Effect of Olefin Geometry of the Nonconjugated Diene. J Am Chem Soc. 2004;126:9240–9247. doi: 10.1021/ja049104q. [DOI] [PubMed] [Google Scholar]
- 34.Tallman KA, Rector CL, Porter NA. Substituent Effects on Regioselectivity in the Autoxidation of Nonconjugated Dienes. J Am Chem Soc. 2009;131:5635–5641. doi: 10.1021/ja900040d. [DOI] [PMC free article] [PubMed] [Google Scholar]
- 35.Bowry V, Ingold KU. The unexpected role of vitamin E (alpha-tocopherol) in the peroxidation of human low-density lipoprotein. Acc Chem Res. 1999;32:27–34. [Google Scholar]
- 36.Burton G, Ingold KU. Vitamin E: application of the principles of physical organic chemistry to the exploration of its structure and function. Accounts of chemical research. 1986;19:194–201. [Google Scholar]
- 37.Culbertson SM, Antunes F, Havrilla CM, Milne GL, Porter NA. Determination of the alpha-tocopherol inhibition rate constant for peroxidation in low-density lipoprotein. Chem Res Toxicol. 2002;15:870–876. doi: 10.1021/tx020012t. [DOI] [PubMed] [Google Scholar]
- 38.Xu L, Davis TA, Porter NA. Rate Constants for Peroxidation of Polyunsaturated Fatty Acids and Sterols in Solution and in Liposomes. J Am Chem Soc. 2009;131:13037–13044. doi: 10.1021/ja9029076. [DOI] [PMC free article] [PubMed] [Google Scholar]
- 39.Yin H, Musiek E, Gao L, Porter NA, Morrow JD. Regiochemistry of neuroprostanes generated from the peroxidation of docosahexaenoic acid in vitro and in vivo. J Biol Chem. 2005;280:26600–26611. doi: 10.1074/jbc.M503088200. [DOI] [PubMed] [Google Scholar]
- 40.Gao L, Zackert WE, Hasford JJ, Danekis ME, Milne GL, Remmert C, Reese J, Yin H, Tai HH, Dey SK, Porter NA, Morrow JD. Formation of Prostaglandins E2 and D2 via the isoprostane pathway: a mechanism for the generation of bioactive prostaglandins independent of cyclooxygenase. J Biol Chem. 2003;278:28479–28489. doi: 10.1074/jbc.M303984200. [DOI] [PubMed] [Google Scholar]
- 41.Yoshida Y, Kodai S, Takemura S, Minamiyama Y, Niki E. Simultaneous measurement of F2-isoprostane, hydroxyoctadecadienoic acid, hydroxyeicosatetraenoic acid, and hydroxycholesterols from physiological samples. Anal Biochem. 2008;379:105–115. doi: 10.1016/j.ab.2008.04.028. [DOI] [PubMed] [Google Scholar]
- 42.Morrow JD, Roberts LJ., Jr Mass spectrometric quantification of F2-isoprostanes in biological fluids and tissues as measure of oxidant stress. Methods Enzymol. 1999;300:3–12. doi: 10.1016/s0076-6879(99)00106-8. [DOI] [PubMed] [Google Scholar]
- 43.Milne GL, Seal JR, Havrilla CM, Wijtmans M, Porter NA. Identification and analysis of products formed from phospholipids in the free radical oxidation of human low density lipoproteins. J of Lipid Res. 2005;46:307–319. doi: 10.1194/jlr.M400311-JLR200. [DOI] [PubMed] [Google Scholar]
- 44.Hamann HJ, Hoft E, Mostowicz D, Mishnev A, Urbanczyk-Lipkowska Z, Chmielewski M. New optically pure sugar hydroperoxides. Synthesis and use for enantioselective oxygen transfer. Tetrahedron. 1997;53:185–192. [Google Scholar]
- 45.Dufour C, Loonis M. Regio- and stereoselective oxidation of linoleic acid bound to serum albumin: identification by ESI–mass spectrometry and NMR of the oxidation products. Chem Phys Lipids. 2005;138:60–68. doi: 10.1016/j.chemphyslip.2005.08.003. [DOI] [PubMed] [Google Scholar]
- 46.Roschek B, Tallman KA, Rector CL, Gillmore JG, Pratt DA, Punta C, Porter NA. Peroxyl radical clocks. J Org Chem. 2006;71:3527–3532. doi: 10.1021/jo0601462. [DOI] [PubMed] [Google Scholar]
- 47.Havrilla CM, Hachey DL, Porter NA. Coordination (Ag+) ion spray-mass spectrometry of peroxidation products of cholesterol linoleate and cholesterol arachidonate: High-performance liquid chromatography-mass spectrometry analysis of peroxide products from polyunsaturated lipid autoxidation. J Am Chem Soc. 2000;122:8042–8055. [Google Scholar]
- 48.Morrow JD. The isoprostanes: their quantification as an index of oxidant stress status in vivo. Drug Metabolism Reviews. 2000;32:377–385. doi: 10.1081/dmr-100102340. [DOI] [PubMed] [Google Scholar]
- 49.Groves JT, Ma KW. Dehalogenations with sodium borohydride. Evidence for a free radical reaction. J Am Chem Soc. 1974;96:6527–6529. [Google Scholar]
- 50.Porter NA, Cudd MA, Miller RW, McPhail AT. A fixed-geometry study of the SH2 reaction on the peroxide bond. J Am Chem Soc. 1980;102:414–416. [Google Scholar]
- 51.Porter NA, Zuraw PJ, Sullivan JA. Peroxymercuration-demercuration of lipid huydroperoxides. Tet Lett. 1984;25:807–810. [Google Scholar]
- 52.Ryu I, Uehara S, Hirao H, Fukuyama T. Tin-free Giese reaction and the related radical carbonylation using alkyl iodides and cyanoborohydrides. Org Lett. 2008;10:1005–1008. doi: 10.1021/ol7031043. [DOI] [PubMed] [Google Scholar]
- 53.Tallman KA, Roschek, Porter NA. Factors influencing the autoxidation of fatty acids: effect of olefin geometry of the nonconjugated diene. J Am Chem Soc. 2004:9240–9247. doi: 10.1021/ja049104q. [DOI] [PubMed] [Google Scholar]
Associated Data
This section collects any data citations, data availability statements, or supplementary materials included in this article.