

Abstract
Spatial computations underlying the coordination of the hand and eye present formidable geometric challenges. One way for the nervous system to simplify these computations is to directly encode the relative position of the hand and the center of gaze. Neurons in the dorsal premotor cortex (PMd), which is critical for the guidance of arm-reaching movements, encode the relative position of the hand, gaze, and goal of reaching movements. This suggests that PMd can coordinate reaching movements with eye movements. Here, we examine saccade-related signals in PMd to determine whether they also point to a role for PMd in coordinating visual–motor behavior. We first compared the activity of a population of PMd neurons with a population of parietal reach region (PRR) neurons. During center-out reaching and saccade tasks, PMd neurons responded more strongly before saccades than PRR neurons, and PMd contained a larger proportion of exclusively saccade-tuned cells than PRR. During a saccade relative position-coding task, PMd neurons encoded saccade targets in a relative position code that depended on the relative position of gaze, the hand, and the goal of a saccadic eye movement. This relative position code for saccades is similar to the way that PMd neurons encode reach targets. We propose that eye movement and eye position signals in PMd do not drive eye movements, but rather provide spatial information that links the control of eye and arm movements to support coordinated visual–motor behavior.
Introduction
Hand–eye coordination allows the fovea to guide skilled manual behavior by coupling two very different mechanical systems. The intrinsic coordinate system of the eye, defined by the six oculomotor muscles, has only rotational degrees of freedom (Westheimer, 1957; Tweed and Vilis, 1987). In contrast, the hand is part of a multijoint system whose intrinsic coordinates have many rotational and translational degrees of freedom (Soechting and Flanders, 1992; Shadmehr and Wise, 2005). Directly coupling these two systems presents a formidable geometric challenge (Henriques and Crawford, 2002; Blohm and Crawford, 2007). Instead of using intrinsic representations specific to each effector, the brain may use visual representations of space for planning both movements (Crawford et al., 2004). Visual space is extrinsic, defined independently of the musculature, and so simplifies the geometry of coordination. As a result, encoding hand–eye coordination in an extrinsic, visual space for both hand and eye movements may be more efficient than coordinating movements using the intrinsic spaces of the hand and eye.
Recent work investigating reaching in the dorsal premotor area (PMd) of the frontal cortex provides new evidence in support of a role for PMd in coordinating eye and hand movements (Pesaran et al., 2006). Neurons in PMd are responsive to arm movements (Caminiti et al., 1990b; Weinrich and Wise, 1982; Weinrich et al., 1984) and encode reach plans in a relative position code that is defined in a coordinate space common to both the hand and eye (Pesaran et al., 2006). A relative position code is different from encodings centered on either the hand or gaze and may reflect an encoding of extrinsic space for both eye and hand movements. Activity depends on the relative position of the hand and gaze and the position of a reach target encoded with respect to both hand and eye position. PMd encodes three vectors: the vector connecting gaze position to the movement target, TG, the vector connecting hand position to the movement target, TH, and the relative position of the hand and gaze, HG. Relative position codes are evidence of cross-coupling between oculomotor and manual representations and allow direct visual–motor transformations between gaze-centered and hand-centered vectors (Buneo and Andersen, 2006). As a result, relative position codes are useful for coordinating the hand and eye.
Gaze-related discharge has been previously observed in PMd (Boussaoud et al., 1998; Jouffrais and Boussaoud, 1999; Fujii et al., 2000; Lebedev and Wise, 2001; Cisek and Kalaska, 2002; Ohbayashi et al., 2003), but the spatial properties of saccade-related activity in PMd have not been determined or compared with the spatial properties of reach-related activity and the spatial encoding of saccade discharges in PMd have not been determined. If PMd coordinates reaches with saccades, PMd should have two properties in addition to relative position coding before reaches. First, PMd should be active before saccades as well as reaches. Second, saccade-related activity in PMd should follow a relative position code and encode hand, gaze, and target position. We performed two experiments to test these predictions. First, we compared the activity of a population of PMd neurons during a center-out task involving a reach without a saccade and a center-out task involving a saccade without a reach. To compare the strength of saccade-related responses in PMd with those in a reaching area of parietal cortex, we also recorded a population of neurons from the parietal reach region (PRR) under identical conditions. In the second experiment, we determined how activity in PMd encodes saccades using a relative position-coding task for saccades. In this task, we varied the position of the hand across a range of positions while systematically instructing saccadic eye movements between several different initial and final gaze positions. Analyzing the pattern of response matrices across all three spatial variables allowed us to identify the spatial encoding of saccade activity in PMd.
Materials and Methods
Experimental preparation.
Two male rhesus monkeys (Macaca mulatta) participated in the experiments. Recording chambers were implanted in frontal and posterior parietal cortex in the right hemisphere of each animal. Structural magnetic resonance imaging was used to identify the position of the arcuate sulcus and intraparietal sulcus and guide placement of the recording chambers to give access to cortex medial to each sulcus. Recording sites were the same as those presented in Pesaran et al. (2006). In both animals, PMd recordings were made within the cortical gyrus within 1.5 mm of the cortical surface and PRR recordings were made within the medial bank of the intraparietal sulcus 4–9 mm below the cortical surface. At a subset of recording sites in the frontal chamber of each monkey, microstimulation through the recording electrode evoked movements of the hand, arm, and occasionally leg with a threshold >40 μA (330 Hz, 400 μs monopolar pulse width), consistent with published reports for PMd (Crammond and Kalaska, 1996). Low-threshold, <80 μA, saccades were not evoked at any recording site, consistent with published reports for the caudal portion of PMd (Fujii et al., 2000). All surgical and animal care procedures were done in accordance with National Institute of Health guidelines and were approved by the California Institute of Technology Animal Care and Use Committee.
Neural recordings were made using multiple-electrode microdrives (three- or five-electrode, Thomas Recording). During each session neural activity from each electrode was passed through a headstage (20×, Thomas Recording), filtered (1 Hz to 10 kHz; custom), amplified (500–1000×; TDT Electronics), digitized (20 kHz; National Instruments), and continuously recorded to disk for further analysis (custom C and Matlab code).
Behavioral tasks.
For all tasks, reaches were made with the left arm on a touch-sensitive screen (ELO Touch Systems) and eye position was monitored with a scleral search coil (CNC Engineering). Visual stimuli were presented on an LCD display (LG Electronics) placed behind the touch screen. The eye coil signal was calibrated so that its signal corresponded to the intercept of gaze on the screen. All measures and mathematics were done in screen coordinates. Since we studied relatively small gaze angles, <30°, the difference between calculations in screen coordinates approximate calculations in gaze coordinates. In the following we refer to all spatial coordinates in degrees of visual angle for the cyclopean eye of the subject. Red circles instructed the animal where to fixate the eyes. Green circles instructed the animal where to touch. All trials began with the illumination of a red and green circle which the animal needed to fixate with his eyes and touch with his hand, respectively, and hold for a baseline period (∼1000 ms). Saccade and reach trials were presented in separate blocks of trials.
In the saccade tasks (Fig. 1A,C), a second red circle was illuminated after the baseline period indicating the target of the saccade. After a 1–1.5 s delay period, the red circle the animal was fixating was extinguished, providing the go signal for the animal to make a saccade to the red target while maintaining touch on the initial green circle. After the saccade, the animal had to fixate the second red circle while maintaining a touch on the green circle for 300 ms. In the reach tasks (Fig. 1B; supplemental Fig. S3, available at www.jneurosci.org as supplemental material), a second green circle was illuminated indicating the target of the reach. A 1–1.5 s delay period followed during which the animal had to withhold his response until the initial hand fixation green circle was extinguished, providing the go signal to reach to the green target circle while maintaining eye fixation on the initial red circle. After the reach, the animal had to touch the second green circle while maintaining fixation on the red circle for 300 ms. Reaches needed to be completed within 700 ms of the instruction to move or the trial was aborted. The spatial configurations of the initial gaze position, initial hand position, and target position varied between tasks. In the center-out tasks the initial hand and gaze position were placed next to each other directly in front of the animal and eight targets were placed on a grid spaced 10° around this point (Fig. 1A,B). In the relative position-coding task initial gaze position was varied across four locations spaced 10° on a horizontal line, initial hand position was varied across the same four locations and the positions of the saccade target and reach target were varied across four locations spaced 10° on a horizontal line either 10° above or below the initial hand and gaze positions (Fig. 1C; supplemental Fig. S3, available at www.jneurosci.org as supplemental material). Targets were placed above or below the initial position to best activate the cell(s) being recorded. The full experimental design for the relative position-coding task involved collecting responses during four gaze positions, four hand positions and four target positions for a total of 64 conditions. We obtained a complete dataset during the saccade relative position-coding task from a total of 116 PMd neurons in two animals.
Figure 1.

Behavioral tasks. A, Center-out task for saccades involved the monkey touching a central target while making a saccade from an adjacent location to one of eight peripheral targets arranged on a square spaced 10°. The lower target is not shown for clarity. B, Center-out task for reaches involved the monkey fixating a central target while making a reach from an adjacent location. C, Saccade relative position-coding task. A saccade is made from one of four initial gaze positions on a line to one of four target positions while a touch is maintained at one of four hand positions on a touch screen. Hand positions and reach targets are shown in green, and gaze positions and saccade targets are shown in red.
The current study forms a companion to Pesaran et al. (2006), which studied the relative position-coding task for reaches. In supplemental material (available at www.jneurosci.org), we present complete datasets from 111 PMd neurons in the same animals recorded during the reach relative position-coding task, previously reported in Pesaran et al. (2006). Since the saccade relative position-coding task forms the focus of this study, we present the methodological details of the reach tasks here, but postpone the presentation of results involving the reach tasks to supplemental material (available at www.jneurosci.org).
We used visually guided and not memory-guided movements. As a result, we cannot eliminate the role of visual signals in driving the activity of these neurons. It is worth noting however, that any influence of hand position on the responses we report could not be simply explained by visually driven activity. Moreover, we do not believe the use of visually guided movements contributes to any differences we report between saccade and reach responses. The reason is that we only presented analysis of activity during the delay period of each task and do not include analysis of activity around the time of the visual “go” cue and the subsequent movement, at which time visual conditions between the two tasks differ. During the delay before movement, the visual illumination conditions are essentially the same and differ in terms of the color of the cue, red for saccade and green for reach.
We measure reach endpoint time by the time when the touch screen reports a new touch. We measure the time of the saccade by the first time eye velocity exceeds 200°/s following the visual instruction to make a saccade.
Data collection and analysis.
Data collection and analysis were performed in the manner described by Pesaran et al. (2006). All cells that were recorded for an average of at least three trials per condition in either the relative position-coding task or center-out tasks were included in the database regardless of task response. Cells were first isolated and, if stable, recorded during the center-out task for both reaches and saccades. Spike waveforms were extracted and classified during the recording session to guide recordings. Waveforms were then resorted off-line using a semiautomatic clustering procedure that tracked clusters across time. The baseline period was defined as the 300 ms interval ending 200 ms before target onset. The delay period was defined as the 500 ms interval starting 500 ms after target onset. Each task was recorded in consecutive separate blocks.
In the center-out task, tuning was significant if the trigonometric moment of the tuning curve was significantly greater than that when the trial conditions were randomized (Crammond and Kalaska, 1996) (randomization test). The trigonometric moment was calculated by taking a vector element given by each movement direction multiplied by the firing rate in that direction and averaging all eight vectors in the tuning curve. The preferred direction was given by the direction of the trigonometric moment of the tuning curve. All randomization tests were done based on at least 10,000 randomizations.
Kuiper's test was used to test the hypothesis that the distribution of preferred directions, or differences, for a population of neurons recorded during the center-out tasks was uniform (Batschelet, 1981). If a population of preferred directions, or differences, was significantly nonuniform, Rayleigh's test was used to test the hypothesis that the distribution of preferred directions, or differences, for a population of neurons was unimodal.
In the relative position-coding tasks, response matrices were characterized with a combination of singular value decomposition (SVD) and gradient-orientation analyses (Peña and Konishi, 2001; Buneo et al., 2002; Pesaran et al., 2006). For the gaze–hand–target analysis, the response to pairs of variables was determined by holding the third variable constant at the response field peak and analyzing the resulting two-dimensional matrix. This procedure only characterizes spatial coding at the response field peak and not in the flanks of the response field. It is possible that neural coding differs in the response field flanks compared with the response field peak, but since reduced signal-to-noise makes it more difficult to determine the encoding, we focus on activity around the response field peak.
The SVD analysis was used to test whether each variable was separable from the others or not. Separability was defined by a significantly (p < 0.05) large first singular value compared to the first singular value calculated when trial conditions were randomized (randomization test). Thus, instead of referring to the strength of separability, which would be given by the magnitude of the first singular value compared with the others, we classified tuned responses as separable or inseparable according to the p = 0.05 threshold. A mean value was subtracted from the measured neuronal response matrix before performing the SVD.
It is possible that the procedure we used to define separability may be sensitive to the amount of data that is collected. If the sensitivity of the test changes substantially with the number of trials collected per condition, the number of neurons classified as separable might increase if the number of trials collected per condition is increased. In supplemental Methods (available at www.jneurosci.org as supplemental material), we tested whether the procedure for determining separability suffered this form of estimation bias. We simulated idealized separable and inseparable responses, presented below. We found that while there was an effect of the number of trials collected per condition, estimation bias is not appreciable and the procedure is able to detect the presence of a gain field with as few as three trials per condition (see supplemental Fig. S1, available at www.jneurosci.org as supplemental material).
Gradient analysis was used to determine the orientation of the response field by computing the two-dimensional gradient of the response (estimated using the MATLAB gradient function), doubling the angles to account for symmetric response fields, and summing the gradient elements. The response to pairs of variables was considered tuned if the resultant gradient length was significantly greater than the length of the resultant gradient when trial conditions were randomized (randomization test).
Intuition on response matrix analysis.
To provide intuition on how the matrix analyses distinguish different neural responses, we present activity simulated from idealized neurons encoding gaze and target position either as a vector or using gain fields (Fig. 2). Similar procedures can be used to consider any combination of variables, such as gaze and hand position, instead of gaze and target position. Vector encoding of gaze position and target position was simulated using a Gaussian response field according to the difference between gaze position and target position (Fig. 2A):
Figure 2.

Example simulated responses and analysis. A, Vector response field f(G, T) = f(T − G) decomposed by singular value decomposition analysis and gradient analysis. The first two matrix responses in the singular value decomposition are shown. The fraction of the total variance they capture is given beneath each matrix. The response field orientation from the gradient analysis is shown on the rightmost column. B, Intermediate response field. f(G, T) = f(T − G/2). C, Intermediate response field. f(G, T) = f(T − 2G). D, Weak gain field of eye position modulating target position coding. E, Moderate eye position gain field. F, Strong eye position gain field. White, High firing rate. Black, Low firing rate. For the response field orientation, 0° points right and angles increase counterclockwise.
Neural firing is represented by f(G, T). Gaze position is represented by G. Target position is represented by T. Altering the weighting of target and gaze position in the argument to the exponential function can give intermediate encodings, which are represented mathematically as f(G, T) = f(T − αG), where α ≠ 1 (α = 1/2, Fig. 2B; α = 2, Fig. 2C):
Gain field encoding of gaze position was simulated using a sigmoidal function of gaze position modulating a Gaussian response of target position (Fig. 2D–F):
We varied the strength of the gain field by varying the amplitude of the slope of the sigmoid, k. A weak gain field was simulated with a small value for k; moderate gain field was simulated with an intermediate value for k; strong gain field was simulated with a relatively large value for k.
The primary difference between the response fields is reflected in the functional dependence on G and T. In a vector encoding, G and T appear as arguments to the same function and are inseparable: f(G, T) = f(T − αG). In a gain field, G and T appear as arguments to different functions and are multiplicatively separable: f(G, T) = g(G)t(T).
We captured separability using a singular value decomposition analysis. Singular value decomposition decomposes the response matrix into a weighted sum of matrices each of which represents G and T as a separable product:
The weights, λi, called singular values, mathematically capture the degree to which the outer products of the corresponding singular vectors (gi, ti) contribute to the total variance of the response matrix. If gaze and target position are inseparable, the response matrix cannot be captured with one term and other separable terms are needed to model the inseparable response (Fig. 2A–C). If gaze and target position are separable in the response matrix, the singular value for the first matrix will be large and the matrix decomposition contains only one significant term (Fig. 2D–F). Importantly, the singular value decomposition analysis does not appreciably depend on how strongly the response is modulated by the gain field (see supplemental Fig. S1, available at www.jneurosci.org as supplemental material).
We combined the singular value decomposition with a gradient analysis that measured the response field orientation. Intuitively, the response field orientation compares how much neural firing changes with changes in either positional variable. This lets us measure whether neural firing changes more when the position of the target is shifted or when the position of gaze is shifted. If the response encodes gaze and target position as a vector with equal influences, the response field orientation points toward T − G (Fig. 2A). Response field orientation also detects intermediate vector response fields. If a vector response field has intermediate encoding with gaze influencing activity less than target position (α < 1), the response field orientation points away from T − G toward T (Fig. 2B). Similarly, if a shift of gaze influences the activity more than a shift in target position (α > 1), the orientation points away from T − G and toward G (Fig. 2C).
Different gain field effects are also apparent in the response field orientation. When the gain field of gaze position is weak, the response field orientation is directed mainly toward target position (Fig. 2D). As the strength of the gain field increases, the orientation of the response field rotates toward gaze position (Fig. 2E), and can even point near T − G similar to the response field orientation of the vector encoding response. This reflects the fact that changes in gaze and target position have comparable effects on neural firing. When gaze strongly modulates firing, the response field orientation points toward gaze (Fig. 2F).
As the above illustrates, gain fields and vector coding can influence response fields in similar but distinguishable ways. Therefore, we used a combination of both singular value decomposition and gradient analyses rather than either analysis taken alone to correctly identify the encoding of response vectors and gain fields in neural activity. The principal limitations of matrix analysis are that the analysis averages responses across the neural response field. This could be misleading when neurons have variable responses across space and when neurons have bimodal response fields.
Results
The database for this study consisted of neurons recorded in two experiments. In the first, effector, experiment, 298 PMd neurons (217 in monkey E, 81 in monkey Z) were recorded during the saccade and reach center-out tasks. In the second, relative position-coding, experiment, 116 PMd neurons (62 in monkey E, 54 in monkey Z) were recorded during the saccade relative position-coding task.
In supplemental material (available at www.jneurosci.org), we present results from 140 PRR neurons (91 in monkey E, 49 in monkey Z) that were recorded during the center-out tasks under identical conditions as the PMd neurons. We also present results from a population of 111 PMd neurons (38 in monkey E, 73 in monkey Z) recorded during the reach relative position-coding task that were the focus of an earlier study (Pesaran et al., 2006).
Saccade-related activity in PMd
Responses to the saccade and reach center-out tasks for two example PMd cells are shown in Figure 3, A and B. These example neurons illustrate how cells in PMd responded robustly before both reaches and saccades to their preferred direction (p < 0.05, rank-sum test, both neurons) with delay period activity that was stronger for reaches than saccades (p < 0.05, rank-sum test, both neurons). To assess how strongly the population of neurons in each area responded to each movement, we calculated the firing rate for the preferred direction normalized (divided) by the baseline activity, aligned in time to target onset and averaged over all cells recorded from each area (Fig. 4A,B). As expected, during the delay period before movement, PMd neurons responded more strongly before reaches than saccades (Fig. 4A) (p < 0.05, rank-sum test). Surprisingly, PMd showed sustained delay activity before saccades that was significantly greater than baseline activity and was nearly as strong as it was before reaches (Fig. 4A) (p ≪ 0.001, rank-sum test). In comparison, saccade activity in PRR was weaker and barely greater than baseline (Fig. 4B) (p = 0.33, rank-sum test).
Figure 3.
Example PMd cell responses. A, Rasters and peristimulus time histograms for activity of an example cell to a reach without a saccade (black) and a saccade without a reach (blue). Time of the cue onset (triangle), end of delay period (green cross), saccade onset time (red square), reach start time (green circle), and reach end time (green x) are shown. B, Same as A for another PMd cell.
Figure 4.
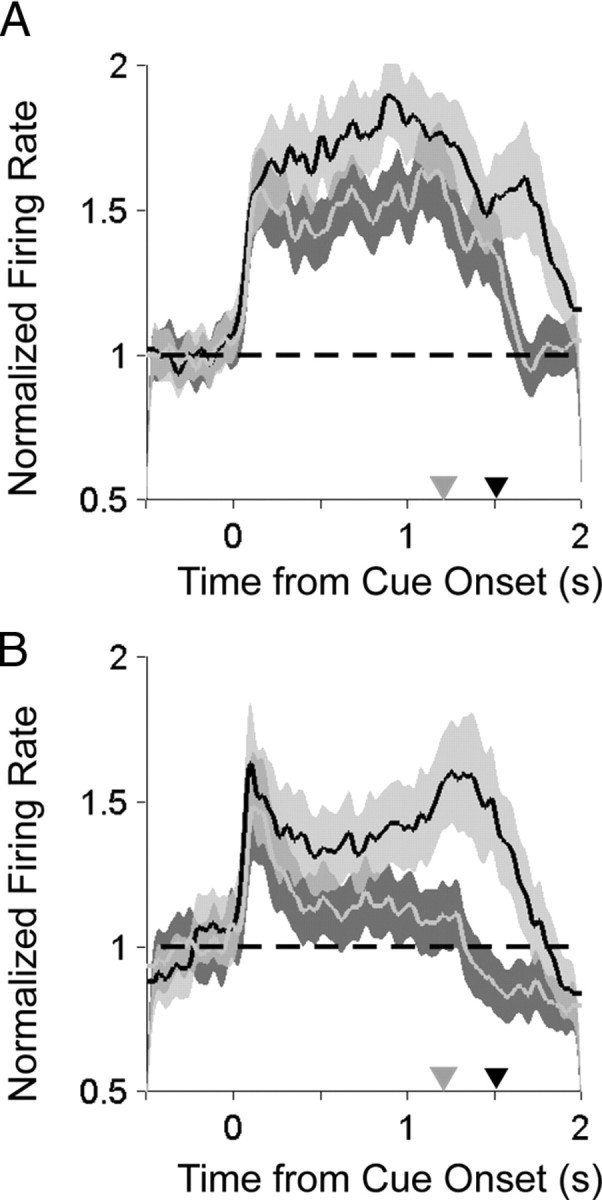
Comparison of saccade- and reach-related activity during the center-out tasks. A, Population average normalized histograms aligned to target onset for reaches (black) and saccades (gray) to the preferred direction. Gray triangle, Mean time of saccade; black triangle, mean time of reach endpoint. B, Same for PRR.
The spatial tuning of the PMd response to saccades could be seen on a cell-by-cell basis. Across the population of 298 PMd cells, 174 cells were spatially tuned to either reaches or saccades. As proportions of the 174 spatially tuned cells, 71 cells (71/174; 41%) were exclusively tuned to reaches and not saccades, 37 cells (37/174; 21%) were exclusively tuned to saccades and not reaches and 66 cells (66/174; 38%) were tuned to both reaches and saccades (see Table 1).
Table 1.
Proportions of tuned PMd and PRR neurons that are selective for reach and saccade movements
| PMd neurons (174 tuned cells) |
PRR neurons (102 tuned cells) |
||||
|---|---|---|---|---|---|
| Reach only | Saccade only | Reach and saccade | Reach only | Saccade only | Reach and saccade |
| 71/174 (41%) | 37/174 (21%) | 66/174 (38%) | 42/102 (41%) | 12/102 (12%) | 48/102 (47%) |
We examined a population of PRR neurons recorded under identical conditions for comparison with the PMd neurons (supplemental material, available at www.jneurosci.org). The difference between the proportion of tuned, saccade-only PMd neurons (37/174) and tuned, saccade-only PRR neurons (12/102) was highly significant (two-sample binomial test, p ≪ 0.001). Thus, PMd contains a larger proportion of exclusively saccade-tuned cells than PRR.
Saccade-related delay activity could coordinate the hand and eye by guiding the eye to the same location as the hand. We examined this by testing whether cells that were tuned to both movements had preferred directions that pointed in the same direction. We recorded 66 PMd neurons (43 in monkey E; 23 in monkey Z) that were spatially tuned to both reaches and saccades during the delay period (p < 0.05). The distribution of preferred directions for the saccade task was weakly nonuniform (saccade p = 0.04; Kuipers test) but not unimodal (p = 0.64; Rayleigh test) (Fig. 5A). The distribution of preferred directions for the reach task was not significantly different from uniform (reach p = 0.065, Kuipers test) (Fig. 5B). The difference in preferred directions of PMd neurons to reaches and saccades was unimodal (Rayleigh test; p ≪ 0.001), and the mean difference peaked at ∼19° (Fig. 5C). This result demonstrates that there is a propensity of cells whose preferred directions align, but that there are also cells whose preferred directions do not align. Cells with responses that do not align may be needed for situations in which gaze and the hand are decoupled.
Figure 5.

Population histograms preferred directions of PMd neurons. A, Histogram of preferred direction of activity during delay period before saccades. B, Histogram of preferred direction of activity during delay period before reaches. C, Histogram of difference in preferred directions during delay periods before saccades and reaches. Asterisk marks the mean preferred direction difference. Preferred directions before a reach and saccade point in similar directions.
A relative position code for saccades
Saccade-related activity in PMd during the center-out task had a similar temporal profile and directional tuning to reach-related activity. This suggests it could serve to coordinate eye and hand movements. To determine whether saccade-related activity could be related to eye–hand coordination, we measured the spatial encoding of a population of PMd neurons by recording their activity during the saccade relative position-coding task (Fig. 1C). If this saccade-related activity is involved in spatial coordination, the spatial encoding would follow a relative position code in which changes in gaze position and hand position equally modulate activity. Alternatively, if PMd is exclusively involved in transforming reaches between different coordinates, it would not be expected to represent the vector TG at all during the saccade relative position-coding task. As another alternative, if saccade-related activity in PMd is exclusively involved in the execution of saccade motor plans, spatial encoding will more exclusively represent the saccade target relative to gaze position (vector TG) and will be relatively insensitive to changes in hand position.
Figure 6 presents the hypotheses and formal models of relative position coding and gaze-centered coding and demonstrates how they can be distinguished using response matrix analysis. Response matrix analysis analyzes the spatial encoding of neural activity and was previously developed and applied to determine the spatial encoding of reach-related activity in PMd. Responses are represented as three two-dimensional matrices at the response field peak consisting of the firing rate at each of four target and gaze positions (target–gaze, TG), hand and gaze positions (hand–gaze, HG), and target and hand positions (target–hand, TH). Matrix representations let us distinguish between gaze-centered and relative position codes by assessing the separability, determined from a singular value decomposition, and response field orientation, determined from a gradient analysis, for each of the three response matrices.
Figure 6.

A, B, Idealized cell responses and formal models for gaze-centered (A) and relative position-coding (B) cells. The idealized gaze-centered cell response shown is modeled as a gain field of hand position modulating target–gaze vector coding. In the formal model, an additional gain field of gaze position can affect the cell's firing rate as well. The idealized relative position-coding cell response shown is modeled as hand–gaze, target–gaze, and target–hand position tuning. In the formal model, gain fields of gaze position and hand position can also affect the cell's firing rate as well. The response field orientation from the gradient analysis (see Results and Methods) is shown for each idealized cell. 0° points right and angles increase counterclockwise. White, High firing rate. Black, Low firing rate.
If the response follows a gaze-centered code, the TG response matrix will be inseparable with a response orientation directed toward T − G, while the HG and TH response matrices will be separable. Figure 6A shows a gaze-centered response with relatively little hand position modulation. Other cases with gain fields that modulate the activity more strongly and preserve the essential gaze-centered property of the response are possible (Fig. 2D–F). If the response follows a relative position code, TG, HG, and TH response matrices will all be inseparable. Figure 6B shows the responses as vectors in which gaze, hand, and target position modulate the response with equal strength. Intermediate responses in which changes in position could affect firing differently do not alter the essential relative position coding property of the response (Fig. 2A–C). Our analyses can distinguish between alternatives like the gaze-centered coding model and the general form of the relative position model, in which the expression of a cell's firing rate is an unspecified function of the three relative position vectors. For any response matrix, the possibility that it was created by gain fields alone can be ruled out by the separability analysis while the gradient analysis can show that the combination of the two variables that is encoded is the relative position between the two variables. However, to accurately distinguish between different forms of the general relative position model, for example to distinguish between additive and multiplicative operations, would require additional analysis of activity obtained under a larger range of gaze, hand, and target positions.
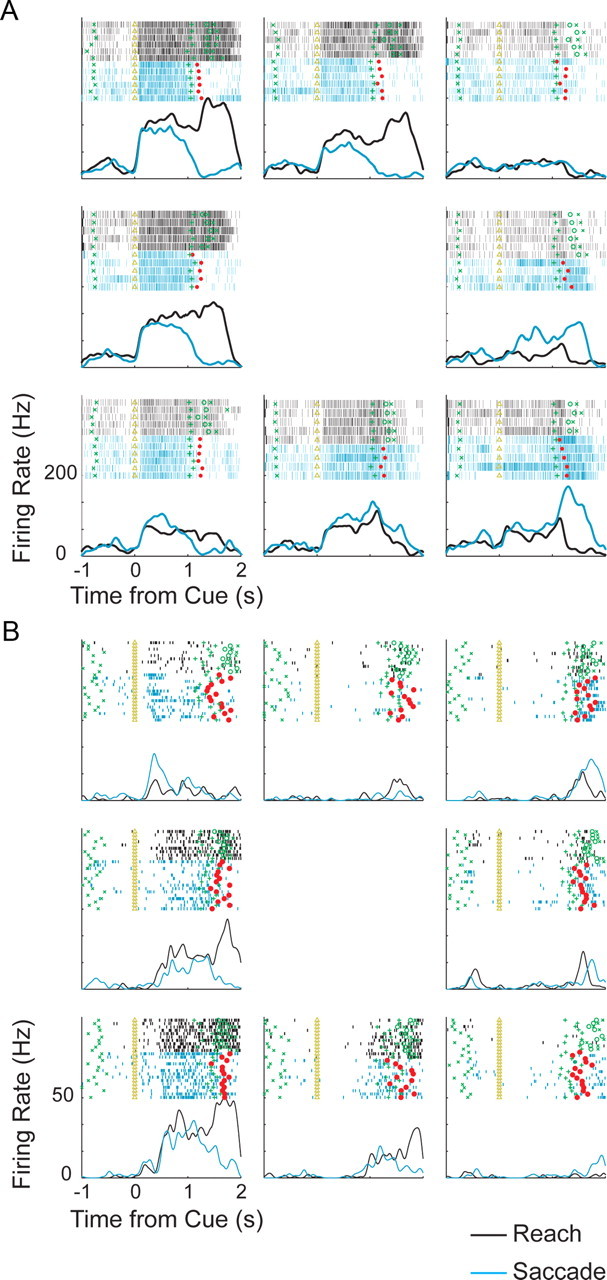
Figure 7 shows the response of an example cell to the saccade relative position-coding task. This cell responded very strongly to saccades with peak firing in excess of 100 Hz. The influence of changing either hand or gaze position can be seen by comparing rasters of the same color within either rows or columns, respectively. The influence of changing target position can be seen by comparing rasters of different colors within a panel. Changes in all three variables resulted in robust changes in neural firing.
Figure 7.

PMd example cell responses to the saccade relative position-coding task. Activity is aligned to target onset (black square) as gaze position is varied (rows), hand position is varied (columns), and target position is varied (within each panel). Gaze (G), hand (H), and target (T) positions are shown above each panel. Spike rasters are shown above the panel color coded for each target position in that panel. Target onset time (black square) and mean saccade time (gray square) are shown on each panel. Horizontal bars on the top left panel indicate the baseline and delay period analysis intervals.
Figure 8A–C plots the TG, HG, and TH response matrices for the example cell in Figure 7 during the delay period. The TG response is suppressed for the target to the right of the eye and increases as the target is moved further to the left of the eye. Similar effects are present for HG and TH responses. The TG, HG, and TH response matrices were inseparable for this cell, and their orientations revealed a dominance of eye and hand position over target position [TG response field orientation: −144° (Fig. 8D); HG response field orientation: −56° (Fig. 8E); TH response field orientation: −101° (Fig. 8F)].
Figure 8.

PMd example cell response matrices during the saccade relative position-coding task. A, Target–gaze response matrix during the delay period at the peak of the response field. The hand is at −20°. Arrows show the two-dimensional gradient elements. B, C, Similar for hand–gaze and target–hand response matrices with the target at −20° and gaze at 10°, respectively. D, Overall response field orientation for the TG response matrix, −144°. E, Overall response field orientation for the HG response matrix, −56°. F, Overall response field orientation for the TH response matrix, −101°. 0° points right and angles increase counterclockwise.
We found that a relative position code was present across the population of saccade-responsive PMd cells (Fig. 9). A significant number of neurons were tuned to the TG variable pair (36/116; 31%; p < 0.05, randomization test), the HG variable pair (44/116; 38%), and the TH variable pair (53/116; 46%). A majority of the tuned TG, HG, and TH responses of PMd neurons were inseparable (Fig. 9A) (TG: 28/36, 78%; HG: 32/44, 73%; TH: 39/53, 74%; p < 0.05). The response field orientation for these inseparable cells showed that the mean response field orientations pointed down (Fig. 9B–D) (TG: −118°; HG: −63°; TH: −74°). This means that response fields almost completely shifted when either the hand, gaze, or target position was moved with respect to one of the other variables. Together, these findings mean that the spatial encoding of saccade-related activity in PMd does not just encode the target relative to gaze position. Instead, the population of PMd neurons simultaneously encoded the target with respect to gaze, TG, the target with respect to the hand, TH, and relative hand–gaze position, HG.
Figure 9.

Population gaze–hand–target analysis during the delay period. A, Population separability for all PMd cells with tuned delay or movement period responses. The percentage of inseparable cells is show in dark gray. The percentage of separable cells is shown in light gray. B–D, Target–gaze response field orientation (B), hand-gaze response field orientation (C), and target–hand response field orientation (D) for tuned PMd neurons. Orientations for separable cells are shown in thick lines. Orientations for inseparable cells are shown in thin lines.
Comparing the spatial encoding for saccades and reaches
Examining the proportion of cells that encoded the different vectors in the saccade relative position-coding task, we found that some single cells showed a mixture of inseparable tuning to more than one vector, but the overall tendency was that individual cells encoded only one of the vectors (Fig. 10A). Of the 70 cells that encoded any single vector, 28 cells (28/70; 50%) encoded TG, 32 cells (32/70; 46%) encoded HG, and 39 cells (39/70; 56%) encoded TH. The sum of these proportions is >1 because a minority of cells simultaneously coded more than one of these vectors. We found 49 cells encoded either TG or HG, but only 11 cells (11/49; 22%) encoded them both. Similarly, we found 57 cells encoded either TH or HG, but only 14 cells (14/57; 25%) encoded them both. We also found 57 cells encoded either TG or TH, but only 10 cells (8/57; 18%) encoded them both. Of the 70 cells that encoded any one vector, only 6 cells encoded all three vectors (6/70; 9%).
Figure 10.
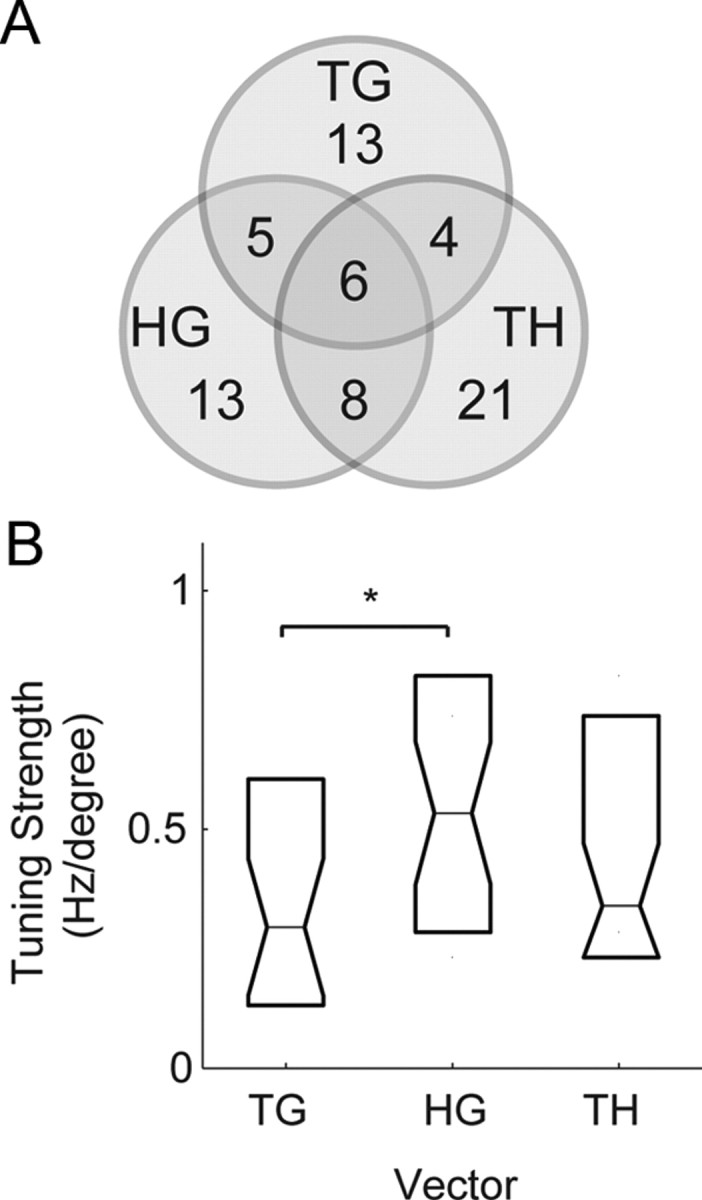
PMd delay period responses during the saccade relative position-coding task. A, Venn diagram of the number of neurons with tuned inseparable TG, TH, and HG responses during the saccade relative position-coding task. B, Tuning strength of the saccade response matrices. *Significant difference (p < 0.05).
The tuning strength of the saccade response matrices, determined by the magnitude of the resultant vector in the gradient analysis, revealed that the representations of TG, TH, and HG in PMd were different from each other (Fig. 10B). HG tuning was the greatest, followed by TH and then TG. The difference between HG and TG tuning was statistically significant (rank test; p < 0.05). The relatively weak encoding of TG indicates that saccade-related responses may not be simply related to retinotopic processes. The strength of HG tuning is consistent with a role for this activity in coordinating the hand with gaze.
Overall, these results show that at the population level saccade-related activity in PMd shares a similar relative position code to reach-related activity in this area, with some differences [see supplemental material (available at www.jneurosci.org) and Pesaran et al. (2006) for details of the reach-related activity]. Individual PMd cells do not combine information about TG, TH, and HG before saccades to the same extent as they do before reaches. Before saccades, PMd cells most strongly represent HG.
Discussion
In this study, we found that PMd neurons respond before saccades in a strong and sustained manner while neurons in parietal area PRR respond more transiently. We also found more exclusively saccade-tuned neurons in PMd than in PRR. Using a saccade relative position-coding task, we then showed that saccade responses in PMd follow a relative position code. We also observe hand–gaze coding in PMd during a baseline hold period without movement planning (see supplemental Fig. S5, available at www.jneurosci.org as supplemental material) and observe that PMd activity is strongest when the hand is ipsilateral to gaze (see supplemental Fig. S6, available at www.jneurosci.org as supplemental material). These results demonstrate that combined hand–gaze coding is a reliable feature in the response of PMd neurons and provide convincing evidence that saccade and gaze position signals in PMd provide spatial information that could link the control of eye and arm movements.
Common representations for coordination
A relative position code common to both reaches and saccades can guide coordinated eye–hand movements as it allows eye movements and reaching movements to be planned in the same spatial coordinate system. Another advantage of this common spatial coordinate system is that eye movement plans can be directly accessed to guide arm movement plans. Similarly, arm movement plans can be directly accessed to guide eye movement plans. Since hand and eye movements are typically directed toward the same locations during natural movements (Johansson et al., 2001; Land and Hayhoe, 2001), it is efficient to encode hand and eye movements in a common spatial representation (Gielen et al., 1984; van Donkelaar, 1997).
Earlier work studying neurons in frontal and parietal cortex that are involved in guiding eye and arm movements has shown neurons often have common tuning properties for different types of movements (Battaglia-Mayer et al., 2001, 2007). These “global tuning fields” are consistent with the overlap in the alignment of response fields we have observed in the center-out reach and saccade tasks (Fig. 4) and demonstrate the formation of common spatial representations for different movement modalities. Our work complements global tuning fields. We find that neurons in PMd exhibit the same spatial representation regardless of whether a saccade or a reach is being prepared. The wide range of preferred directions that we observe for PMd neurons (Fig. 5) is also consistent with earlier work that shows that neurons in PMd do not show a preference in response for arm movements to directions contralateral to the reaching arm (Caminiti et al., 1990a,b).
A relative position code is a suitable representation for coordinating eye and arm movements because it allows signals to be transformed between representations within a common coordinate frame. This spatial representation allows signals to be transformed from gaze-centered to hand-centered representations and to be transformed from hand-centered to gaze-centered representations for the relative translational locations of these variables in extrinsic space. This is because relative hand–gaze position links the representation of movement goals centered on the hand and eye. The linkage means that the reference frames are invertible by treating gaze and hand position on equal terms and encoding them as a difference. Extrinsic gaze-centered coordinates can be converted into extrinsic hand-centered coordinates by subtracting relative hand–gaze position. Extrinsic hand-centered coordinates can be converted into extrinsic gaze-centered coordinates by subtracting relative gaze–hand position (Buneo et al., 2002; Pesaran et al., 2006).
Since we observe a similar encoding before saccades and reaches, the same transformations may be activated by both movements. This suggests that a representation of visual space linked to the hand may also be useful for saccades. Consistent with this idea, evidence from human psychophysical experiments shows that gaze-centered representations may guide reaching (Henriques et al., 1998; Henriques and Crawford, 2002) and that the saccade system can transform hand-centered somatosensory signals into oculomotor coordinates (Ren et al., 2006). Other studies demonstrate that hand position modulates saccadic reaction times and frontal eye field (FEF) activity during a purely saccadic task (Thura et al., 2008a,b).
When considering a relative position code, it is important to keep in mind the geometry of rotations in which retinal projections at different eye positions are different for the same saccade vectors (Crawford and Guitton, 1997; Klier and Crawford, 1998; Blohm et al., 2007). The brain must use egocentric codes at least at the initial and final stages of the transformation, such as at the level of the eye-fixed retina and the various muscle insertions. Relative position vectors are represented differently in each of these rotating egocentric frames, like the eye, head, and shoulder. The differences between these representations become larger (in an experimentally measurable manner) at more eccentric orientations of these frames and during torsional tilts. Effects introduced by eccentric orientations are small in our experiment since we use a rather limited range of gaze and target positions around a central position. To strictly distinguish between visual and intrinsic frames of reference for relative position codes, one needs to use a larger range of gaze, target, and hand positions and/or systematically vary the torsional tilt of the eye and hand. The brain would make behavioral errors in transforming between them if it failed to account for the relative orientations of the egocentric frames but behavioral work shows that the brain does account for three-dimensional geometry. The corrections may be performed by the nonlinear transformations to the corresponding intrinsic coordinate frames (Crawford et al., 1997; Klier et al., 1998; Blohm et al., 2009).
Saccade responses in premotor cortex
The presence of stronger saccade planning activity in PMd than in PRR demonstrates that the PMd saccade response is not likely to result from input from PRR. Saccade signals in PMd may originate in frontal cortex. The FEFs and the supplementary eye fields (SEFs) are the main oculomotor control centers in the frontal cortex (Schlag and Schlag-Rey, 1987; Goldberg and Bruce, 1990; Schall and Thompson, 1999; Russo and Bruce, 2000). These areas have anatomical connections with nearby regions of frontal cortex involved in skeletomotor control, including the dorsal and ventral premotor cortices and the supplementary motor area (Huerta et al., 1987; Huerta and Kaas, 1990). Consequently, input from FEF and/or SEF may be reflected in the PMd response to saccades.
While the premotor cortices are principally implicated in the control of visually guided limb movements (Mushiake et al., 1991; Wise et al., 1997), microstimulation elicits saccades from regions in both PMd and PMv and neurons in both these areas are active before saccades as well as reaches (Mitz and Godschalk, 1989; Fujii et al., 1998, 2000). The functional significance of these saccade responses, however, has remained unclear. Convergent evidence suggests that saccade responses in PMd are not directly involved in the control of eye movements, and may link the control of eye movements with the control of arm movements as part of a distributed cortical network including SEF and FEF.
Evidence from microstimulation suggests that the saccade responses we observe are not closely associated with saccade commands because we evoked muscle twitches and not saccades with electrical microstimulation at those sites. In contrast, microstimulation of SEF and FEF elicits eye movements. In the FEF, microstimulation elicits eye movements with currents below 50 μA and as low as 10 μA (Bruce et al., 1985). In the SEF, microstimulation also elicits saccades at current levels as low as 20 μA (Schlag et al., 1987), but at higher current levels than FEF (Russo and Bruce, 1993).
The anatomical projections of PMd also suggest that PMd plays a direct role in reaching and not saccades. PMd neurons have a relatively minor projection to the superior colliculus (Fries, 1985) and hence to downstream oculomotor structures, and they have a much more substantial projection to the spinal cord (He et al., 1993; Dum and Strick, 2002).
Single-unit recordings also show that instead of having overlapping responsibilities with PMd, SEF, and FEF are more directly involved in saccade control and PMd is more directly involved in reach control. The spatial encoding of PMd neurons for saccades that we have demonstrated appears distinct from the encoding in SEF and FEF. Saccade responses in PMd are predominantly not retinotopic and there is a strong dependence of the response on the relative position of the hand and gaze. Hand position influences saccade signals in FEF (Thura et al., 2008b) with a strong dependence on the orientation of eye and head. An influence of hand position on saccade responses in SEF has not been previously shown although SEF neurons have been shown to selectively respond to reaches made with saccades (Mushiake et al., 1996). Additional work is needed to measure hand position signals in FEF and SEF before saccades to more directly compare with the representation of PMd neurons for saccades. Instead of playing a direct role in saccadic eye movement generation, as has been proposed for FEF and SEF, saccade signals in PMd may provide spatial information that links the control of eye and arm movements in a distributed cortical network.
Footnotes
This work was supported by National Institutes of Health Grants EY05522-21, MH62528-01, the Boswell Foundation, the Sloan-Swartz Center for Theoretical Neurobiology at Caltech, and the Defense Advanced Research Projects Agency BioInfoMicro program. B.P. was supported by a Career Award in the Biomedical Sciences from the Burroughs Wellcome Fund, a Watson Program Investigator Award from NYSTAR, a McKnight Scholar Award, and a Sloan Research Fellowship. We thank Tessa Yao for editorial assistance, Kelsie Pejsa and Leah Martel for animal care, and Viktor Shcherbatyuk for technical assistance.
References
- Batschelet E. Circular statistics in biology. New York: Academic; 1981. [Google Scholar]
- Battaglia-Mayer A, Ferraina S, Genovesio A, Marconi B, Squatrito S, Molinari M, Lacquaniti F, Caminiti R. Eye-hand coordination during reaching. II. An analysis of the relationships between visuomanual signals in parietal cortex and parieto-frontal association projections. Cereb Cortex. 2001;11:528–544. doi: 10.1093/cercor/11.6.528. [DOI] [PubMed] [Google Scholar]
- Battaglia-Mayer A, Mascaro M, Caminiti R. Temporal evolution and strength of neural activity in parietal cortex during eye and hand movements. Cereb Cortex. 2007;17:1350–1363. doi: 10.1093/cercor/bhl046. [DOI] [PubMed] [Google Scholar]
- Blohm G, Crawford JD. Computations for geometrically accurate visually guided reaching in 3-D space. J Vis. 2007;7:4.1–4.22. doi: 10.1167/7.5.4. [DOI] [PubMed] [Google Scholar]
- Blohm G, Keith GP, Crawford JD. Decoding the cortical transformations for visually guided reaching in 3D space. Cereb Cortex. 2009;19:1372–1393. doi: 10.1093/cercor/bhn177. [DOI] [PubMed] [Google Scholar]
- Boussaoud D, Jouffrais C, Bremmer F. Eye position effects on the neuronal activity of dorsal premotor cortex in the macaque monkey. J Neurophysiol. 1998;80:1132–1150. doi: 10.1152/jn.1998.80.3.1132. [DOI] [PubMed] [Google Scholar]
- Bruce CJ, Goldberg ME, Bushnell MC, Stanton GB. Primate frontal eye fields. II. Physiological and anatomical correlates of electrically evoked eye movements. J Neurophysiol. 1985;54:714–734. doi: 10.1152/jn.1985.54.3.714. [DOI] [PubMed] [Google Scholar]
- Buneo CA, Andersen RA. The posterior parietal cortex: sensorimotor interface for the planning and online control of visually guided movements. Neuropsychologia. 2006;44:2594–2606. doi: 10.1016/j.neuropsychologia.2005.10.011. [DOI] [PubMed] [Google Scholar]
- Buneo CA, Jarvis MR, Batista AP, Andersen RA. Direct visuomotor transformations for reaching. Nature. 2002;416:632–636. doi: 10.1038/416632a. [DOI] [PubMed] [Google Scholar]
- Caminiti R, Johnson PB, Burnod Y, Galli C, Ferraina S. Shift of preferred directions of premotor cortical cells with arm movements performed across the workspace. Exp Brain Res. 1990a;83:228–232. doi: 10.1007/BF00232214. [DOI] [PubMed] [Google Scholar]
- Caminiti R, Johnson PB, Urbano A. Making arm movements within different parts of space: dynamic aspects in the primate motor cortex. J Neurosci. 1990b;10:2039–2058. doi: 10.1523/JNEUROSCI.10-07-02039.1990. [DOI] [PMC free article] [PubMed] [Google Scholar]
- Cisek P, Kalaska JF. Modest gaze-related discharge modulation in monkey dorsal premotor cortex during a reaching task performed with free fixation. J Neurophysiol. 2002;88:1064–1072. doi: 10.1152/jn.00995.2001. [DOI] [PubMed] [Google Scholar]
- Crammond DJ, Kalaska JF. Differential relation of discharge in primary motor cortex and premotor cortex to movements versus actively maintained postures during a reaching task. Exp Brain Res. 1996;108:45–61. doi: 10.1007/BF00242903. [DOI] [PubMed] [Google Scholar]
- Crawford JD, Guitton D. Visual-motor transformations required for accurate and kinematically correct saccades. J Neurophysiol. 1997;78:1447–1467. doi: 10.1152/jn.1997.78.3.1447. [DOI] [PubMed] [Google Scholar]
- Crawford JD, Medendorp WP, Marotta JJ. Spatial transformations for eye-hand coordination. J Neurophysiol. 2004;92:10–19. doi: 10.1152/jn.00117.2004. [DOI] [PubMed] [Google Scholar]
- Dum RP, Strick PL. Motor areas in the frontal lobe of the primate. Physiol Behav. 2002;77:677–682. doi: 10.1016/s0031-9384(02)00929-0. [DOI] [PubMed] [Google Scholar]
- Fries W. Inputs from motor and premotor cortex to the superior colliculus of the macaque monkey. Behav Brain Res. 1985;18:95–105. doi: 10.1016/0166-4328(85)90066-x. [DOI] [PubMed] [Google Scholar]
- Fujii N, Mushiake H, Tanji J. An oculomotor representation area within the ventral premotor cortex. Proc Natl Acad Sci U S A. 1998;95:12034–12037. doi: 10.1073/pnas.95.20.12034. [DOI] [PMC free article] [PubMed] [Google Scholar]
- Fujii N, Mushiake H, Tanji J. Rostrocaudal distinction of the dorsal premotor area based on oculomotor involvement. J Neurophysiol. 2000;83:1764–1769. doi: 10.1152/jn.2000.83.3.1764. [DOI] [PubMed] [Google Scholar]
- Gielen CC, van den Heuvel PJ, van Gisbergen JA. Coordination of fast eye and arm movements in a tracking task. Exp Brain Res. 1984;56:154–161. doi: 10.1007/BF00237452. [DOI] [PubMed] [Google Scholar]
- Goldberg ME, Bruce CJ. Primate frontal eye fields. III. Maintenance of a spatially accurate saccade signal. J Neurophysiol. 1990;64:489–508. doi: 10.1152/jn.1990.64.2.489. [DOI] [PubMed] [Google Scholar]
- He SQ, Dum RP, Strick PL. Topographic organization of corticospinal projections from the frontal lobe: motor areas on the lateral surface of the hemisphere. J Neurosci. 1993;13:952–980. doi: 10.1523/JNEUROSCI.13-03-00952.1993. [DOI] [PMC free article] [PubMed] [Google Scholar]
- Henriques DYP, Crawford JD. Role of eye, head, and shoulder geometry in the planning of accurate arm movements. J Neurophysiol. 2002;87:1677–1685. doi: 10.1152/jn.00509.2001. [DOI] [PubMed] [Google Scholar]
- Huerta MF, Kaas JH. Supplementary eye field as defined by intracortical microstimulation: connections in macaques. J Comp Neurol. 1990;293:299–330. doi: 10.1002/cne.902930211. [DOI] [PubMed] [Google Scholar]
- Huerta MF, Krubitzer LA, Kaas JH. Frontal eye field as defined by intracortical microstimulation in squirrel monkeys, owl monkeys, and macaque monkeys. II. Cortical connections. J Comp Neurol. 1987;265:332–361. doi: 10.1002/cne.902650304. [DOI] [PubMed] [Google Scholar]
- Johansson RS, Westling G, Bäckström A, Flanagan JR. Eye-hand coordination in object manipulation. J Neurosci. 2001;21:6917–6932. doi: 10.1523/JNEUROSCI.21-17-06917.2001. [DOI] [PMC free article] [PubMed] [Google Scholar]
- Jouffrais C, Boussaoud D. Neuronal activity related to eye-hand coordination in the primate premotor cortex. Exp Brain Res. 1999;128:205–209. doi: 10.1007/s002210050837. [DOI] [PubMed] [Google Scholar]
- Klier EM, Crawford JD. Human oculomotor system accounts for 3-D eye orientation in the visual-motor transformation for saccades. J Neurophysiol. 1998;80:2274–2294. doi: 10.1152/jn.1998.80.5.2274. [DOI] [PubMed] [Google Scholar]
- Land MF, Hayhoe M. In what ways do eye movements contribute to everyday activities? Vision Res. 2001;41:3559–3565. doi: 10.1016/s0042-6989(01)00102-x. [DOI] [PubMed] [Google Scholar]
- Lebedev MA, Wise SP. Tuning for the orientation of spatial attention in dorsal premotor cortex. Eur J Neurosci. 2001;13:1002–1008. doi: 10.1046/j.0953-816x.2001.01457.x. [DOI] [PubMed] [Google Scholar]
- Mitz AR, Godschalk M. Eye-movement representation in the frontal lobe of rhesus monkeys. Neurosci Lett. 1989;106:157–162. doi: 10.1016/0304-3940(89)90219-x. [DOI] [PubMed] [Google Scholar]
- Mushiake H, Inase M, Tanji J. Neuronal activity in the primate premotor, supplementary, and precentral motor cortex during visually guided and internally determined sequential movements. J Neurophysiol. 1991;66:705–718. doi: 10.1152/jn.1991.66.3.705. [DOI] [PubMed] [Google Scholar]
- Mushiake H, Fujii N, Tanji J. Visually guided saccade versus eye-hand reach: contrasting neuronal activity in the cortical supplementary and frontal eye fields. J Neurophysiol. 1996;75:2187–2191. doi: 10.1152/jn.1996.75.5.2187. [DOI] [PubMed] [Google Scholar]
- Ohbayashi M, Ohki K, Miyashita Y. Conversion of working memory to motor sequence in the monkey premotor cortex. Science. 2003;301:233–236. doi: 10.1126/science.1084884. [DOI] [PubMed] [Google Scholar]
- Peña JL, Konishi M. Auditory spatial receptive fields created by multiplication. Science. 2001;292:249–252. doi: 10.1126/science.1059201. [DOI] [PubMed] [Google Scholar]
- Pesaran B, Nelson MJ, Andersen RA. Dorsal premotor neurons encode the relative position of the hand, eye, and goal during reach planning. Neuron. 2006;51:125–134. doi: 10.1016/j.neuron.2006.05.025. [DOI] [PMC free article] [PubMed] [Google Scholar]
- Russo GS, Bruce CJ. Effect of eye position within the orbit on electrically elicited saccadic eye movements: a comparison of the macaque monkey's frontal and supplementary eye fields. J Neurophysiol. 1993;69:800–818. doi: 10.1152/jn.1993.69.3.800. [DOI] [PubMed] [Google Scholar]
- Russo GS, Bruce CJ. Supplementary eye field: representation of saccades and relationship between neural response fields and elicited eye movements. J Neurophysiol. 2000;84:2605–2621. doi: 10.1152/jn.2000.84.5.2605. [DOI] [PubMed] [Google Scholar]
- Schall JD, Thompson KG. Neural selection and control of visually guided eye movements. Annu Rev Neurosci. 1999;22:241–259. doi: 10.1146/annurev.neuro.22.1.241. [DOI] [PubMed] [Google Scholar]
- Schlag J, Schlag-Rey M. Evidence for a supplementary eye field. J Neurophysiol. 1987;57:179–200. doi: 10.1152/jn.1987.57.1.179. [DOI] [PubMed] [Google Scholar]
- Shadmehr R, Wise SP. Cambridge, MA: MIT; 2005. The computational neurobiology of reaching and pointing: a foundation for motor learning. [Google Scholar]
- Soechting JF, Flanders M. Moving in three-dimensional space: frames of reference, vectors, and coordinate systems. Annu Rev Neurosci. 1992;15:167–191. doi: 10.1146/annurev.ne.15.030192.001123. [DOI] [PubMed] [Google Scholar]
- Thura D, Boussaoud D, Meunier M. Hand position affects saccadic reaction times in monkeys and humans. J Neurophysiol. 2008a;99:2194–2202. doi: 10.1152/jn.01271.2007. [DOI] [PubMed] [Google Scholar]
- Thura D, Hadj-Bouziane F, Meunier M, Boussaoud D. Hand position modulates saccadic activity in the frontal eye field. Behav Brain Res. 2008b;186:148–153. doi: 10.1016/j.bbr.2007.07.035. [DOI] [PubMed] [Google Scholar]
- Tweed D, Vilis T. Implications of rotational kinematics for the oculomotor system in three dimensions. J Neurophysiol. 1987;58:832–849. doi: 10.1152/jn.1987.58.4.832. [DOI] [PubMed] [Google Scholar]
- van Donkelaar P. Eye-hand interactions during goal-directed pointing movements. Neuroreport. 1997;8:2139–2142. doi: 10.1097/00001756-199707070-00010. [DOI] [PubMed] [Google Scholar]
- Weinrich M, Wise SP. The premotor cortex of the monkey. J Neurosci. 1982;2:1329–1345. doi: 10.1523/JNEUROSCI.02-09-01329.1982. [DOI] [PMC free article] [PubMed] [Google Scholar]
- Weinrich M, Wise SP, Mauritz KH. A neurophysiological study of the premotor cortex in the rhesus monkey. Brain. 1984;107:385–414. doi: 10.1093/brain/107.2.385. [DOI] [PubMed] [Google Scholar]
- Westheimer G. Kinematics of the eye. J Opt Soc Am. 1957;47:967–974. doi: 10.1364/josa.47.000967. [DOI] [PubMed] [Google Scholar]
- Wise SP, Boussaoud D, Johnson PB, Caminiti R. Premotor and parietal cortex: corticocortical connectivity and combinatorial computations. Annu Rev Neurosci. 1997;20:25–42. doi: 10.1146/annurev.neuro.20.1.25. [DOI] [PubMed] [Google Scholar]