Abstract
The functional organization giving rise to stimulus selectivity in higher-order auditory neurons remains under active study. We explored the selectivity for motifs, spectrotemporally distinct perceptual units in starling song, recording the responses of 96 caudomedial mesopallium (CMM) neurons in European starlings (Sturnus vulgaris) under awake-restrained and urethane-anesthetized conditions. A subset of neurons was highly selective between motifs. Selectivity was correlated with low spontaneous firing rates and high spike timing precision, and all but one of the selective neurons had similar spike waveforms. Neurons were further tested with stimuli in which the notes comprising the motifs were manipulated. Responses to most of the isolated notes were similar in amplitude, duration, and temporal pattern to the responses elicited by those notes in the context of the motif. For these neurons, we could accurately predict the responses to motifs from the sum of the responses to notes. Some notes were suppressed by the motif context, such that removing other notes from motifs unmasked additional excitation. Models of linear summation of note responses consistently outperformed spectrotemporal receptive field models in predicting responses to song stimuli. Tests with randomized sequences of notes confirmed the predictive power of these models. Whole notes gave better predictions than did note fragments. Thus in CMM, auditory objects (motifs) can be represented by a linear combination of excitation and suppression elicited by the note components of the object. We hypothesize that the receptive fields arise from selective convergence by inputs responding to specific spectrotemporal features of starling notes.
INTRODUCTION
In many species, social interactions are supported by individuals exchanging information via vocalizations. Processing of vocalizations has long been thought to be mediated by a functional hierarchy (Leppelsack and Vogt 1976; Roeder 1966; Wilczynski and Capranica 1984), with higher-order auditory forebrain neurons responding selectively to complex, often conspecific stimuli (see Gentner and Margoliash 2002; Rauschecker 1998). It has been suggested that the identity of behaviorally relevant signals is represented by coordinated activity in small groups of secondary neurons (Barlow 1969; Olshausen and Field 2004; Theunissen 2003), but little is known about how these representations emerge from earlier stages.
For the songbirds, vocalizations include repertoires of relatively acoustically simple calls and one or more songs, which can be acoustically complex. European starlings, Sturnus vulgaris, are highly social songbirds with diverse vocal repertoires (Feare 1984; Hausberger 1997). Starlings recognize conspecific individuals by their songs, which are long bouts of temporally discrete “motifs” (Adret-Hausberger and Jenkins 1988; Eens et al. 1989). Motifs comprise sequences of “notes,” which appear in spectrograms as contiguous regions of high power and may represent basic motor gestures (Gardner et al. 2001). Starlings combine notes to form motifs that are almost always unique to a particular bird (Eens 1997). Field (Eens et al. 1991) and laboratory operant (Gentner and Hulse 2000b) behavioral studies indicate that starlings associate different motifs with particular individuals, suggesting that motifs are the basic perceptual objects of song recognition.
Here, we explore the neuronal mechanisms for representing motifs by examining the responses of neurons in the caudomedial mesopallium (CMM), a secondary forebrain auditory area that may be involved in the song recognition process. Auditory thalamic afferents synapse primarily onto field L2a and L2b neurons (Karten 1968; Wild et al. 1993), which in turn project only indirectly to CMM (Vates et al. 1996). Whereas many field L neurons respond broadly to natural auditory stimuli (Bonke et al. 1979; Grace et al. 2003; Leppelsack and Vogt 1976; Lewicki and Arthur 1996; Margoliash 1986), CMM neurons are substantially more selective, responding to fewer stimuli in a repertoire of natural sounds (Gentner and Margoliash 2003; Müller and Leppelsack 1985; Theunissen et al. 2004). Training starlings to discriminate between conspecific songs can bias this selectivity toward the motifs in the learned songs (Gentner and Margoliash 2003). The models developed for CMM neurons to date (Gentner and Margoliash 2003; Sen et al. 2001) indicate that the receptive fields are highly nonlinear and are unable to describe how the selectivity emerges from lower levels in the auditory processing hierarchy.
Little is known about auditory processing in the areas between field L and CMM, but receptive fields at higher areas are likely built up from the simpler receptive fields in field L, which are matched to the spectrotemporal features of conspecific song (Woolley et al. 2005). We tested the hypothesis that CMM neurons are tuned to complex elements commonly found in conspecific song, measuring their responses to starling motifs and the component notes. We found that CMM neurons responded robustly to motifs and notes. For most neurons, the responses to motifs could be predicted as a linear sum of the excitatory responses to the notes.
METHODS
The subjects used in this study were seven adult European starlings (sex was not recorded), captured from farms in northeastern Illinois. Birds were housed in mixed-sex flight aviaries, where they received food and water ad libitum. The light schedule in the aviary was adjusted to match the local day length in Chicago. All animal procedures were performed according to protocols approved by the University of Chicago Institutional Animal Use and Care Committee and consistent with the guidelines of the National Institutes of Health.
Starling songs and motif stimuli
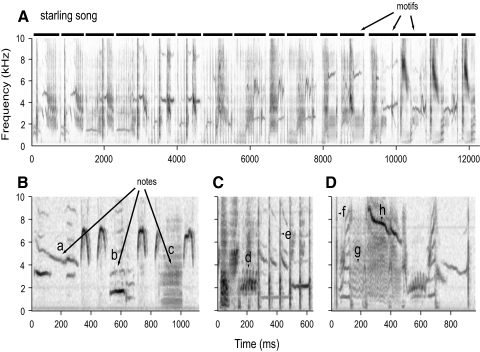
Starling song consists of a sequence of complex elements about a second in duration, called motifs (Fig. 1A). Although motif structure is highly variable, three major classes have been described: the variable motifs, the rattles, and the high-frequency motifs (Fig. 1, B–D) (Eens 1997), which consistently occur in that order in songs. The motifs used in this study consisted of 54 unique motifs that were visually identified and extracted from a library of starling song (see Supplemental Materials and Methods; for the complete set of motifs, see Supplemental Fig. S1).1 Stimuli derived from these songs were presented free-field in a sound isolation chamber.
Fig. 1.
Hierarchical structure of starling song. A: spectrogram of a representative segment of song. Darker shades indicate higher power. The song consists of a series of temporally discrete motifs, which are marked by horizontal bars above the spectrogram. B–D: 3 motif exemplars shown in detail to illustrate note structure. Notes appear as regions of contiguous power. Lowercase letters mark examples of some of the notes used by starlings: a,h, frequency-modulated tonal notes; b,g, harmonic notes; c, broadband note; d, trill; e,f, clicks.
Spectrotemporal isolation of note components of motifs
The most elementary components of birdsong are typically referred to as notes. In spectrographic representations of song, notes appear as regions of high power that are contiguous in time and frequency (Fig. 1, B–D). A tonal sound, for example, appears as a horizontal line, whereas a click or other sharp transient will appear as a vertical line (e.g., Fig. 1, notes e,f). Although birds often modulate the frequency of tones, they generally do so smoothly, so sweeps (Fig. 1, notes a,h) and trills (Fig. 1, note d) appear as continuous, curved lines in the spectrogram. Some notes are harmonic (Fig. 1, notes b,g). Starlings are also capable of producing screeches and other sounds that consist of broadband or band-limited noise; these appear as regions of diffuse power extended in both time and frequency (Fig. 1, note c).
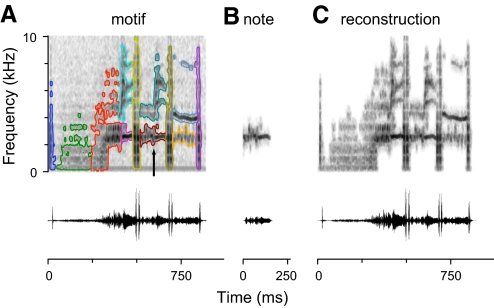
We used a novel method to segment starling motifs into constituent notes and extract the corresponding sound pressure waveforms. Notes can overlap in time (Fig. 1B), but nevertheless, they occupy disjoint regions of the spectrogram (Fig. 2A). This permitted us to extract notes by spectrographic inversion techniques (Supplemental Materials and Methods). Extracted notes have spectrograms that optimally match (in least-squares distance) the notes in the original motif (Fig. 2B). In this report, we presented neurons with isolated notes. We also presented stimuli in which multiple notes were recombined at their original temporal offsets. These included motif reconstructions, in which all the notes of a motif were included (Fig. 2C), and note deletions, in which one of the notes was omitted from the reconstruction.
Fig. 2.
Extraction of notes from motifs. A: spectrogram (top) and oscillogram (bottom) of a starling motif. Each note identified in the motif is outlined in a different color. B: the region of the motif spectrogram outlined in maroon (arrow) in A has been used to reconstruct the waveform of the note. The spectrogram (top) is computed from the note waveform (bottom). C: reconstruction of the motif from isolated notes. The notes outlined in A have been extracted separately and added together at their original temporal offsets. All the spectrograms in this figure have the same intensity mapping, and the vertical scales of the oscillograms are the same.
In a second set of experiments, we presented neurons with “note noise” and “fragment noise.” Note noise consisted of all the notes extracted from a 10-s segment of song recombined in random order with gaps of 10 ms between each note. Five different permutations of the notes were used, so that responses were recorded to each note in a variety of different contexts. Fragment noise was generated in the same way, but the motifs were divided into nonoverlapping note fragments (Supplemental Materials and Methods). The fragments contained the same spectrotemporal structures as the notes, but the spectral and temporal extent of each fragment were such that few fragments contained a single, whole note.
Electrophysiology
Birds were prepared for serial restrained recordings (Supplemental Materials and Methods). We made serial recordings from 27 units in five birds under restrained conditions over the course of three to eight sessions. The animals were restrained in a soft cloth jacket and attached to a stereotaxic device via the head pin. The sessions were timed to coincide with the birds' sleep period, lasted no longer than 5 h each, and were terminated if the animal became excessively active. Trials with movement artifacts were excluded from analysis. An additional 45 units were recorded from four of the birds in terminal sessions under urethane anesthesia (20% by volume, 5 ml/kg, im). We observed significant differences between behavioral states in spike time precision (see Supplemental Materials and Methods for definition) and some of the results, but basic response properties were unaffected by anesthesia (Supplemental Table S1). In figures, the behavioral state of the animal is indicated by different symbols when appropriate. In the second set of experiments, we recorded from 24 units in CMM from two birds under urethane anesthesia.
All of the birds used in neuronal recordings had previously participated in operant training experiments, in which they were exposed to some of the motifs used in this study. We observed no significant biases in the responses of CMM neurons for novel or familiar motifs (t-test on z-transformed firing rates: t1882 = −0.127, P = 0.90), and the proportion of neurons that preferred familiar motifs was not significantly different from the proportion of familiar motifs in the test ensemble (χ2 test: χ21 = 0.785, P = 0.38). This is consistent with a recent report that the bias for learned stimuli observed by Gentner and Margoliash (2003) rapidly decreases with continued training (Zaraza and Margoliash 2007), because all of the birds in this study had reached asymptotic behavior several weeks before recording.
Neuronal response analysis
The firing rate response (FR) of a neuron to each motif was defined as the number of spikes per second during the interval from the onset of the motif until 100 ms after its offset, averaged across trials. Neurons were considered responsive if, for at least one motif, FR was significantly greater than the spontaneous firing rate measured during a 1,000-ms period before stimulus onset. Significance was established using a one-way ANOVA with stimulus identity as the main factor and the baseline period as the contrasting condition. Neurons with low firing rates often do not satisfy the Gaussian assumptions of ANOVA, so we used the sandwich package from the statistical software R (Zeileis 2004) to compute robust SEs and only considered a stimulus to be excitatory if the associated coefficient was positive and significant at α = 0.01.
To summarize the selectivity of neurons among the repertoire of test motifs, we used a sparseness metric SI (Olshausen and Field 2004; Zoccolan et al. 2007)
where FRi is the response to the ith motif, and n is the number of motifs presented to the neuron. SI ranges between 0 and 1. It approaches 1 for neurons that respond strongly to only a few stimuli and approaches 0 for neurons that respond similarly to all of the stimuli. For visual comparison of firing rate distributions across neurons (Fig. 3C), we normalized the FR values by the maximum FR of the neuron to all the motifs and computed the empirical quantiles of the FR distribution at 5% intervals.
Fig. 3.
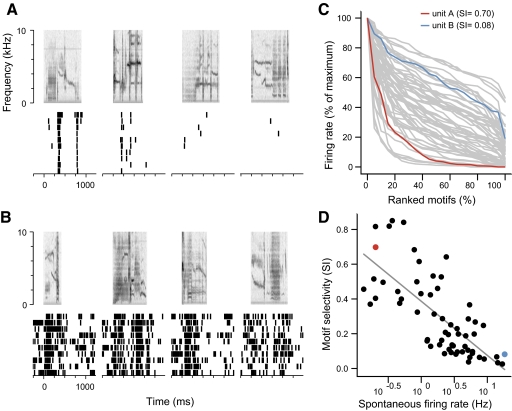
Selectivity of caudomedial mesopallium (CMM) neurons for starling motifs. A: responses of a highly selective neuron to 4 example motifs, with spectrograms of the motifs shown above and aligned with raster plots of the responses. Examples correspond to the 100th, 75th, 50th, and 25th percentiles of the distribution of firing rates elicited by all the motifs presented to the neuron (shown in C). B: responses of a less selective neuron to motifs at the same percentiles of its response distribution. C: normalized firing rate distributions for 63 CMM neurons. For each neuron, the motifs have been ranked in order of their firing rate and scaled by the largest response. The traces labeled in red and blue correspond to the example neurons in A and B, respectively. The selectivity index, SI, quantifies how strongly peaked the distribution is. D: scatter plot of SI for each neuron vs. its spontaneous firing rate (log scale). Example neurons from A and B are indicated in red and blue. The linear regression (diagonal line) is highly significant (R2 = 0.55, t61 = −8.4, P = 7.6 × 10⁻¹²).
Stimulus-driven spike precision was defined as the median (across stimuli) of the maximal frequency at which the neuron showed significant intertrial coherence (Supplemental Materials and Methods).
Linear summation of CMM responses to notes
The smoothed response to each note, ri(t), was calculated by convolving the spike trains with a Gaussian smoothing kernel (σ = 10 ms), averaging across presentations, and subtracting the baseline firing rate. The response window was the interval from the start of the note to 250 ms after the end of the note. We used a discrete-time framework with a step size of 5 ms. To predict the response of the neuron to the full motif, we added the responses to each of the N notes in the motif, aligned with the time when each note occurred (ti)
The predicted responses were compared with the neuron's actual response by computing the correlation coefficient ratio (CCR), which incorporates a correction for the intrinsic variability of the spiking responses (Hsu et al. 2004). In brief, CCR is determined by first calculating the intertrial correlation, defined as the correlation between the spiking responses of the neuron and R(t), the mean response. Because R(t) is not known, the intertrial correlation is calculated from the correlation coefficient between the averages of the even and odd trials, using a finite sample size correction. Then the correlation coefficient between the predicted response and the neuronal response is calculated (also with a finite sample size correction) and divided by the intertrial correlation.
Modeling CMM responses with feature receptive fields
The summation described in the previous section can be generalized to any stimulus composed of discrete elements. Each element is represented as a time-varying binary variable that indicates when it is present in a stimulus. A motif or song of length T, comprising N notes with onset times {t1, …, tN}, is represented as M(i, t) = δ(t − ti) for 1 ≤ i ≤ N. This is analogous to a spectrogram, except that notes are used as a basis set instead of frequencies. The responses of a neuron to an arbitrary combination of notes can be modeled as a sum of the responses to the components, or equivalently as the convolution of the stimulus matrix with the note responses
where ri(t) is the response to note i, μ is the background firing rate, and Si is the largest time lag associated with each note. This model was implemented on a uniform time grid with a step size of 5 ms.
It can be seen that Eq. 1 is a special case of Eq. 2, in which notes are presented in isolation to directly determine ri(t), and Si is chosen to include time points ≤250 ms after the offset of each note. However, the model can also be used to estimate responses to notes when they are not presented in isolation. In the first set of experiments, neurons were also presented with note deletions, which are motif reconstructions from which single notes were omitted. The stimulus representations M(i,t) for these stimuli are the same as for the unmodified motif, except that they are zero for the omitted note. Fitting Eq. 2 to these responses gives estimates of the responses to the notes in the context of the motif, which we used to calculate the effects of context on note responses (Supplemental Materials and Methods).
In a second set of experiments, we presented neurons with random sequences of notes and note fragments (“note noise” and “fragment noise”). This allowed us to test a much larger number of components. Each note (or fragment) appears in a variety of contexts and may be affected by suppressive or excitatory effects from preceding notes. The ordinary least squares solution accounts for these interactions and provides an estimate of the mean effect of each note (or fragment) independent of its context. In light of the similarity to the spectrotemporal receptive field (STRF), we called the responses of a neuron to each of the notes, ri(t) for all i, the neuron's feature receptive field (FRF). The FRF could be used to predict the response to the original song segment using Eq. 2.
All statistical tests are two-tailed unless otherwise noted. For linear regressions, where unequal variance or nonnormality of the data were a concern, we calculated robust standard errors for regression coefficients (using the sandwich package; Zeileis 2004) and report the associated t value.
RESULTS
We recorded from single units in starling CMM and examined their responses to motifs and notes, which are the basic components of starling song (Fig. 1). Neurons were presented with a set of 39 to 54 unique motifs (median 10 repeats per motif). In the first experiment, out of a total of 72 well-isolated units, recorded from five adult starlings, 61 exhibited a significant excitatory response to at least one of the motifs in the test set (ANOVA on firing rates; α = 0.01). Another two neurons showed no significant differences in mean firing rate but did exhibit reliable time-varying responses to several motifs, so they were also included in further analysis.
CMM responses and motif selectivity
We first characterized the general response properties and selectivity of CMM neurons. Responsive neurons varied extensively in their spontaneous firing rate (range, 0.13–18.3 Hz), spike patterns, and selectivity. Some neurons responded to motifs with one or more transient peaks of activity at high temporal precision (Fig. 3A), whereas others responded with sustained increases in firing rate at low temporal precision (Fig. 3B). Some neurons were highly selective, responding strongly to only a few motifs. This can be seen in the cumulative distribution of firing rates across the motifs, with most of the motifs eliciting weak responses relative to the peak of the distribution (Fig. 3C, red). Other neurons were less selective, with responses more evenly distributed across the stimuli (Fig. 3C, blue). To summarize the firing rate distributions, we used a sparseness index (SI) (Olshausen and Field 2004) (see methods), which indicates how similar the neuron's response is across the set of motifs. SI can range between 0, for a neuron that responds the same to all stimuli, to 1, for a neuron that responds only to one stimulus. In CMM, selectivity was broadly distributed (median SI = 0.21, interquartile range 0.10–0.44, n = 63 neurons) and inversely correlated with spontaneous firing rate (Fig. 3D). A group of 23 neurons (36.5% of responsive neurons) characterized by higher selectivity and lower spontaneous activity seemed to form a distinct cluster.
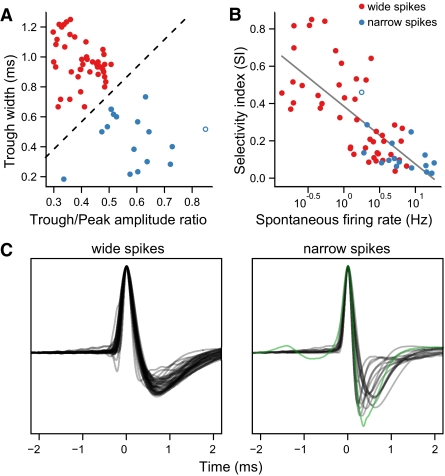
Selectivity and spontaneous firing rate were correlated with the spike waveforms of the neurons. Most of the units recorded in CMM (45/63) were characterized by spikes with an initial positive deflection, followed by a much broader, shallow repolarization (Fig. 4C, left). The other neurons (17/63) tended to have narrower positive deflections and deeper, faster repolarizations (Fig. 4C, right). Spike shapes for these neurons were more heterogeneous than the wide spikes and probably originated from more than one type of neuron. We classified the spikes based on trough width and the ratio of peak to trough amplitude (Fig. 4A). One neuron had an exceptionally strong signal that clipped during data acquisition and was not included in this analysis. Neurons with wide spikes were significantly more selective (median SI = 0.31) than neurons with narrow spikes (median SI = 0.095; Wilcoxon rank-sum test: P = 3.64 × 10⁻⁵, n = 62) and had lower spontaneous firing rates (median 1.50 Hz vs. 5.95 Hz; Wilcoxon rank-sum test: P = 1.4 × 10⁻⁶). All but 1 of the 23 highly selective neurons fell into the wide spike class (Fig. 4B). The remaining selective neuron, which was recorded on an electrode with particularly high impedance, had a complex spike waveform with a smaller positive and negative deflection before the main peak of the spike (Fig. 4C, green trace). Additional comparisons between neurons with wide and narrow spikes are given in Supplemental Table S2.
Fig. 4.
Spike shapes of CMM neurons are correlated with selectivity. A: scatter plot of the trough width vs. the ratio of trough amplitude to peak amplitude for 62 of the responsive neurons recorded in CMM (1 neuron where the recording clipped is excluded). Measurements are from the average spike waveform for each neuron. The dashed line indicates the criterion for classifying spikes as wide (red points) or narrow (blue points). Open symbol indicates a neuron with a complex waveform (C, green trace) and high selectivity. B: scatter plot of SI vs. spontaneous firing rate (as in Fig. 3D), with neuron class indicated by color. C: average spike waveforms (normalized peak height) for 45 wide spike neurons (left) and 17 narrow spike neurons (right). Green trace corresponds to the neuron with an open symbol in A and B.
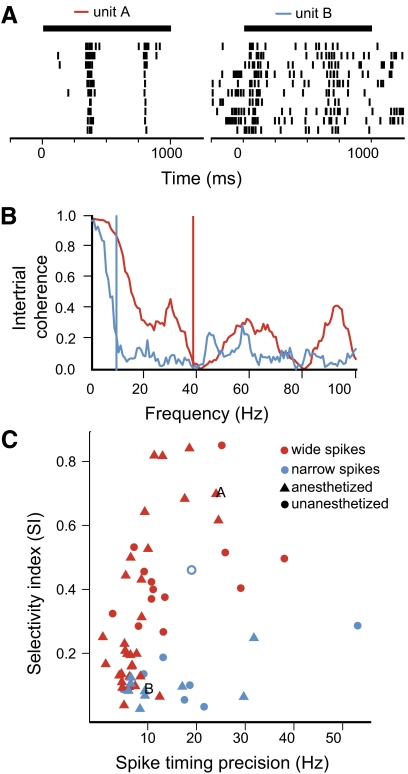
Neurons in CMM exhibited a broad range of temporal precision and reliability in their responses (e.g., Fig. 3, A vs. B). We used intertrial coherence to quantify the reliability of the spiking responses at multiple timescales (Fig. 5, A and B). The spike timing precision for each neuron was defined as the maximum frequency at which the neuron showed significant intertrial coherence (median across motifs; Supplemental Materials and Methods). The spike timing precision of the responsive CMM neurons had a median of 8.74 Hz (interquartile range, 6.20–15.3 Hz). Spike timing precision was weakly correlated with selectivity (Fig. 5C; Spearman rank correlation: ρ = 0.34, P = 0.007) and uncorrelated with spontaneous firing rate (Spearman rank correlation: ρ = −0.17, P = 0.18). Within the subset of neurons with wide spikes, the correlation with selectivity was even higher (Fig. 5C, red points; Spearman rank correlation: ρ = 0.65, P = 1.4 × 10⁻⁶). We also observed that neurons in unanesthetized animals showed significantly higher spike timing precision (median 13.2 Hz in unanesthetized animals vs. 7.1 Hz under urethane; Wilcoxon rank-sum test: P = 0.004). Neurons recorded in unanesthetized animals tended to be more selective as well, although the difference was not significant (median SI 0.36 unanesthetized vs. 0.16 urethane; Wilcoxon rank-sum test: P = 0.19). Additional comparisons between the response properties of neurons recorded under restrained or anesthetized conditions are given in Supplemental Table S1.
Fig. 5.
Spike timing precision of CMM neurons. A: raster plots of 2 neurons, responses to the same motif (same as in Fig. 3, A and B). Spike precision was analyzed over the interval from the onset of the motif to 100 ms after the offset (black bars). B: intertrial coherence of the responses in A for unit A (red) and unit B (blue). Vertical lines indicate the highest frequency in a band starting at 0 Hz where the coherence is significantly >0; this is the smallest timescale over which the response is reliable. C: scatter plot of selectivity between motifs (SI) and spike timing precision for 62 responsive CMM neurons. The spike timing precision of a neuron is the median of the maximum coherent frequency (as in B) for all the motifs presented to the neuron. Symbol colors indicate the spike waveform type (see Fig. 4), and symbol shapes indicate the behavioral state of the animal. Example units A and B are labeled with capital letters, and the open symbol corresponds to the neuron with the unusual spike waveform (Fig. 4C).
Equivalent excitatory responses to isolated notes and notes in motifs
We asked how CMM neurons responded to more elementary components of starling song. We segmented motifs into notes, which are stereotyped vocal structures that appear in spectrograms as contiguous regions of high-intensity (Figs. 1, B–D, and 2A). The sound waveforms associated with these structures were extracted by masking out the rest of the motif spectrogram and computing the inverse of the spectrographic operation on the unmasked region (Supplemental Materials and Methods). The extracted notes had spectrograms that closely matched the notes in the full motif (Fig. 2B) and could be combined to reconstruct the motif (Fig. 2C) or to generate novel synthetic stimuli.
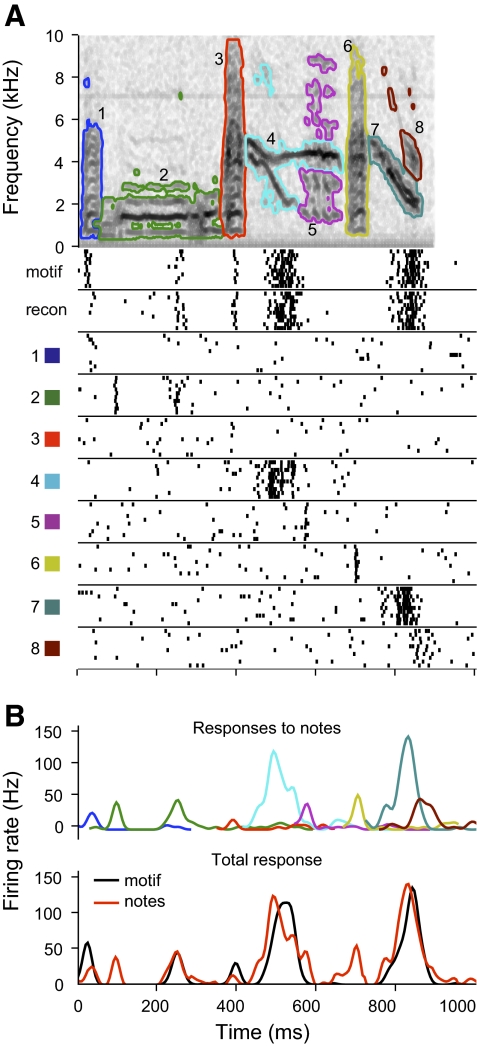
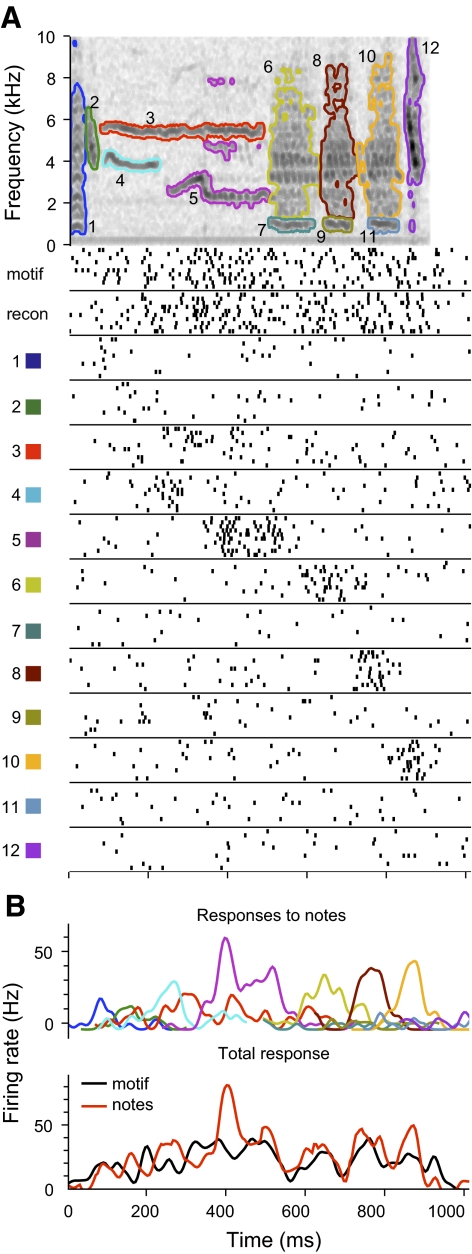
We tested the responses of 49 CMM neurons to isolated notes from 1 to 6 excitatory motifs, for a total of 39 unique motifs and 104 different motif-cell pairs. By comparing the responses to individual notes with those elicited by the original motif, we could determine which notes contributed to the response. We also recorded each neuron's response to the reconstructed motif (e.g., Fig. 2C) as a control for the quality of the note extraction algorithm. CMM neurons responded robustly to the motif reconstructions and to many of the isolated notes. Figure 6A shows the responses of an example neuron to a motif, its reconstruction, and all the component notes. The motif and the reconstruction elicited responses with statistically indistinguishable spike counts (median firing rate 19.0 vs. 18.0 Hz; Wilcoxon rank-sum test: P = 0.09). The temporal patterns of the responses were highly similar, which we quantified using correlation coefficient ratio (CCR = 0.98; see methods). The neuron also responded to six of the eight notes. When we aligned the responses to each note with the temporal position of the note in the motif, we found that three of the notes (Fig. 6A, notes 2, 4, and 7) elicited transient responses that aligned with peaks in the full response and were similar in amplitude and duration. These included the notes that elicited the strongest responses (Fig. 6A, notes 4 and 7). For neurons that gave sustained responses with no distinct peaks of activity, for example in Fig. 7A, several of the notes elicited responses that corresponded with the firing rate at that point in the response to the full motif. The combined responses to the sequence of individual notes seemed to fill the response to the entire motif.
Fig. 6.
Responses of CMM neuron to motif and isolated notes. A: top: spectrogram of a motif, with the notes outlined in different colors. Plotted below the spectrogram are the responses of the neuron to the original motif, the note-based reconstruction (recon) and to each of the component notes, which are identified by the numbers of the notes and the colors of the note outlines. Raster plots are aligned so they show the response to each note at its original temporal offset in the motif. B: comparison of the responses of the neuron to the notes and the motif. Top: the smoothed response to each note is plotted in the color corresponding to the note and at the time when the note occurs in the motif. Bottom: the note responses have been summed (red) for comparison with the response to the motif (black). The correlation coefficient ratio (CCR) between the predicted and actual responses is 0.65.
Fig. 7.
Responses to notes of a CMM neuron with sustained firing patterns. The layout is the same as in Fig. 6. In B, the CCR between the response to the motif and the sum of the responses to the notes is 0.76.
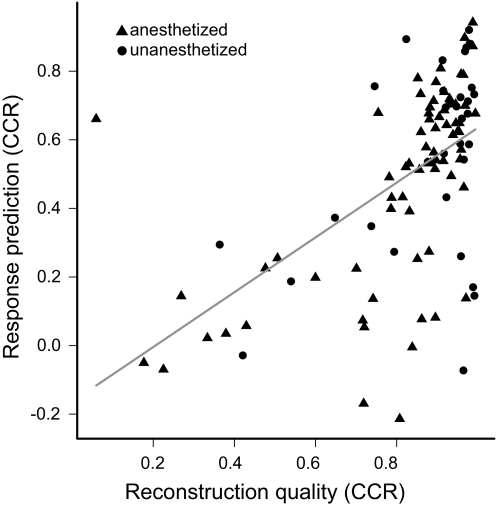
These observations were consistent across the motifs and neurons we tested in CMM. Responses to note reconstructions and the original motifs were reliably similar (median CCR 0.92; interquartile range 0.84–0.97; n = 104 motif-neuron pairs). The similarity of the responses was higher in unanesthetized birds (median CCR 0.96 vs. 0.90; Wilcoxon rank-sum test: P = 0.01), perhaps because of greater spike precision in this behavioral state. The component notes of motifs consistently elicited robust responses that could be summed to predict the response to the original motif (Figs. 6B and 7B). The median CCR between responses to the motif and the summed responses to notes was 0.59 (interquartile range 0.28–0.72; n = 104 pairs). This linearity depended to some extent on how well the note extraction algorithm worked; that is, the CCR between the response to a motif and the sum of the responses to the component notes was correlated with the CCR between the responses to a motif and its reconstruction (Fig. 8). Thus we have probably somewhat underestimated the extent of the linear summation of notes.
Fig. 8.
Predictions of motif responses from note responses depend on quality of reconstruction. Scatter plot comparing the similarity [correlation coefficient ratio (CCR)] of responses to the motif and to the reconstruction, against CCR between the response to the motif and the sum of responses to the component notes (Figs. 6B and 7B). The majority of motifs with good reconstructions were predicted well, leading to a weak but significant linear correlation between the variables (solid line, R2 = 0.28; t102 = 3.79, P = 2.6 × 10⁻⁴). Symbol shape indicates the behavioral state of the animal.
Suppressive interactions between notes
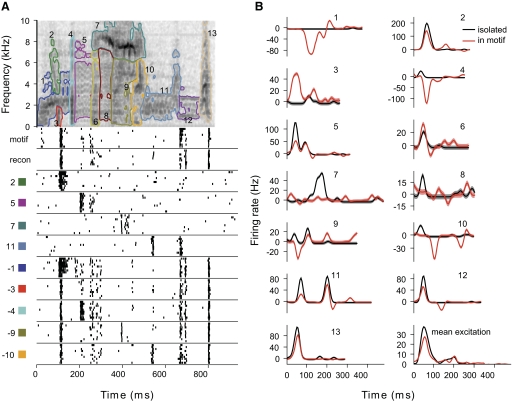
Although most notes elicited similar responses in isolation and in the context of the motif, we observed a number of instances where responses were different in these contexts. For instance, some notes elicited excitatory responses in isolation that had no correspondence in the response to the full motif (Figs. 6A, notes 5 and 6, and 9A, notes 7 and 11). This suggested that some other part of the motif suppressed the responses to these notes. The low spontaneous rate of many CMM neurons prevented observing suppressive effects directly. Instead, we presented neurons with synthetic motifs comprising all but one of the notes (i.e., note deletions), and found that removing notes could unmask excitatory responses during or immediately following the note that was removed. As seen in Fig. 9A (notes 1, 4, 9, and 10), the unmasked excitation often coincided with the responses to the isolated notes (i.e., with times where the sum of note responses overestimates the response to the motif).
Fig. 9.
Context-dependent responses to notes. A: response of an example neuron to a motif and component notes, as in Figs. 6A and 7A. Responses to note deletions, which are reconstructions from which one note has been omitted, are shown in the bottom 5 panels. The identity of the omitted note is indicated by the note number and a minus sign. Several of the notes elicit peaks of excitation not present in the response to the original motif (notes 5, 7, and 11), and removal of other notes unmasks similar peaks of excitation (notes 4, 9, and 10). For clarity, the responses to only some of the notes and note deletions are shown. B: comparison of responses to notes in isolation (black) and in the context of the motif (red). Context-dependent responses are estimated from the responses to note deletions. The number above each panel indicates the note. Shading around traces represents SE of the estimate. In the panel labeled “mean excitation,” the sum of excitatory responses to isolated notes (black) is compared with the sum of excitatory context-dependent responses (red).
To further characterize this phenomenon, we used a linear model to estimate the responses to notes in the context of the motif, using the responses to the note deletions to fit the model (see methods). We compared the context-dependent response to the response elicited by the isolated note. As shown in Fig. 9B, the effects of motif context varied extensively. Most notes elicited slightly weaker responses in the motif, but with similar temporal profiles (Fig. 9B, notes 2, 5, 11, 12, and 13). Some notes were completely suppressed (Fig. 9B, note 7). Others were facilitated by the motif context (Fig. 9B, note 6), and a few notes that were weakly excitatory or suppressive in isolation had strong effects of the opposite sign on the response to the full motif (Fig. 9B, notes 3, 4, and 10).
These diverse contextual effects were observed across CMM. For each note, we computed a context dependence index (CD), which is the difference between the excitatory response to the isolated note and the excitatory response to the note in the context of the motif, relative to the larger of the two responses (Supplemental Materials and Methods). CD ranges between −1 and 1 and is negative for suppressive effects and positive for facilitative effects. Nineteen percent of the notes showed significant facilitation by context, and 35% of the notes were suppressed by context. Behavioral state and spike type both affected the distribution of suppression and facilitation (Supplemental Fig. S3; χ2 test for both factors: P = 1.4 × 10⁻⁵). In unanesthetized animals, there was a significantly higher proportion of facilitated notes (26 vs. 16% in anesthetized animals), and neurons with narrow spikes showed significantly lower facilitation (12% of notes vs. 22% for wide-spike neurons).
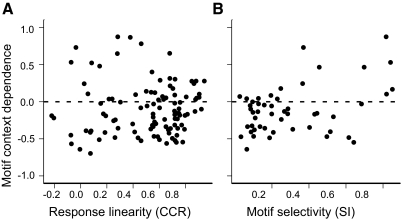
We also computed CD for each motif-neuron pair by comparing the mean of the excitatory responses to all the isolated notes against the mean of all the context-dependent responses (e.g., Fig. 9B, mean excitation). Most motifs had an overall suppressive effect on note responses (median CD, −0.17; interquartile range, −0.38 to −0.06; n = 104 pairs). Low absolute values of CD indicate that the responses to notes tend to sum linearly, and unsurprisingly, the responses to motifs with low CD magnitudes tended to be predicted well from the sum of the responses to notes (Fig. 10A; Spearman rank correlation of CD magnitude and CCR, ρ = −0.29, P = 0.002). There was also a tendency for less selective neurons to be dominated by suppressive interactions (negative CD) and more selective neurons to be dominated by facilitative interactions [Fig. 10B; Spearman rank correlation of CD (median across motifs) and SI, ρ = 0.24, P = 0.02], although the relationship between context dependence and selectivity appears to be substantially nonlinear.
Fig. 10.
Context dependence, response linearity, and selectivity for responses to motifs. A: scatter plot showing context dependence (CD) for each motif as a function of the linearity of the response to the motif. CD compares the average excitatory response to notes in isolation against the average response to the notes in the context of the motif, ranges from −1 to 1, and is negative for suppression and positive for facilitation. Response linearity is the CCR between the response to the motif and the sum of the responses to the component notes. B: scatter plot showing median CD for each neuron as a function of its selectivity (SI).
Feature receptive fields
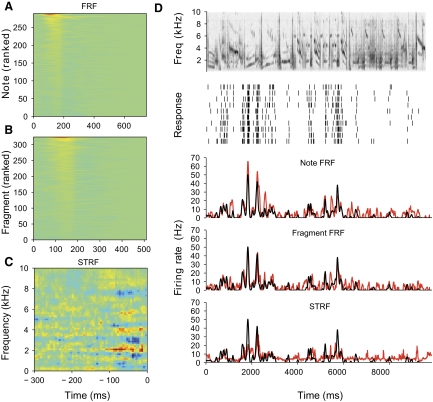
The linear summation of note responses suggests a model for CMM responses similar to a STRF, but using notes as a basis set rather than frequencies. In a second experiment, we therefore recorded responses from an additional 24 CMM neurons (in 2 birds) presented with a novel stimulus comprising all the notes from a 10-s segment of song presented in random order, which we termed “note noise.” In this model, which we termed the FRF, each note was encoded by a binary variable, which was equal to 1 at the onset of the note and 0 elsewhere, an extremely sparse representation. We fit the model to the responses to note noise to get a linear estimate of the response to each note (the FRF; Fig. 11A). Each row in the FRF corresponds to a particular note. To predict the response to the original song, the FRF is convolved with the note-based representation of the song (Fig. 11D, 3rd panel), which amounts to a linear summation of the responses to the notes at their original temporal offsets. The FRF model consistently predicted the responses of neurons in CMM to starling song (median CCR, 0.62; interquartile range, 0.49–0.67). FRFs for each of the neurons in this experiment are shown in Supplemental Fig. S5.
Fig. 11.
Comparison of feature receptive field (FRF) for a neuron with its spectrotemporal receptive field (STRF). A: psuedocolor plot of the FRF estimated from a neuron's responses to note noise. Note noise consists of all the notes extracted from a 10-s segment of starling song (D, top) presented in random order. Each row in the FRF is the estimated response to one of the notes, ranked in order of peak response. Columns represent the time after the note onset. Bluer colors are negative and redder colors are positive. B: the FRF for the same neuron estimated from responses to fragment noise, which is generated from the same song but with alternate segmentation designed to break up the note structure. C: STRF of the neuron estimated with maximally informative dimensions from the responses to note and fragment noise. By convention, the STRF is plotted with negative lags; responses are highest when the spectrogram of the song matches the STRF. D: the spectrogram of one of the songs used to construct the FRF and STRF is shown in the top panel. Second panel: raster plot of the neuron's response to the song. The bottom panels show the predictions of the note FRF, fragment FRF, and STRF in red, with the smoothed response shown in black. CCRs for the 3 predictions are 0.77, 0.66, and 0.50. For clarity, the responses have been smoothed with a larger kernel than used in the model (23- vs. 10-ms bandwidth).
We also used the FRF model to test whether neurons are specifically tuned to notes. We made an alternative segmentation of the song into “note fragments,” which were nonoverlapping temporal slices of the song, with the endpoints of the fragments chosen in such a way to cut as many notes as possible into different fragments, while keeping the number of features approximately the same (see methods for details). The same neurons were presented with “fragment noise,” and the model was fit to these data. The resulting fragment FRFs (Fig. 11B) were nearly as good as the note FRFs in predicting the responses to the song (Fig. 11D, 4th panel). The median difference in CCR for the predictions of the note-based and fragment-based models was 0.07 (Wilcoxon signed-rank test: P = 0.002).
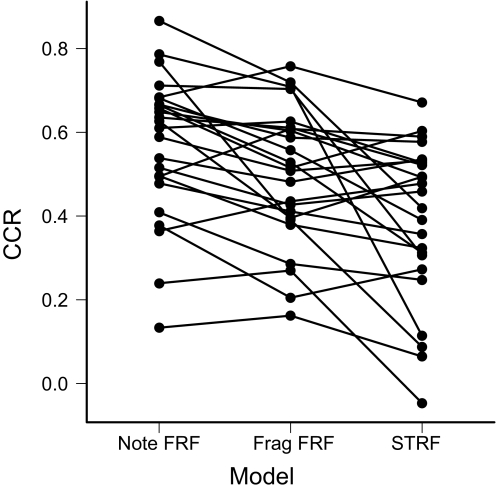
To compare these results with previous findings in CMM and other auditory areas, we also computed STRFs for each of the 24 neurons in this second study. We used maximally informative dimensions (MIDs), a method that eliminates several of the statistical issues in estimating receptive fields from natural stimuli (Atencio et al. 2008; Sharpee et al. 2004), to estimate the spectrotemporal filter for each neuron and an associated static nonlinearity. Only the first MID was calculated. The data used to fit the model were the responses to the note and fragment noise. In general the STRFs for CMM neurons tended to be complex, with multiple subfields (Fig. 11C; see Supplemental Fig. S5 for the STRFs and FRFs of all the neurons). STRFs gave less accurate predictions of the response to songs, with a median CCR of 0.44 (interquartile range, 0.30–0.53). For all but two units, the note FRF gave a better prediction than the STRF (Fig. 12; median difference in CCR = 0.12; Wilcoxon signed-rank test: P = 0.0002). Thus although MID estimates of the spectrotemporal response properties of CMM neurons give substantially better results than reported using other statistical methods (Gentner and Margoliash 2003; Sen et al. 2001), significant spectrotemporal nonlinearities remain that are captured by the feature-based models.
Fig. 12.
Comparison of model predictions. Each set of connected points corresponds to a neuron (total 24), and the vertical position of the points indicates the CCR for the prediction of the note FRF, the fragment FRF, and the STRF models. All of the comparisons are significant (note FRF vs. fragment FRF: Wilcoxon signed-rank test: P = 0.002; fragment FRF vs. STRF: P = 0.006).
DISCUSSION
The structure of vocalizations, especially complex vocalizations, is suggestive of hierarchical organization, in which objects at one level are composed of simpler elements. Vocal elements at an intermediate level of the hierarchy, such as words in speech or motifs in starling song, may be perceived as units. An attractive assumption is that representations of such auditory objects may follow combinatoric principles, being defined by spectral and temporal combinations of smaller, often distinct vocal elements. In this encoding scheme, changing components or varying their spectrotemporal relationships can lead to sharp changes in the perceived identity of the object (Liberman et al. 1961; Nelson and Marler 1989; Searcy et al. 1999) There is some electrophysiological evidence in support of this hypothesis (Margoliash 1983; Prather et al. 2009; Suga 1978).
To address this question, we decomposed starling motifs into notes, using a method that was partially heuristic. We found that neurons in the starling higher-order auditory region CMM respond robustly to notes thus defined. For most neurons, the excitatory responses to notes were surprisingly independent of the motif context in which they were normally expressed. Suppressive effects of notes in the context of motifs were also observed. On average, notes were better at driving neurons than note fragments. Our results support a hierarchical model whereby selectivity for simple auditory features emerges prior to CMM in the auditory processing hierarchy, with CMM neurons combining these inputs to create note-level representations.
Selectivity for complex auditory objects in CMM
Motifs are thought to be the primary perceptual objects of starling song recognition (Gentner and Hulse 2000b), although note-level perception has yet to be examined. We observed that in CMM, selectivity between motifs varied broadly among neurons (Gentner and Margoliash 2003). A small number of cells were highly selective, responding strongly to only a few motifs, whereas most of the neurons showed relatively little preference (Fig. 3, C and D). As observed previously (Gentner and Margoliash 2003), selectivity was correlated with low spontaneous firing rates (Fig. 3D) and temporally precise responses (Fig. 5). All but one of the most selective neurons had similar spike waveforms (Fig. 4). It has been shown in a number of systems that behavioral discrimination performance tends to mirror the neuronal discrimination of the most selective cells (Britten et al. 1992; Narayan et al. 2007; Romo and Salinas 2003; Wang et al. 2007). The more numerous, less selective neurons could serve as a pool of cells that can acquire selectivity as the bird learns to recognize novel motifs (Gentner and Margoliash 2003). During acquisition of new songs in perceptual learning tasks, CMM neurons rapidly change their selectivity toward the operantly reinforced novel stimuli and then lose this selectivity as the animal learns the new stimuli (Zaraza and Margoliash 2007). This high degree of plasticity could be subserved by the less selective neurons. It is also possible that some of the neurons that appear only weakly selective when tested with single motifs, as we report here, may be sensitive to sequences of motifs. Under operant training, starlings can learn complex patterns of motif sequences (Gentner and Hulse 1998; Gentner et al. 2006), and this behavior may be expressed naturally in the context of sexual selection (Gentner and Hulse 2000a).
Linear summation of note responses
Both selective and nonselective neurons responded robustly to one or more of the component notes of motifs when they were presented in isolation. The responses closely matched the patterns of activity elicited by the notes when they were embedded in the motifs. We could predict the responses of CMM neurons to motifs with a high degree of accuracy by simply adding together the responses to the component notes. This suggested a linear model for CMM responses, which we termed the FRF. We estimated FRFs for 24 additional CMM neurons from their responses to note noise, which consisted of the component notes of a song presented in random order, and found that they could predict responses to the original song (Fig. 12). Taking the square of CCR as the percentage of explained variance, FRFs accounted for ∼38% of the stimulus-dependent variance in the responses to the original song. In contrast, STRFs calculated from the same data only accounted for 19% of the variance.
STRF models represent neuronal responses as a linear (or statically nonlinear) function of the spectrotemporal content of the stimulus (Aertsen and Johannesma 1981; Eggermont et al. 1983; Theunissen et al. 2001). If there are nonlinear interactions between components of the stimulus, STRFs generally fail to make good predictions (Ahrens et al. 2008; Christianson et al. 2008; Sharpee et al. 2004, 2008). For instance, if a neuron is selective for a pair of tones, a linear model will predict a weak response to either of the tones by itself, and fail to predict the nonlinear dependence on the combination. A similar argument obtains for contiguous features with complex spectrotemporal modulations or contours. Higher-order auditory neurons often exhibit temporal or spectral combination sensitivity (Bar-Yosef et al. 2002; Margoliash 1983; Margoliash and Fortune 1992; O'Neill and Suga 1979; Peña and Konishi 2001). However, if a combination-sensitive neuron is presented with stimuli in which the pair of tones (or other complex structure) is manipulated as a unit, its response will be a linear function of whether that unit is present or not. Using the MID method to estimate STRFs gave more accurate predictions than previously obtained with other methods (Gentner and Margoliash 2003; Sen et al. 2001), but the much better performance of the FRF model indicates that substantial spectrotemporal nonlinearities remain. Dividing starling song into notes kept intact the complex spectrotemporal patterns driving the responses.
One implication of this interpretation is that the FRF can be used to test how well a particular basis set preserves the structures the neuron is tuned to. The responses to the bases of the model will only sum linearly if the excitatory components of the stimuli are not split across multiple bases. Our segmentation of starling song was based on visual inspection of the spectrograms and can only approximate the actual perceptual or motor structure of the song. However, the FRF based on notes outperformed a FRF model based on note fragments (Fig. 13), which suggests that CMM neurons are preferentially tuned to the spectrotemporal patterns contained in notes. This is consistent with the likely perceptual experience of starlings. They would hear the same notes in different motifs and under variable auditory conditions. Experience-dependent plasticity such as that observed in auditory cortex (Dahmen and King 2007) could lead to selectivity for the spectrotemporal patterns found in notes.
Although FRF models gave better performance than did STRF models, the limitations of FRFs compared with STRFs should be clearly noted. FRFs as we have described them here are limited to predicting responses to the repertoire of notes that were tested. We have yet to extend this approach so as to predict responses to arbitrary notes. In distinct contrast, a STRF model that is a good prediction of a neuron's response will, in principle, predict the response to any stimulus. There may be a basis set embedded with starling notes, but if so we have yet to delineate it.
Correspondingly, it is not yet clear which aspects of the complex tuning of CMM neurons emerge within CMM and which are inherited from its afferents. Little is known about receptive field properties of the neurons that project to CMM in the caudolateral mesopallium (CLM) and the caudomedial nidopallium (NCM). Gene expression studies indicate that different vocal gestures from canary song may form distinct representations in NCM (Ribeiro et al. 1998). In the zebra finch, neurons in the L1 and L3 subregions of field L tend to be tuned to simple spectrotemporal modulations (i.e., onsets and offsets, pure tones, and simple frequency sweeps) that are common in conspecific song (Sen et al. 2001; Woolley et al. 2005). In starlings, many units in these areas respond selectively to species-specific features of vocalizations (Bonke et al. 1979; Leppelsack and Vogt 1976). Convergence by afferents tuned to simpler, slightly different structures is thought to account for the emergence of complexity in a number of systems (Hubel and Wiesel 1962; Jortner et al. 2007; Kobatake and Tanaka 1994; Riesenhuber and Poggio 2002). Thus further convergence of afferents to NCM and CLM, as well as nonlinearities such as high spike thresholds (Escabi et al. 2005), nonlinear intensity dependence (Ahrens et al. 2008; Nagel and Doupe 2008), or sensitivity to multiple spectrotemporal features (Atencio et al. 2008) could build more complex receptive fields and contribute to further increases in selectivity in the songbird auditory system. Feedback mechanisms may also be involved, as CMM makes extensive projections back to CLM and NCM (Vates et al. 1996). FRFs could provide a valuable tool in exploring the emergence of selectivity in these areas.
Emergence of selectivity for complex objects in CMM
Although the FRF accounted for a much larger proportion of the variance in CMM responses than any previous model, substantial nonlinearities remained. These were observed as facilitative and suppressive interactions between notes. More than 30% of the note responses were significantly suppressed in the context of the motif, and 19% of the note responses were facilitated. Although facilitation could be caused by inappropriate segmentation of the motifs, for instance if an excitatory spectrotemporal pattern is split across features, suppression suggests long-range interactions between notes that would otherwise be excitatory. The higher prevalence of suppression thus provides further support for the idea that notes encapsulate the excitatory features for CMM neurons.
Suppressive interactions may be involved in the selectivity of CMM neurons. They are a potential mechanism for temporal combination sensitivity, which has been commonly observed in the song system (Margoliash 1983; Margoliash and Fortune 1992), and here would probably involve lateral inhibition between CMM neurons. In support of this model, selective cells appeared to be drawn primarily from a single class of neurons (Fig. 4); these may be principal neurons. Other neurons were significantly less selective and exhibited much narrower spike shapes and higher spontaneous rates, properties often associated with interneurons (McCormick et al. 1985; Rauske et al. 2003). Lateral inhibition can sharpen tuning and increase the precision of responses to preferred stimuli (Tan et al. 2004; Wehr and Zador 2003), which could explain the correlation between selectivity and spike timing precision observed here (Fig. 5C).
Effects of behavioral state
Neurons in this study were recorded under restrained, unanesthetized conditions and also under urethane anesthesia. In contrast to a previous study (Capsius and Leppelsack 1999), we saw no significant differences in spontaneous firing rate or the proportion of auditory units. However, our data are from well-isolated single units that were only presented with conspecific stimuli, whereas the earlier study measured multiunit responses to a wide variety of natural and synthetic stimuli. If there are enough neurons in CMM that are not strongly auditory but show state-dependent changes in their activity, this could account for the differences between our results. Spike timing precision and intertrial correlation were significantly higher in the unanesthetized state, which is consistent with the effects of anesthesia on the balance of excitation and inhibition, and the effects of this balance on spike reliability and timing (McCormick et al. 1985; Tan et al. 2004; Wehr and Zador 2003). In addition, facilitative interactions between notes were more likely in unanesthetized birds, which suggests increased selectivity for complex spectrotemporal patterns. We observed no significant difference in motif selectivity between states, but given the high variance in SI across neurons, the sample size may not be large enough to draw any firm conclusions.
Our results suggest a hierarchical model of auditory processing in which neurons in CMM represent the identity of complex auditory objects through a linear combination of inputs tuned to specific auditory features. These auditory features are present in notes, suggesting that auditory processing in starlings may be specialized for elements that have salience for both the production and interpretation of vocal communication. Our data show parallels to the emergence of selectivity for complex features in primary and secondary areas of other modalities (Jortner et al. 2007; Kobatake and Tanaka 1994; Riesenhuber and Poggio 2002), suggesting common mechanisms for the detection of patterned information in sensory data.
GRANTS
This work was supported by National Institute of Deafness and Other Communication Disorders Grants DC-007206 and F32 DC-008752 and National Science Foundation Grant DMS-07-06048.
Supplementary Material
ACKNOWLEDGMENTS
We thank S. M. Sherman and J. N. MacLean for comments on a previous version of the manuscript.
Footnotes
The online version of this article contains supplemental data.
REFERENCES
- Adret-Hausberger M, Jenkins PF. Complex organization of the warbling song in starlings. Behaviour 107: 138–156, 1988 [Google Scholar]
- Aertsen AM, Johannesma PI. The spectro-temporal receptive field. A functional characteristic of auditory neurons. Biol Cybern 42: 133–143, 1981 [DOI] [PubMed] [Google Scholar]
- Ahrens MB, Linden JF, Sahani M. Nonlinearities and contextual influences in auditory cortical responses modeled with multilinear spectrotemporal methods. J Neurosci 28: 1929–1942, 2008 [DOI] [PMC free article] [PubMed] [Google Scholar]
- Atencio CA, Sharpee TO, Schreiner CE. Cooperative nonlinearities in auditory cortical neurons. Neuron 58: 956–966, 2008 [DOI] [PMC free article] [PubMed] [Google Scholar]
- Barlow HB. Pattern recognition and the responses of sensory neurons. Ann NY Acad Sci 156: 872–881, 1969 [DOI] [PubMed] [Google Scholar]
- Bar-Yosef O, Rotman Y, Nelken I. Responses of neurons in cat primary auditory cortex to bird chirps: effects of temporal and spectral context. J Neurosci 22: 8619–8632, 2002 [DOI] [PMC free article] [PubMed] [Google Scholar]
- Bonke D, Scheich H, Langner G. Responsiveness of units in the auditory neostriatum of the guinea fowl (Numida meleagris) to species-specific calls and synthetic stimuli. J Comp Physiol [A] 132: 243–255, 1979 [Google Scholar]
- Britten KH, Shadlen MN, Newsome WT, Movshon JA. The analysis of visual motion: a comparison of neuronal and psychophysical performance. J Neurosci 12: 4745–4765, 1992 [DOI] [PMC free article] [PubMed] [Google Scholar]
- Capsius B, Leppelsack HJ. Influence of urethane anesthesia on neural processing in the auditory cortex analogue of a songbird. Hear Res 96: 59–70, 1999 [DOI] [PubMed] [Google Scholar]
- Christianson GB, Sahani M, Linden JF. The consequences of response nonlinearities for interpretation of spectrotemporal receptive fields. J Neurosci 28: 446–455, 2008 [DOI] [PMC free article] [PubMed] [Google Scholar]
- Dahmen JC, King AJ. Learning to hear: plasticity of auditory cortical processing. Curr Opin Neurobiol 17: 456–464, 2007 [DOI] [PubMed] [Google Scholar]
- Eens M. Understanding the complex song of the European starling: an integrative approach. Adv Stud Behav 26: 355–434, 1997 [Google Scholar]
- Eens M, Pinxten M, Verheyen RF. Temporal and sequential organization of song bouts in the European starling. Ardea 77: 75–86, 1989 [Google Scholar]
- Eens M, Pinxten R, Verheyen RF. Male song as a cue for mate choice in the European starling. Behaviour 116: 210–238, 1991 [Google Scholar]
- Eggermont JJ, Aertsen AMHJ, Johannesma PIM. Quantitative characterisation procedure for auditory neurons based on the spectro-temporal receptive field. Hear Res 10: 167–190, 1983 [DOI] [PubMed] [Google Scholar]
- Escabí MA, Nassiri R, Miller LM, Schreiner CE, Read HL. The contribution of spike threshold to acoustic feature selectivity, spike information content, and information throughput. J Neurosci 25: 9524–9534, 2005 [DOI] [PMC free article] [PubMed] [Google Scholar]
- Feare CJ. The Starling Oxford, UK: Oxford, 1984 [Google Scholar]
- Gardner T, Cecchi G, Magnasco M, Laje R, Mindlin GB. Simple motor gestures for birdsongs. Phys Rev Lett 87: 208101, 2001 [DOI] [PubMed] [Google Scholar]
- Gentner TQ, Fenn KM, Margoliash D, Nusbaum HC. Recursive syntactic pattern learning by songbirds. Nature 440: 1204–1207, 2006 [DOI] [PMC free article] [PubMed] [Google Scholar]
- Gentner TQ, Hulse SH. Perceptual mechanisms for individual vocal recognition in European starlings, Sturnus vulgaris. Anim Behav 56: 579–594, 1998 [DOI] [PubMed] [Google Scholar]
- Gentner TQ, Hulse SH. Female European starling preference and choice for variation in conspecific male song. Anim Behav 59: 443–458, 2000a [DOI] [PubMed] [Google Scholar]
- Gentner TQ, Hulse SH. Perceptual classification based on the component structure of song in European starlings. J Acoust Soc Am 107: 3369–3381, 2000b [DOI] [PubMed] [Google Scholar]
- Gentner TQ, Margoliash D. The neuroethology of vocal communication: perception and cognition. In: Acoustic Communications, edited by Simmons A. PANSpringer-Verlag, 2002, chapt. 7, p. 324–386 [Google Scholar]
- Gentner TQ, Margoliash D. Neuronal populations and single cells representing learned auditory objects. Nature 424: 669–674, 2003 [DOI] [PMC free article] [PubMed] [Google Scholar]
- Grace JA, Amin N, Singh NC, Theunissen FE. Selectivity for conspecific song in the zebra finch auditory forebrain. J Neurophysiol 89: 472–487, 2003 [DOI] [PubMed] [Google Scholar]
- Hausberger M. Social influences on song acquisition and sharing in the European starling (Sturnus vulgaris). In: Social Influences on Vocal Development, edited by Snowden C, Hausberger M. Cambridge MA: Cambridge, 1997, p. 128–156 [Google Scholar]
- Hsu A, Borst A, Theunissen FE. Quantifying variability in neural responses and its application for the validation of model predictions. Network 15: 91–109, 2004 [PubMed] [Google Scholar]
- Hubel DH, Wiesel TN. Receptive fields, binocular interaction, and functional architecture in cat's visual cortex. J Physiol 160: 106–156, 1962 [DOI] [PMC free article] [PubMed] [Google Scholar]
- Jortner RA, Farivar SS, Laurent G. A simple connectivity scheme for sparse coding in an olfactory system. J Neurosci 27: 1659–1669, 2007 [DOI] [PMC free article] [PubMed] [Google Scholar]
- Karten HJ. The ascending auditory pathway in the pigeon (Columba livia). II. Telencephalic projections of the nucleus ovoidalis thalami. Brain Res 11: 134–153, 1968 [DOI] [PubMed] [Google Scholar]
- Kobatake E, Tanaka K. Neuronal selectivities to complex object features in the ventral visual pathway of the macaque cerebral cortex. J Neurophysiol 71: 856–867, 1994 [DOI] [PubMed] [Google Scholar]
- Leppelsack HJ, Vogt M. Responses of auditory neurons in the forebrain of a songbird to stimulation with species-specific sounds. J Comp Physiol [A] 107: 263–274, 1976 [Google Scholar]
- Lewicki MS, Arthur BJ. Hierarchical organization of auditory temporal context sensitivity. J Neurosci 16: 6987–6998, 1996 [DOI] [PMC free article] [PubMed] [Google Scholar]
- Liberman AM, Harris KS, Kinney JA, Lane H. The discrimination of relative onset-time of the components of certain speech and nonspeech patterns. J Exp Psychol 61: 379–388, 1961 [DOI] [PubMed] [Google Scholar]
- Margoliash D. Acoustic parameters underlying the responses of song-specific neurons in the white-crowned sparrow. J Neurosci 3: 1039–1057, 1983 [DOI] [PMC free article] [PubMed] [Google Scholar]
- Margoliash D. Preference for autogenous song by auditory neurons in a song system nucleus of the white-crowned sparrow. J Neurosci 6: 1643–1661, 1986 [DOI] [PMC free article] [PubMed] [Google Scholar]
- Margoliash D, Fortune ES. Temporal and harmonic combination-sensitive neurons in the zebra finch's HVc. J Neurosci 12: 4309–4326, 1992 [DOI] [PMC free article] [PubMed] [Google Scholar]
- McCormick DA, Connors BW, Lighthall JW, Prince DA. Comparative electrophysiology of pyramidal and sparsely spiny stellate neurons of the neocortex. J Neurophysiol 54: 782–806, 1985 [DOI] [PubMed] [Google Scholar]
- Müller CM, Leppelsack HJ. Feature extraction and tonotopic organization in the avian auditory forebrain. Exp Brain Res 59: 587–599, 1985 [DOI] [PubMed] [Google Scholar]
- Nagel KI, Doupe AJ. Organizing principles of spectro-temporal encoding in the avian primary auditory area field L. Neuron 58: 938–955, 2008 [DOI] [PMC free article] [PubMed] [Google Scholar]
- Narayan R, Best V, Ozmeral E, McClaine E, Dent M, Shinn-Cunningham B, Sen K. Cortical interference effects in the cocktail party problem. Nat Neurosci 10: 1601–1607, 2007 [DOI] [PubMed] [Google Scholar]
- Nelson DA, Marler P. Categorical perception of a natural stimulus continuum: birdsong. Science 244: 976–978, 1989 [DOI] [PubMed] [Google Scholar]
- Olshausen BA, Field DJ. Sparse coding of sensory inputs. Curr Opin Neurobiol 14: 481–487, 2004 [DOI] [PubMed] [Google Scholar]
- O'Neill WE, Suga N. Target range-sensitive neurons in the auditory cortex of the mustache bat. Science 203: 69–73, 1979 [DOI] [PubMed] [Google Scholar]
- Peña JL, Konishi M. Auditory spatial receptive fields created by multiplication. Science 292: 249–252, 2001 [DOI] [PubMed] [Google Scholar]
- Prather JF, Nowicki S, Anderson RC, Peters S, Mooney R. Neural correlates of categorical perception in learned vocal communication. Nat Neurosci 12: 221–228, 2009 [DOI] [PMC free article] [PubMed] [Google Scholar]
- Rauschecker JP. Cortical processing of complex sounds. Curr Opin Neurobiol 8: 516–521, 1998 [DOI] [PubMed] [Google Scholar]
- Rauske PL, Shea SD, Margoliash D. State and neuronal class-dependent reconfiguration in the avian song system. J Neurophysiol 89: 1688–1701, 2003 [DOI] [PubMed] [Google Scholar]
- Ribeiro S, Cecchi GA, Magnasco MO, Mello CV. Toward a song code: evidence for a syllabic representation in the canary brain. Neuron 21: 359–371, 1998 [DOI] [PubMed] [Google Scholar]
- Riesenhuber M, Poggio T. Neural mechanisms of object recognition. Curr Opin Neurobiol 12: 162–168, 2002 [DOI] [PubMed] [Google Scholar]
- Roeder KD. Auditory system of noctuid moths. Science 154: 1515–1521, 1966 [DOI] [PubMed] [Google Scholar]
- Romo R, Salinas E. Flutter discrimination: neural codes, perception, memory and decision making. Nat Rev Neurosci 4: 203–218, 2003 [DOI] [PubMed] [Google Scholar]
- Searcy WA, Nowicki S, Peters S. Song types as fundamental units in vocal repertoires. Anim Behav 58: 37–44, 1999 [DOI] [PubMed] [Google Scholar]
- Sen K, Theunissen FE, Doupe AJ. Feature analysis of natural sounds in the songbird auditory forebrain. J Neurophysiol 86: 1445–1458, 2001 [DOI] [PubMed] [Google Scholar]
- Sharpee T, Rust NC, Bialek W. Analyzing neural responses to natural signals: maximally informative dimensions. Neural Comput 16: 223–250, 2004 [DOI] [PubMed] [Google Scholar]
- Sharpee TO, Miller KD, Stryker MP. On the importance of static nonlinearity in estimating spatiotemporal neural filters with natural stimuli. J Neurophysiol 99: 2496–2509, 2008 [DOI] [PMC free article] [PubMed] [Google Scholar]
- Suga N. Specialization of the auditory system for reception and processing of species-specific sounds. Federation Proc 37: 2342–2354, 1978 [PubMed] [Google Scholar]
- Tan AYY, Zhang LI, Merzenich MM, Schreiner CE. Tone-evoked excitatory and inhibitory synaptic conductances of primary auditory cortex neurons. J Neurophysiol 92: 630–643, 2004 [DOI] [PubMed] [Google Scholar]
- Theunissen FE. From synchrony to sparseness. Trends Neurosci 26: 61–64, 2003 [DOI] [PubMed] [Google Scholar]
- Theunissen FE, Amin N, Shaevitz SS, Woolley SMN, Fremouw T, Hauber ME. Song selectivity in the song system and in the auditory forebrain. Ann NY Acad Sci 1016: 222–245, 2004 [DOI] [PubMed] [Google Scholar]
- Theunissen FE, David SV, Singh NC, Hsu A, Vinje WE, Gallant JL. Estimating spatio-temporal receptive fields of auditory and visual neurons from their responses to natural stimuli. Network 12: 289–316, 2001 [PubMed] [Google Scholar]
- Vates GE, Broome BM, Mello CV, Nottebohm F. Auditory pathways of caudal telencephalon and their relation to the song system of adult male zebra finches. J Comp Neurol 366: 613–642, 1996 [DOI] [PubMed] [Google Scholar]
- Wang L, Narayan R, Graña G, Shamir M, Sen K. Cortical discrimination of complex natural stimuli: can single neurons match behavior? J Neurosci 27: 582–589, 2007 [DOI] [PMC free article] [PubMed] [Google Scholar]
- Wehr MS, Zador AM. Balanced inhibition underlies tuning and sharpens spike timing in auditory cortex. Nature 426: 442–446, 2003 [DOI] [PubMed] [Google Scholar]
- Wilczynski W, Capranica RR. The auditory system of anuran amphibians. Prog Neurobiol 22: 1–38, 1984 [DOI] [PubMed] [Google Scholar]
- Wild JM, Karten HJ, Frost BJ. Connections of the auditory forebrain in the pigeon (Columba livia). J Comp Neurol 337: 32–62, 1993 [DOI] [PubMed] [Google Scholar]
- Woolley SMN, Fremouw TE, Hsu A, Theunissen FE. Tuning for spectro-temporal modulations as a mechanism for auditory discrimination of natural sounds. Nat Neurosci 8: 1371–1379, 2005 [DOI] [PubMed] [Google Scholar]
- Zaraza DG, Margoliash D. The population representation of auditory objects rapidly expands and then contracts during learning. Soc Neurosci Abstr 33: 403.3, 2007 [Google Scholar]
- Zeileis A. Econometric computing with HC and HAC covariance matrix estimators. J Stat Soft 11: 1–17, 2004 [Google Scholar]
- Zoccolan D, Kouh M, Poggio T, DiCarlo JJ. Trade-off between object selectivity and tolerance in monkey inferotemporal cortex. J Neurosci 27: 12292–12307, 2007 [DOI] [PMC free article] [PubMed] [Google Scholar]
Associated Data
This section collects any data citations, data availability statements, or supplementary materials included in this article.


