Abstract
Iron-induced cardiac dysfunction is a leading cause of death in transfusion-dependent anemia. MRI relaxation rates R2(1/T2) and accurately predict liver iron concentration, but their ability to predict cardiac iron has been challenged by some investigators. Studies in animal models support similar R2 and behavior with heart and liver iron, but human studies are lacking. To determine the relationship between MRI relaxivities and cardiac iron, regional variations in R2 and were compared with iron distribution in one freshly deceased, unfixed, iron-loaded heart. R2 and were proportionally related to regional iron concentrations and highly concordant with one another within the interventricular septum. A comparison of postmortem and in vitro measurements supports the notion that cardiac should be assessed in the septum rather than the whole heart. These data, along with measurements from controls, provide bounds on MRI-iron calibration curves in human heart and further support the clinical use of cardiac MRI in iron-overload syndromes.
Keywords: postmortem, T2, , iron, heart, thalassemia
Iron-induced cardiac dysfunction is a leading cause of death in patients with thalassemia major (1,2). Since iron shortens the MRI relaxation parameters T2 and , decreased cardiac has been advocated as a early marker of myocardial iron deposition (3-5). Animal studies support this hypothesis (6,7); however, it remains uncertain whether cardiac truly reflects myocardial iron in humans (8-10). To date, clinically useful calibration curves have been obtained between human liver iron stores and MRI relaxation rates R2 (1/T2) and using liver biopsy as a gold standard (4,11,12). However, similar direct validation has not been performed for the human heart because of the difficulty of performing a cardiac biopsy and the variability of the results. There is also disagreement regarding the relative merits of R2 and techniques for accurate cardiac iron quantitation. methods have higher iron sensitivity and fewer motion artifacts, and employ shorter echo times (TEs) than R2 methods, but are affected by susceptibility artifacts. The purpose of this study was to use local fluctuations in cardiac iron concentration to determine the relationship among R2, , and cardiac iron in sections of a freshly deceased heart from an iron-loaded patient.
MATERIALS AND METHODS
A 24-year-old thalassemia major patient with longstanding cardiac and liver iron overload, documented by MRI, succumbed to overwhelming biliary sepsis. Informed consent for MRI and a limited heart autopsy was obtained from the patient's family. A review of the medical data was also approved by the Committee on Clinical Investigations of the Children's Hospital Los Angeles. The patient underwent in situ, postmortem assessment of cardiac R2 and on a 1.5 T clinical scanner (General Electric CVi, system 9.1) using a four-element torso coil, within 3 hr of demise. R2 measurements were obtained using single spin-echo acquisitions (TE = 8, 10, 15, 20, 30, 40, 60, 100 ms, TR = 1 s, resolution 1.4 × 1.4 × 8 mm). measurements used a multiecho gradient-echo sequence (TE = 2.1, 4.8, 7.5, 10.2, 13.0, 15.7, 18.4, 21.1 ms; TR = 1 s; resolution = 1.4 × 1.4 × 8 mm). All measurements were performed over the short axis of the heart. The procedure was performed at a room temperature of 25°C. The patient's body temperature was not measured, but can be roughly approximated to 35–37°C based on the time of death (13).
The heart was harvested 12 hr later, sectioned, and maintained under moist conditions at room temperature for an additional 12 hr. Repeat R2 and measurements were performed using the knee coil on three short-axis slices, in vitro at 25°C. Each slice was placed between two circular plexi-glass blocks (1 inch thick, 3.5 inches in diameter) situated in a 250-mL, saline-filled glass beaker. R2 measurements were obtained using single spin-echo acquisitions (TE = 9, 11, 15, 20, 30, 40, 60, 100 ms, TR = 1 s; resolution = 0.93 × 0.93 × 6 mm). measurements used a multiecho gradient-echo sequence (TE = 2.1, 4.8, 7.5, 10.2, 13.0, 15.7, 18.4, 21.1 ms; TR = 1 s; resolution 0.93 × 0.93 × 6 mm).
The slices were subsequently sectioned into 12 subdivisions: four circumferential segments (segments 1–4) and three radial layers (endocardium, myocardium, and epicardium). After its insertion points were carefully noted, the right ventricle was trimmed away. Segment 1 represents the interventricular septum, segment 2 represents the posterior wall, and segments 3 and 4 represent the anterolateral and anterior walls, respectively. The septal boundary was defined by right ventricle insertions, and the remaining muscle was divided into three equal segments. Each of the circumferential segments was divided into three layers of equal thickness from the inner to the outer wall. Each piece was weighed (wet weight) and sent to the Mayo Medical Laboratory (Rochester, MN, USA) for iron quantitation. The referral laboratory reported the final tissue dry weight (after desiccation) and dry weight iron concentrations. This allowed us to calculate the tissue wet-to-dry-weight ratios and hence the wet-weight iron concentrations.
Because of the absence of heart motion, no image registration (alignment) was required for any given TE. Signal decay for every pixel within each anatomical slice was fit to a monoexponential function plus a constant term to obtain a R2 and map. The offset correction (represented by a constant term) helps compensate for contributions from noise bias, heterogeneous iron distribution in myocytes, analog-to-digital signal offsets, iron-poor tissue, and myocardial blood (the correction is essential to avoid underestimation at high iron concentration) (14).
Since the imaged tissue did not have fiducial markers to colocalize the assayed iron concentration and the measured relaxivity, the following approximation was performed for coregistration: Endo- and epicardial boundaries of the left ventricle were manually identified on the relaxivity maps. The region between the contours was subdivided into four circumferential segments such that number of pixels within each segment (on the image) was proportional to the total wet weight of the segment (sum of endocardial, myocardial, and epicardial subdivisions) sent for analysis. Segment 1 was centered between the two right ventricle insertion points on the image, and the circumferential extent of the segments was calculated according to segment mass ratios. Each segmental region on the image was divided into three radial divisions using similar conservation of mass principles. This approach assumes that the anatomic section thickness and tissue density are uniform, and this assumption was verified by localizer images. To decrease misregistration error, iron concentration and relaxivity were rebinned on a radial and circumferential basis for plotting and statistical purposes.
The in situ and in vitro MRI measurements were compared with those obtained prior to the patient's demise. The in vivo measurements were performed using a single-echo gradient-echo sequence with TE = 2, 3, 4, 6, 9, 12, 15, 18 ms; TR = 21 ms; and resolution = 1.4 × 1.4 × 8 mm. No in vivo R2 measurements were performed.
RESULTS
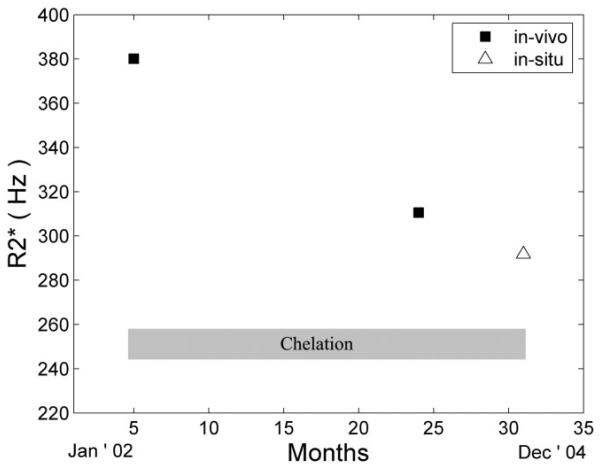
The patient's cardiac , 23 months prior to demise (in vivo), was 382 Hz ( = 2.6 ms) measured in the interventricular septum. With continuous subcutaneous deferoxamine therapy, it fell to 312 Hz ( = 3.2 ms), 6 months prior to demise. The in situ (postmortem) value for interventricular septum was 294 Hz ( = 3.4 ms), consistent with the previous trajectory (Fig. 1). Moreover, in vivo and in situ distributions within the septum were similar. The mean in situ R2 value was 78.7 Hz (T2 = 12.7 ms), but there were no in vivo R2 measurements for comparison.
FIG. 1.
Evolution of over time. Continuous subcutaneous chelation (shaded box) was initiated shortly after the first MRI examination. The in situ (postmortem) MRI value (open triangle) is concordant with the trajectory from the prior two in vivo examinations.
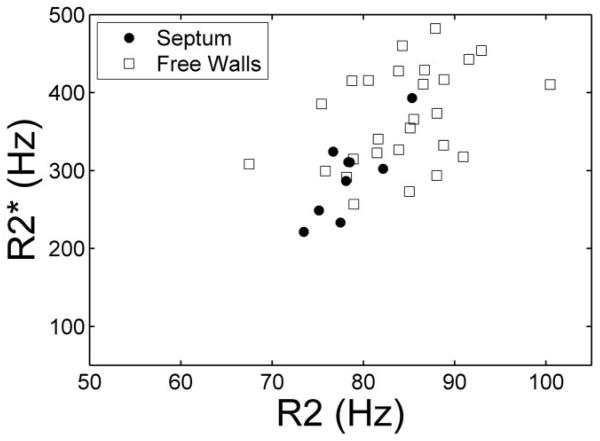
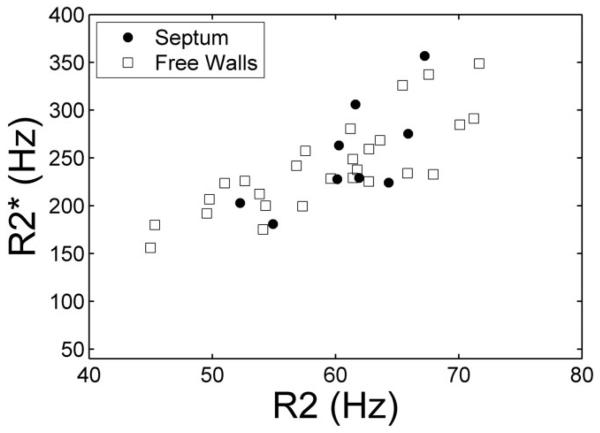
In situ R2 and values (Fig. 2) were highly correlated with one another in the interventricular septum (r = 0.81, P < 0.01). Agreement between R2 and was significantly poorer in the other regions of the ventricle (r = 0.42, P < 0.05), but maintained the same proportional behavior.
FIG. 2.
Plot of vs. R2 in the interventricular septum (solid dots) and free walls (squares) measured from images collected in situ. Although the overall trend is similar in both regions, variability is much higher in the free walls.
The myocardial wet-to-dry weight ratio was 6.99 ± 0.41, which is similar to autopsy data reported by Buja and Roberts (15). The epicardial wet-to-dry ratio values were excluded from this calculation because of confounding contributions of epicardial fat. Using this observed wet-todry weight ratio, average iron concentration in the heart was 1.14 mg/g wet tissue weight (range = 0.77–1.50 mg/g) as compared to a normal value of 0.06 mg/g (range = 0.02–0.12 mg/g) (16). The coefficient of variation (COV) across all measurement sites was 16%, and the sample weight was an average of 1.59 g, or roughly 50-fold greater than the in situ voxel volume. Iron concentrations were 7–9% higher than average in the interventricular septum and 13% less in the posterior wall. This pattern was highly conserved across slices, with a COV of only 0.9–2.5%. The endocardium had 16% less iron than average, while the myocardium and epicardium iron concentrations were 7% and 5% higher, respectively.
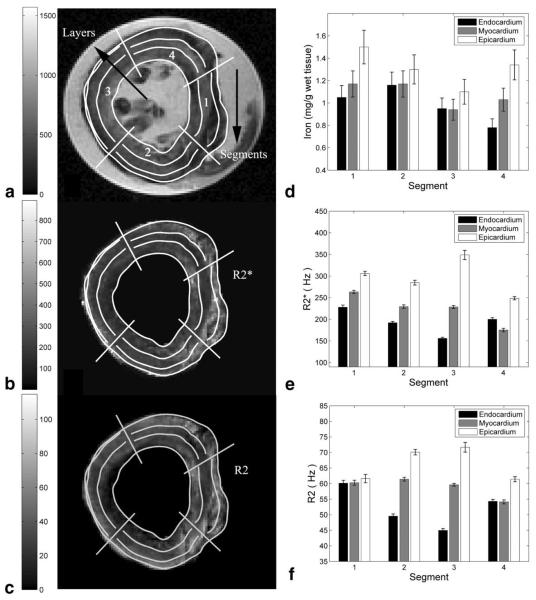
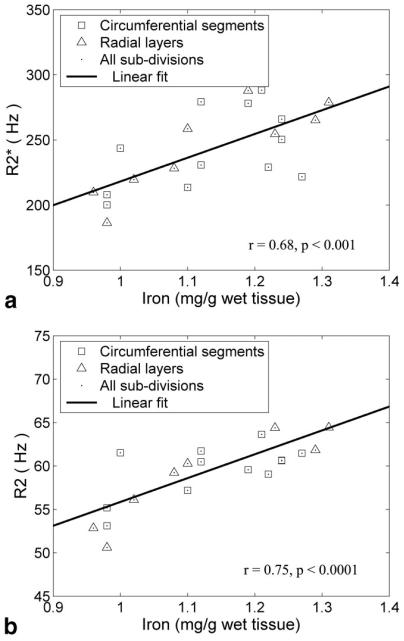
In vitro measurements of R2 and were 30% lower, and relaxivity histograms demonstrated a 3–9% lower COV compared to slice-matched in situ measurements. These changes were generally smaller within the septum as compared to the other segments and were identical for R2 and . Figure 3 demonstrates the MRI and iron findings from an in vitro slice nearest to the anatomic level used for clinical measurements. Figure 3A is a gradient-echo image (TE = 4.8 ms), and Fig. 3b and c are the corresponding and R2 images, respectively. Dark areas in the gradient-echo image represent iron-induced signal loss; these areas are bright on both the and R2 images. Figure 3d–f compare the mean regional iron concentration, and R2 for this slice, respectively. Regional variations in MRI parameters were similar to one another and to the measured iron content. Figure 4a and b demonstrate scattergrams of and R2 with iron concentration. MRI and iron values were averaged by segments and by layers to decrease variability from mis-registration of the subdivisions. and R2 rose linearly with cardiac iron with r = 0.68 (P < 0.001) and 0.75 (P < 0.0001), respectively. changes were sixfold more sensitive than R2 measurements but demonstrated greater variability, particularly with respect to circumferential location. and R2 also varied linearly with one another (r = 0.83, P < 0.00001; Fig. 5). In contrast to the in situ measurements, concordance was as high in the free walls as it was in the interventricular septum.
FIG. 3.
a: -weighted gradient-echo image of a mid-papillary slice (TE = 4.8 ms) in vitro. The 12 subdivisions (four circumferential segments, each with three radial layers) are indicated. b and c: Corresponding and R2 maps, respectively (note the high spatial concordance between the maps and the image). Both maps suggest that high relaxivity regions (bright) are predominantly in the myocardium and epicardium. d–f: Average iron, , and R2 values within the subdivisions. Both R2 and variation within the segments is in close agreement with true iron deposition.
FIG. 4.
Plots a and b demonstrate that and R2 increase proportionally to cardiac iron. The plots show averaged values over subsegments and layers for all three in vitro slices. exhibits greater sensitivity to iron and greater circumferential variability than R2.
FIG. 5.
Plot of vs. R2 in the interventricular septum (solid dots) and free walls (squares) measured from images collected in vitro. The correspondence between R2 and is now quite high in all regions of the heart.
DISCUSSION
Direct tissue validation and calibration of cardiac iron measurements by MRI is difficult because biopsy is risky and has unacceptable sampling variability (16,17). While a recent study (18) reported qualitative concordance between T2 and cardiac biopsy evaluation in 80% of the patient population, variability precluded the derivation of a calibration curve. Autopsy specimens represent an alternative mechanism to examine MRI–iron relationships, but are limited by organ availability as well as the unknown effects of tissue fixation. While iron-overloaded organs may be scarce, one can exploit the intrinsic variability of tissue iron distribution to derive MRI-iron calibration curves. This approach was used successfully in the liver (19) to demonstrate that R2 retained its proportional relationship with iron even in iron-poor areas such as vascular structures and regions of macronodular cirrhosis.
The present study is unique in that image acquisition was performed in situ as well as in vitro in fresh, unpreserved cardiac tissue, which eliminated the confounding influence of formalin fixation. However, even with fastest practical specimen processing time, in vitro relaxivities were significantly lower than matched in situ values. Since R2 and histograms were shifted homogeneously leftward, these changes most likely represent fluid shifts from the loss of cellular homeostatic mechanisms producing a “dilution” effect. The relatively high wet-to-dry ratio of 6.99 supports this hypothesis. Fortunately, dilution should not change the slope or intercepts of the R2–iron and –iron relationships, only the dynamic range of both axes.
A second possible explanation for the difference between in situ (postmortem) and in vitro relaxivities is that the examinations were performed at different body/tissue temperatures. The spontaneous nature of the experiment did not provide enough time to arrange for temperature-controlled in vitro imaging. Temperature changes typically cause larger changes in R1 than R2, but iron-based R2 relaxation can be modulated by changes in the diffusion coefficient. The absolute temperature was approximately 3% lower (approximately 308°K vs. 298°K) for the in vitro images. This will lower proton mobility to an unknown degree, increasing proton residence times near susceptibility centers, in a manner similar to increasing the “effective” length scale of iron. As a result, one would expect greater static refocusing and consequently greater disparity between R2 and values. In contrast, the parallel shifts in R2 and curves we observed are more consistent with fluid shifts than temperature-mediated changes in diffusion.
Since R2 and are tightly correlated with one another (r = 0.94) in the liver (12), one would expect a similar relationship to exist in the heart. However, the heart possesses a much more complicated geometry in that it has multiple interfaces between tissues of different susceptibility. These boundary effects may disturb in an iron-independent manner, disrupting the correlation between and R2. Intuitively, one would expect these differences to be minimized by measurements in the interventricular septum, because there is blood on both sides of the wall. As a result, clinical measurements are typically restricted to this region (3,5). Figures 2 and 5 support that practice. In vitro, with air and other organ boundaries removed, and R2 were equally well correlated in the septum and ventricular free walls (Fig. 5). However, the free-wall vs. R2 correlations were greatly weakened in situ (Fig. 2), which suggests that values are modulated by susceptibility artifacts. Although deoxygenated blood in the cardiac veins has been suggested as a source of these errors in non-iron-overloaded patients (mean = 25–30 Hz), it is unlikely to contribute significantly when the mean is an order of magnitude larger. We conclude that global assessments of cardiac should be treated with caution. Mean values may be representative of mean cardiac iron levels, but local fluctuations are likely to be confounded by geometrically induced magnetic field distortions.
The cardiac iron distributions observed in this patient were consistent with prior autopsy reports (15,16). Iron loading was heaviest in the epicardium and myocardium. Circumferential variation was noted, with less iron observed in the inferior and posteromedial walls. The slice-to-slice reproducibility of these patterns was extremely high (COV < 2.5%), suggesting that these patterns are not merely chance fluctuations. Further studies are needed to corroborate these observations, but slice-to-slice variability observed in cardiac measurements should not necessarily be assumed to reflect true fluctuations in cardiac iron content.
The main limitation of this study is that it involved a single iron-loaded heart and not a patient cohort. This is unavoidable given the relative scarcity of the disease and social barriers to rapid postmortem imaging and expedited autopsy. As a result, the range of iron values and relaxivities was only about half of the dynamic range found in thalassemia patients. Larger autopsy studies using formalin-fixed tissue will be necessary to sample a greater iron range, determine interpatient variability, and assess the true linearity of the – and R2–iron relationships.
The second limitation is the imperfect registration between image data and the underlying iron distribution. It is likely that the correlation between iron and transverse relaxivity would have been even stronger if this process could have been more tightly controlled.
This study is the first to demonstrate unequivocally that cardiac R2 and are predominantly determined by cardiac iron concentration in humans. The intrinsic iron variability within this specimen was limited to the upper half of the clinically-relevant range, and hence it was not possible to completely characterize the R2 and calibration curves. However, cardiac and cardiac iron concentrations have been well characterized in normal hearts (3,5,20), so constrained linear fits place reasonable bounds to the human cardiac calibration curves. Despite the inherent limitations of a single-specimen study, these data provide additional support for the clinical use of either R2 or measurements for cardiac iron assessment.
ACKNOWLEDGMENT
We are grateful to have known the soul who has moved on; her generous spirit continues.
Grant sponsor: General Clinical Research Center, NIH; Grant number: RR00043-43; Grant sponsor: National Heart Lung and Blood Institute, NIH; Grant number: 1 R01 HL75592-01A1; Grant sponsors: Department of Pediatrics, Children's Hospital Los Angeles; Novartis Pharma AG.
REFERENCES
- 1.Zurlo MG, De Stefano P, Borgna-Pignatti C, Di Palma A, Piga A, Melevendi C, Di Gregorio F, Burattini MG, Terzoli S. Survival and causes of death in thalassaemia major. Lancet. 1989;2:27–30. doi: 10.1016/s0140-6736(89)90264-x. [DOI] [PubMed] [Google Scholar]
- 2.Olivieri NF, Nathan DG, MacMillan JH, Wayne AS, Liu PP, McGee A, Martin M, Koren G, Cohen AR. Survival in medically treated patients with homozygous beta-thalassemia. N Engl J Med. 1994;331:574–578. doi: 10.1056/NEJM199409013310903. [DOI] [PubMed] [Google Scholar]
- 3.Anderson LJ, Holden S, Davis B, Prescott E, Charrier CC, Bunce NH, Firmin DN, Wonke B, Porter J, Walker JM, Pennell DJ. Cardiovascular T2-star (T2*) magnetic resonance for the early diagnosis of myocardial iron overload. Eur Heart J. 2001;22:2171–2179. doi: 10.1053/euhj.2001.2822. [DOI] [PubMed] [Google Scholar]
- 4.Anderson LJ, Wonke B, Prescott E, Holden S, Walker JM, Pennell DJ. Comparison of effects of oral deferiprone and subcutaneous desferrioxamine on myocardial iron concentrations and ventricular function in beta-thalassaemia. Lancet. 2002;360:516–520. doi: 10.1016/s0140-6736(02)09740-4. [DOI] [PubMed] [Google Scholar]
- 5.Wood JC, Tyszka JM, Ghugre N, Carson S, Nelson MD, Coates TD. Myocardial iron loading in transfusion-dependent thalassemia and sickle-cell disease. Blood. 2004;103:1934–1936. doi: 10.1182/blood-2003-06-1919. [DOI] [PubMed] [Google Scholar]
- 6.Wang ZJ, Lian L, Chen Q, Zhao H, Asakura T, Cohen AR. 1/T2 and magnetic susceptibility measurements in a gerbil cardiac iron overload model. Radiology. 2005;234:749–755. doi: 10.1148/radiol.2343031084. [DOI] [PubMed] [Google Scholar]
- 7.Wood J, Otto-Duessel M, Aguilar M, Nick H, Nelson M, Coates T, Pollack H, Moats R. Cardiac iron determines cardiac T2*, T2, and T1 in the gerbil model of iron cardiomyopathy. Circulation. 2005;112:535–543. doi: 10.1161/CIRCULATIONAHA.104.504415. [DOI] [PMC free article] [PubMed] [Google Scholar]
- 8.Fischer R, Engelhardt R. Deferiprone versus desferrioxamine in thalassaemia, and T2* validation and utility. Lancet. 2003;361:182–183. doi: 10.1016/S0140-6736(03)12222-2. author reply 183–184. [DOI] [PubMed] [Google Scholar]
- 9.Pierre TG. Deferiprone versus desferrioxamine in thalassaemia, and T2* validation and utility. Lancet. 2003;361:182. doi: 10.1016/S0140-6736(03)12222-2. author reply 183–184. [DOI] [PubMed] [Google Scholar]
- 10.Brittenham GM, Nathan DG, Olivieri NF, Pippard MJ, Weatherall DJ. Deferiprone versus desferrioxamine in thalassaemia, and T2* validation and utility. Lancet. 2003;361:183. doi: 10.1016/s0140-6736(03)12223-4. author reply 183–184. [DOI] [PubMed] [Google Scholar]
- 11.Pierre TG, Clark PR, Chua-Anusorn W, Fleming AJ, Jeffrey GP, Olynyk JK, Pootrakul P, Robins E, Lindeman R. Noninvasive measurement and imaging of liver iron concentrations using proton magnetic resonance. Blood. 2005;105:855–861. doi: 10.1182/blood-2004-01-0177. [DOI] [PubMed] [Google Scholar]
- 12.Wood JC, Enriquez C, Ghugre N, Tyzka JM, Carson S, Nelson MD, Coates TD. MRI R2 and R2* mapping accurately estimates hepatic iron concentration in transfusion-dependent thalassemia and sickle cell disease patients. Blood. 2005;106:1460–1465. doi: 10.1182/blood-2004-10-3982. [DOI] [PMC free article] [PubMed] [Google Scholar]
- 13.Henssge C. Death time estimation in case work. I. The rectal temperature time of death nomogram. Forensic Sci Int. 1988;38:209–236. doi: 10.1016/0379-0738(88)90168-5. [DOI] [PubMed] [Google Scholar]
- 14.Ghugre NR, Enriquez CM, Coates TD, Nelson MD, Jr, Wood JC. Improved R2* measurements in myocardial iron overload. J Magn Reson Imaging. 2006;23:9–16. doi: 10.1002/jmri.20467. [DOI] [PMC free article] [PubMed] [Google Scholar]
- 15.Buja LM, Roberts WC. Iron in the heart. Etiology and clinical significance. Am J Med. 1971;51:209–221. doi: 10.1016/0002-9343(71)90240-3. [DOI] [PubMed] [Google Scholar]
- 16.Olson LJ, Edwards WD, McCall JT, Ilstrup DM, Gersh BJ. Cardiac iron deposition in idiopathic hemochromatosis: histologic and analytic assessment of 14 hearts from autopsy. J Am Coll Cardiol. 1987;10:1239–1243. doi: 10.1016/s0735-1097(87)80124-9. [DOI] [PubMed] [Google Scholar]
- 17.Fitchett DH, Coltart DJ, Littler WA, Leyland MJ, Trueman T, Gozzard DI, Peters TJ. Cardiac involvement in secondary haemochromatosis: a catheter biopsy study and analysis of myocardium. Cardiovasc Res. 1980;14:719–724. doi: 10.1093/cvr/14.12.719. [DOI] [PubMed] [Google Scholar]
- 18.Mavrogeni SI, Markussis V, Kaklamanis L, Tsiapras D, Paraskevaidis I, Karavolias G, Karagiorga M, Douskou M, Cokkinos DV, Kremastinos DT. A comparison of magnetic resonance imaging and cardiac biopsy in the evaluation of heart iron overload in patients with beta-thalassemia major. Eur J Haematol. 2005;75:241–247. doi: 10.1111/j.1600-0609.2005.00474.x. [DOI] [PubMed] [Google Scholar]
- 19.Clark PR, Chua-Anusorn W, Pierre TG. Proton transverse relaxation rate (R2) images of iron-loaded liver tissuepping local tissue iron concentrations with MRI. Magn Reson Med. 2003;49:572–575. doi: 10.1002/mrm.10378. [DOI] [PubMed] [Google Scholar]
- 20.Rahil-Khazen R, Bolann BJ, Myking A, Ulvik RJ. Multi-element analysis of trace element levels in human autopsy tissues by using inductively coupled atomic emission spectrometry technique (ICP-AES) J Trace Elem Med Biol. 2002;16:15–25. doi: 10.1016/S0946-672X(02)80004-9. [DOI] [PubMed] [Google Scholar]


