Abstract
Integral membrane proteins display two major types of transmembrane structures, helical bundles and beta barrels. The main functional roles of transmembrane proteins are the transport of small molecules and cell signaling, and sometimes these two roles are coupled. For cytosolic, water-soluble proteins, signaling and regulatory functions are often carried out by intrinsically disordered regions. Our long range goal is to determine whether integral membrane proteins likewise often use disordered regions for signaling and regulation. Here we carried out a systematic bioinformatics investigation of intrinsically disordered regions obtained from integral membrane proteins for which crystal structures have been determined, and for which the intrinsic disorder was identified as missing electron density. We found 120 disorder-containing integral membrane proteins having a total of 33,675 residues, with 3209 of the residues distributed among 240 different disordered regions. These disordered regions were compared with those obtained from water-soluble proteins with regard to their amino acid compositional biases, and with regard to accuracies of various disorder predictors. The results of these analyses show that the disordered regions from helical bundle integral membrane proteins, those from beta barrel integral membrane proteins, and those from water soluble proteins all exhibit statistically distinct amino acid compositional biases. Despite these differences in composition, current algorithms make reasonably accurate predictions of disorder for these membrane proteins. Although the small size of the current data sets are limiting, these results suggest that developing new predictors that make use of data from disordered regions in helical bundles and beta barrels, especially as these datasets increase in size, will likely lead to significantly more accurate disorder predictions for these two classes of integral membrane proteins.
Introduction
Several research groups have initiated efforts to use computational approaches to investigate intrinsic disorder within integral membrane proteins 1-5 that include voltage-gated potassium channels 1, notch pathway proteins 2, single-pass membrane proteins from humans 4, and plasma membrane proteins in humans and in bacteria such as E. coli 3. In a few cases experimental evidence supports the existence of disorder in specific regions of some membrane proteins 6-9. These studies have provided valuable insights with regard to the presence and possible role of intrinsic disorder in membrane proteins.
Intrinsically disordered proteins (IDPs) and intrinsically disordered protein regions (IDRs) do not have rigid three dimensional or stable secondary structures under physiological conditions 10-13. Disordered regions can be extended random coils 14, collapsed random coils 15 or premolten globules 16, 17, molten globules 14, 16, 17, or regions with unstable local structures 18, 19. IDPs and IDRs are dynamic ensembles of interconverting conformations. The atom positions and backbone dihedral angles of these conformations vary significantly over time with no specific equilibrium values 20. This dynamic structure in solution is characterized by mobility on different timescales. Also, the multiplicity of conformations almost always precludes IDPs and IDRs from crystallization.
IDPs and IDRs are highly abundant in nature and the overall amount of disorder in proteins increases from bacteria to archaea to eukaryota 14, 21. Conservative estimates show that the percentage of wholly disordered proteins is > 20% for yeast and > 30% for mouse 22. Over half of mammalian proteins contain long predicted IDRs that span 30 or more residues, 21, 23. Even in the Protein Data Bank (PDB), which is highly selective for structured proteins, only approximately 30% of crystal structures are completely devoid of disorder, with the remaining structures exhibiting IDRs of various lengths. It is estimated that about 25% of these IDRs are longer than10 residues in length, and about 5% are longer than 30 residues in length 24. Furthermore, many of the structured eukaryotic proteins in PDB are domains thus representing only parts of the entire protein, which often contain long IDRs that were removed by genetic engineering or proteolysis to facilitate crystallization of the structured regions.
IDPs and IDRs in water-soluble proteins are associated with several biological functions that have been grouped into the following four classes: (a) molecular recognition, (b) molecular assembly, (c) protein modification, and (d) entropic chain activities 25, 26. In one study, 710 Swiss-Prot functional key words could be partitioned into groups of 238, 302, and 170 key words that were positively, negatively, or not correlated with predictions of long disordered regions. A number of the bioinformatics predictions of disorder-associated functions were confirmed by laboratory experiments 27-29. IDPs or IDRs are extensively involved in regulation, signaling, and control pathways 10, 13, 20, 25, 26, 30-37. For example, more than 70% of signaling proteins have long disordered regions 32 and approximately 60% of human transcription factors have long disorder regions 38. The function or malfunction of disordered regions can be directly linked to human diseases, such as cancer, cardiovascular disease, amyloidoses, neurodegenerative disease, and diabetes39. These observations confer a practical importance on the research on IDPs.
Compared to structured proteins, IDPs are distinctive in their amino acid compositions 22, 40-42. IDPs and IDRs are highly enriched in polar and charged residues and in proline, while the structured proteins have more aromatic and aliphatic residues. The abundance of polar and charged residues makes IDPs and IDRs much more flexible. Besides, many polar and charged residues are functionally active. Thus, the disordered status can be described and predicted by the amino acid types and composition. Actually, all the prevailing disorder predictors (including a family of PONDR® predictors (VLXT 40, 43, VL3 24, 44, 45, VSL2 41, 46), NORSp 47, DISOPRED 23, IUPRED 48, 49, charge-hydrophathy plot 12 etc.) use amino acid composition-related quantities as input.
In integral membrane proteins, disorder is widely observed 1-5. For example, in human integral plasma membrane proteins, predicted disorder was estimated to be as high as 3-fold more frequent on the cytoplasmic surface as compared to the external surface of these proteins. Furthermore 40% of these proteins were predicted to contain long IDRs (i.e., regions of more than 30 consecutive residues predicted or shown to be disordered), whereas only 5% of E. coli membrane proteins were predicted to have such long disordered regions 3. These levels of disorder are similar to those predicted in eukaryotic versus prokaryotic genomes, which leads to the question whether the disorder frequency for integral membrane proteins is the same as that for proteins in general from the same organism.
With regard to function, the C-terminus of the voltage-activated potassium channel was indicated to be highly disordered and to act as a fishing-rod for the binding to scaffold proteins 1. A prediction study on single-pass type I transmembrane (TM) proteins indicated that the disordered regions, in agreement with the more general study cited above 3, are much more abundant in the cytoplasmic side; for the cytoplasmic domains of these single pass membrane proteins, the cytoplasmic domains were highly enriched in the charged residues (R, E, K), which could help to account for the disorder in these regions 4.
These initial studies are providing new insights regarding on the structure and function of membrane proteins. A weakness in these studies is that the disorder predictors were developed from structured and disordered regions in water-soluble proteins. But water-soluble and integral membrane proteins exhibit significant differences in their physico-chemical properties owing to differences in their environments. Like typical water soluble proteins, the TM regions of membrane proteins have long been known to be highly structured, typically containing α-helices 50 or β-structure 51. Within the membrane bilayers, the helix and sheet structure are especially likely to occur due to the low dielectric values within the membrane interiors 52, 53. Furthermore, of the interior of TM proteins and water-soluble proteins have similar hydrophobic polarities, whereas the exterior regions of TM proteins are much more apolar than the exteriors of water-soluble proteins 54-56. Thus, the low dielectric constant of the environment, whether from lipid or from protein interiors, would be especially unfavorable to the formation of intrinsic disorder within the membrane environment. Thus, possibly with extremely rare exceptions, disordered segments residing in integral membrane proteins would be expected to be generally localized within the regions external to the membrane bilayer. Thus, use of disorder prediction is likely to be useful only in the parts of membrane proteins that are exterior to the membrane bilayer.
Current disorder predictors rely to a considerable degree on difference in amino acid composition between the structured and disordered regions. The distinctive environment of the membrane bilayer imposes constraints on the amino acid composition of integral membrane proteins, even on the regions external to the membrane bilayer 57, 58. Because current disorder predictors use amino acid compositions and attributes calculated from water-soluble proteins, it is uncertain whether the current disorder predictors give reliable estimateswhen applied to membrane proteins. This uncertainty undermines the validity of the previous disorder prediction studies on membrane proteins.
Objective in this study is to characterize disorder in membrane proteins and compare it to that in soluble proteins. We also seek to compare the amino acid compositions of the ordered and disordered regions of membrane proteins with those of the corresponding sets obtained from water-soluble proteins for the purpose of assessing the accuracy of current disorder predictors. The data from this work provide a framework to guide future studies of disorder in membrane proteins. Such information would also be important for validating experiments that have already used disorder prediction to study membrane proteins.
Results
Structure and disorder in membrane proteins
Five datasets and eight subsets were analyzed: datasets of helical TM proteins (TM-alpha) and beta TM proteins (TM-beta) and their TMM-alpha and TMM-beta subsets, where the second M is used as indication these subsets contain the sequences corresponding to the missing regions of electron density; partially disordered dataset (PDD) and its PDDM subset; fully ordered dataset (FOD); and fully disordered dataset (FDD). Each of the TM-alpha, TMM-alpha, TM-beta, TMM-beta, PDD and PDDM datasets were further split into two subsets each according to the length of disordered regions, those with sequence length ≥ 30 residues constituted datasets of long IDRs, whereas IDR < 30 residues were assembled into a dataset of short IDRs.
Helical bundles and beta barrels (Figure 1) are the two main types of TM proteins. Helical bundles are found in various types of membranes, especially plasma membranes, whereas beta barrels are found only in the outer membranes of gram-negative bacteria and mitochondria. Helical bundle TM proteins are estimated to represent about 20∼25% of the open reading frames (ORFs) in most fully sequenced genomes, while beta barrel TM proteins account only for a few percent of all ORFs 59, 60. As discussed above, the membrane-crossing segments are rich in hydrophobic residues, especially aliphatic side chains that can interact with the hydrophobic environment within the interior of lipid bilayer, while aromatic residues, Tyr and Trp, are highly abundant at the lipid-water interface 61.
Figure 1.
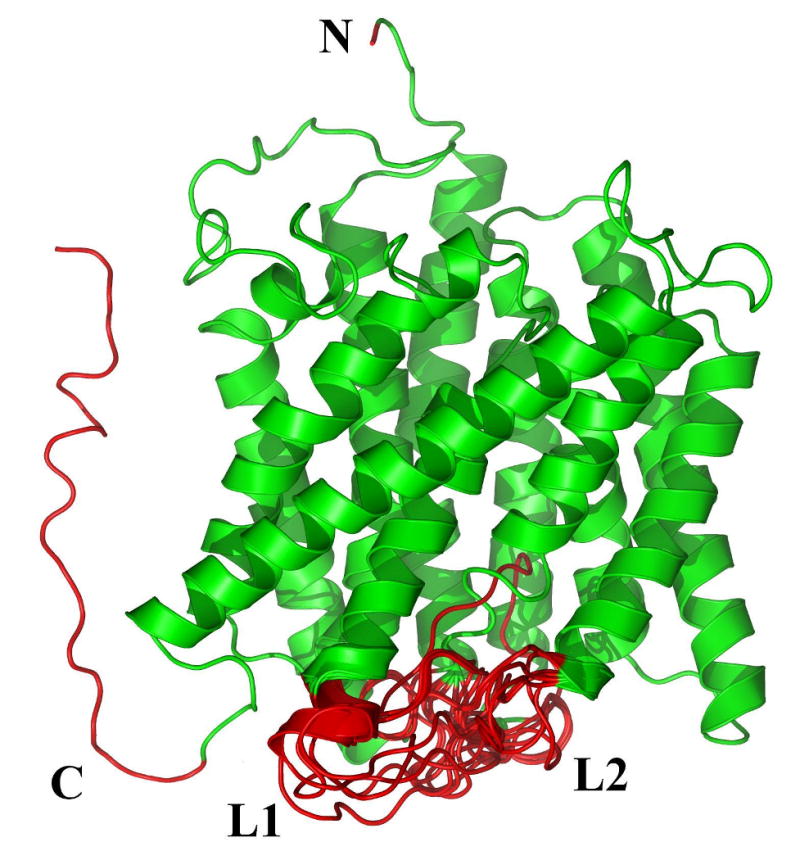
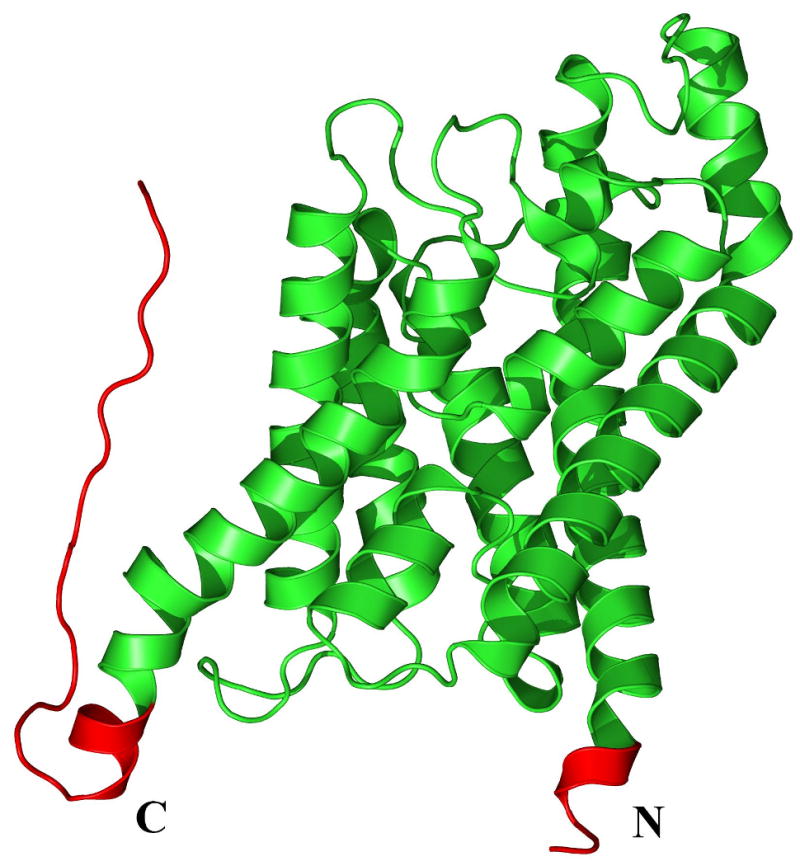
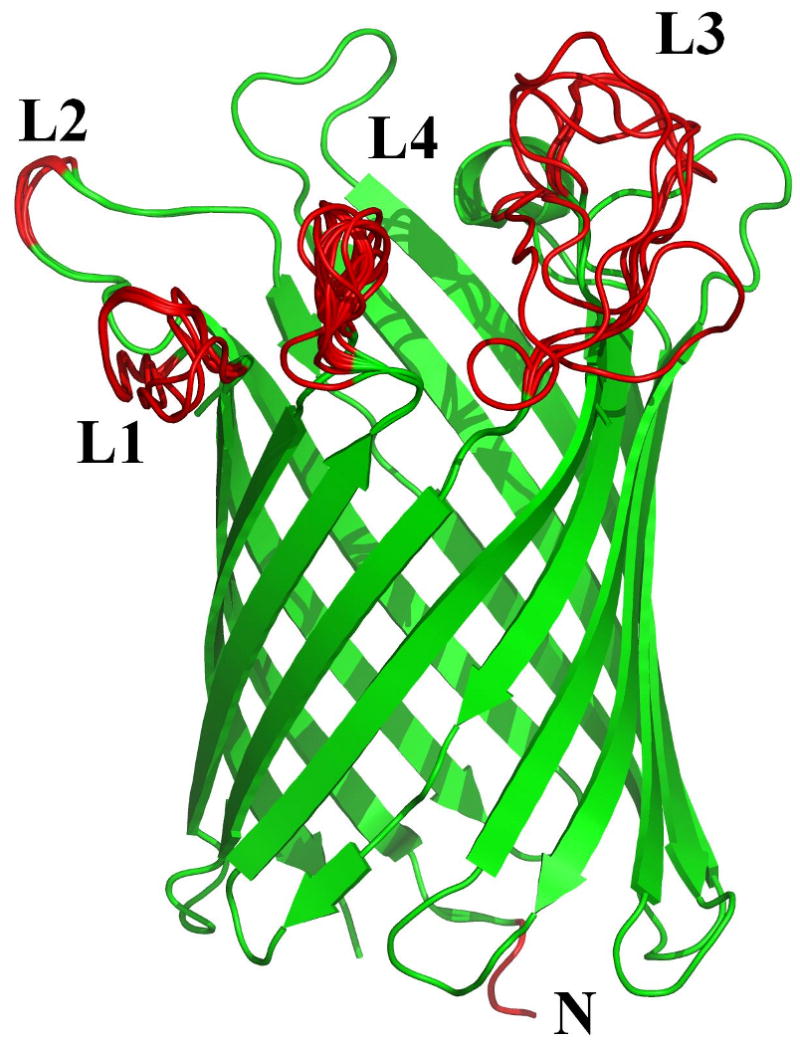
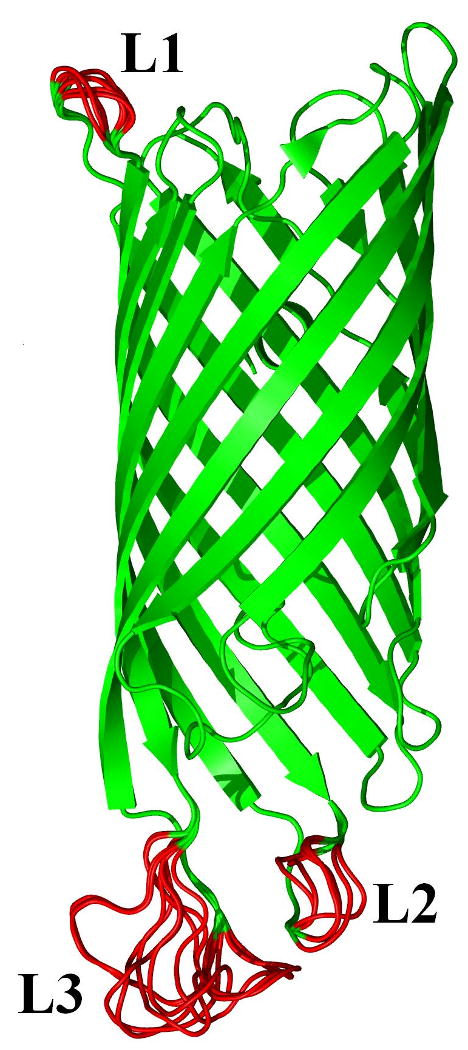
Example 3D structures of membrane proteins containing disordered regions: Shown are examples of two helical (A) and (B), and two beta (C) and (D) TM proteins. The helical proteins are: A. The ammonia channel (PDBID: 2NMR); and B. Glycerol uptake facilitator protein (PDBID: 1FX8). The beta proteins are: C. Monomeric porin OMPG (PDBID: 2F1C); and D. E. coli ESPP autotransporter (PDBID: 2QOM). The upper parts of (A) and (B) correspond to the extracellular segments. The TM orientations of the porin (C) and ESPP autotransporter (D) are unknown. The disordered regions are shown as red segments and numbered in order from the amino to the carboxy terminus. In ammonia channel (A), the disordered regions are as follows: N-terminal (Ala1), L1 (Ile182 – Lys194), L2 (Lys302 – Asp310), and C-terminal (Glu387 – Ala406). In glycerol uptake facilitator protein (B), the disordered regions are: N-terminal (Met1 – Ser5) and C-terminal (Pro260 – Leu281) fragments. In the porin (C), the disordered regions are as follows: N-terminal (Glu1 – Arg3), L1 (Glu20 – Asp27), L2 (Ala59 – Gly60), L3 (Trp220 – His231) and L4 (His261 – Ser266). In ESPP autotransporter (D), the following segments are disordered: L1 (Asp1074 – Gly1075), L2 (Thr1135 – Ala1137), and L3 (Ala1184 – His1191).
To illustrate the type of disorder that is observed in membrane proteins, we selected a representative set of two helical bundles and two beta barrels as shown in Figure 1. Each structure reveals several disordered regions indicated by bold red loops or red segments. In the helical bundles of the ammonia channel (PDBID: 2NMR) and the glycerol uptake facilitator protein (PDBID: 1FX8) (Figures 1A and 1B), a total of five such regions are observed. In the case of the ammonia channel (Figure 1A) two disordered region are found at the N- and C-termini, while glycerol uptake facilitator protein has disordered termini and one disordered loop. In the beta barrel proteins, monomeric porin OMPG (PDBID: 2F1C) and E. coli ESPP autotransporter (PDBID: 2QOM), shown in Figures 1C and 1D, a total of 7 disordered regions are found. For monomeric porin OMPG, one of these regions is located at the N-terminus, while the rest are loops that are exposed to the intra- or extracellular environment. In the case of ESPP autotransporter, all disordered regions are loops located at the both sides of the proteins.
These disordered regions are likely to be highly flexible and dynamic with each disordered region sampling many conformations over time. Therefore, each indicated structure should be considered as a snapshot of a conformational ensemble. This is illustrated by the lack of convergence during the structure prediction of the loop regions as shown by several overlapped configurations for loops in Figure 1. It is important to remember that all the red segments in Figure 1 are models of disordered regions. They represent ensembles of model structures constructed by Sybyl. There is no data to support or reject the predicted extensions of the helical ends in Figures 1A and B. As modeling was made in the absence of membrane, the orientation of C-terminal disordered fragments of the ammonia channel and the glycerol uptake facilitator protein (Figure 1A and 1B) are rather artificial and do not take into account the presence of membrane. Therefore, these models do not imply that the mentioned C-terminal segments are crossing the membrane. It is likely not a fortuitous event that the disordered regions of both types of TM proteins studied so far are located at one or both termini and in the linker regions that are outside the region of the membrane bilayer. Evolutionary pressure could favor the observed disordered regions, as they can accommodate the diffusion or transport of a set of ligands, while blocking those ligands that are not of benefit for the organism's survival.
Composition Profiling
The primary characteristics (sequence length, length of IDRs, and overall disorder content) of the three datasets (partially disordered dataset (PDD), helical TM dataset (TM-alpha), and beta TM dataset (TM-beta)) are compared in Figure 2. The length distributions of all the sequences in three datasets are compared in Figure 2(a). Partially disordered proteins have a unimodal distribution with the mean value near 400 residues. Helical TM proteins have a bimodal distribution the peaks at about 100 and 400 residues, respectively. The first peak at 100 is almost three-fold higher than the second peak at 400. This likely indicates a sampling bias for the shorter membrane proteins. The beta TM proteins also possess a bimodal distribution but with the peaks shifted to about 400 and 800 residues, respectively, although the height of second peak at ∼800 is rather low. As TM-beta dataset has only 37 proteins, the observed bimodal distribution is not statistically significant. All the three datasets show long tails in their length distributions, with TM-alpha having the most prominent one. Figure 2(b) compares the length distributions of disordered regions in these three datasets. The distributions of disordered fragments in these three datasets all follow a power-law. In TM-alpha, 90% of disordered segments have disordered regions less than 30 residues, whereas in TM-beta, the value is close to 94%, but for partially disordered proteins, it is only 68%. Figure 2(c) represents the overall abundance of disordered residues in three datasets. PDD still shows a unimodal distribution, but both TM-alpha and TM-beta show power-law distributions. In the TM-alpha and TM-beta proteins, about 63% and 60% of the proteins have less than 10% of their residues in disordered regions, respectively.
Figure 2.
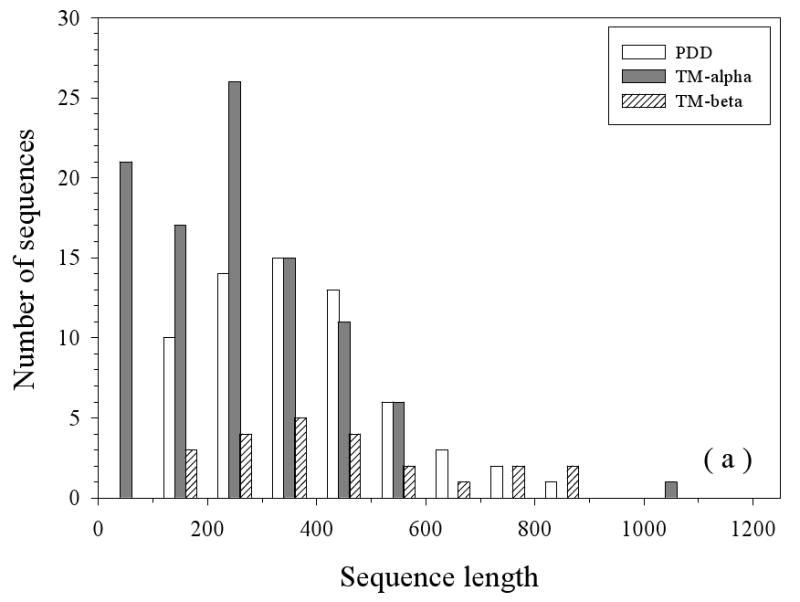
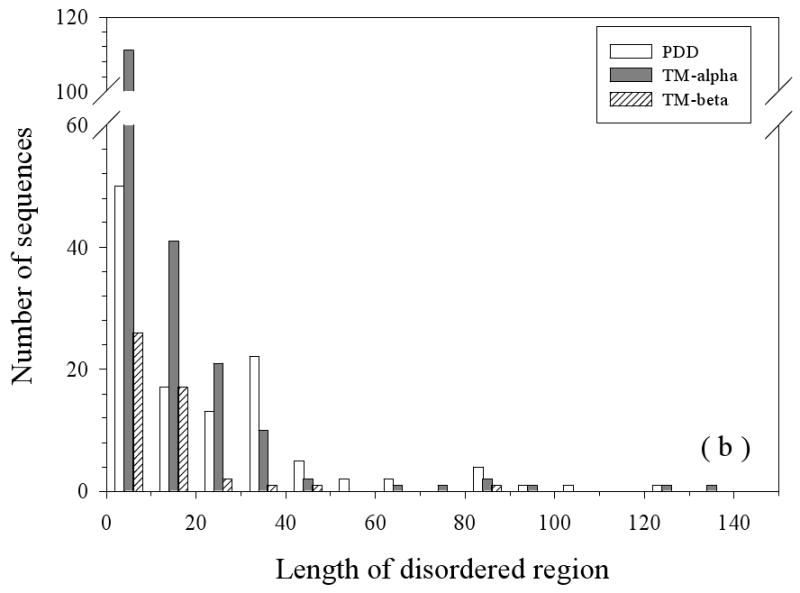
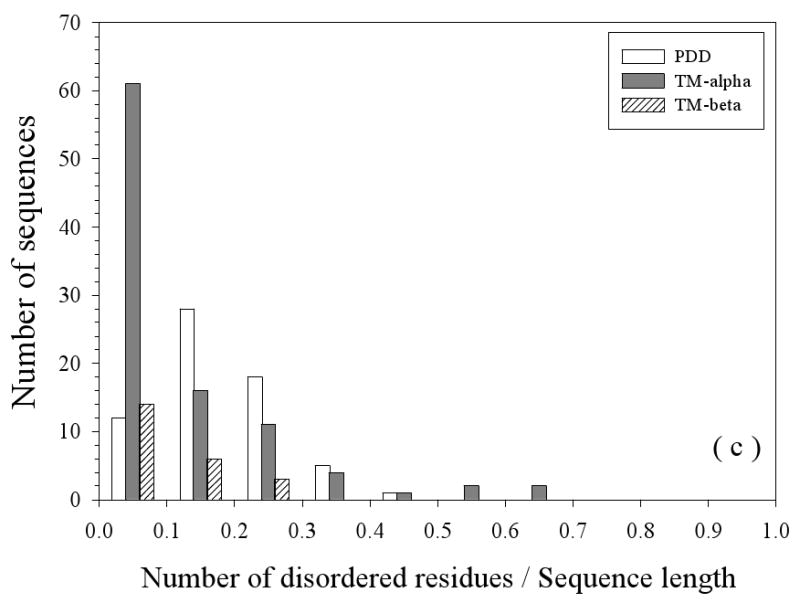
Sequence Length Distributions: The lengths of the entire protein sequences (a) and the disordered regions (b) are given. Finally, the percentage of disordered residues (c) is given for three datasets: PDD (partially disordered dataset), TM-alpha (helical TM proteins), and TM-beta (beta TM proteins).
Due to the high divergence of length distribution and disorder content, the underlying mechanisms of the formation of disordered state might be different, which could lead to a variance of the amino acid composition of these datasets. Furthermore, because helical and beta TM proteins have different locations and perform different functions, these could also lead to compositional differences. Thus, the first step is to compare the amino acid compositions of the disordered regions from the helical bundles with those from the beta barrels.
To carry out such comparisons, we have found it helpful to calculate the fractional difference in composition between a given set of proteins and a set of reference proteins for each amino acid type, and then to arrange the amino acids from the most order-promoting to the most disorder-promoting 11, 42 In this analysis, positive values correspond to amino acids that are enriched in a given dataset compared to the reference dataset, and negative values correspond to the residues that are depleted compared to the reference set.
Using the method described above, Figure 3(a) compares the amino acid compositions between disordered regions of helical and beta TM proteins. The disordered regions of beta TM proteins have much less of C, F, I, Y, L, M, and R (< ∼-40%), slightly less of W, V, A, and K (< -10%), similar compositions of H, S, and P, much more of T, G, Q, N, D, E, and P (>∼40%). (Here and in subsequent paragraphs, the amino acid residues that are depleted in a given dataset in comparison with the reference datasets will be marked in italic font, whereas those that are more abundant in an analyzed dataset in comparison with that of the control datasets will be indicated in bold font.) In brief, the disordered regions of beta TM proteins have fewer order-promoting and positively charged residues, but have more disorder-promoting and negatively charged residues compared to disordered regions of helical TM proteins. These results suggest that the overall disorder tendency of TMM-alpha protein regions may be much less than that of TMM-beta protein regions.
Figure 3.
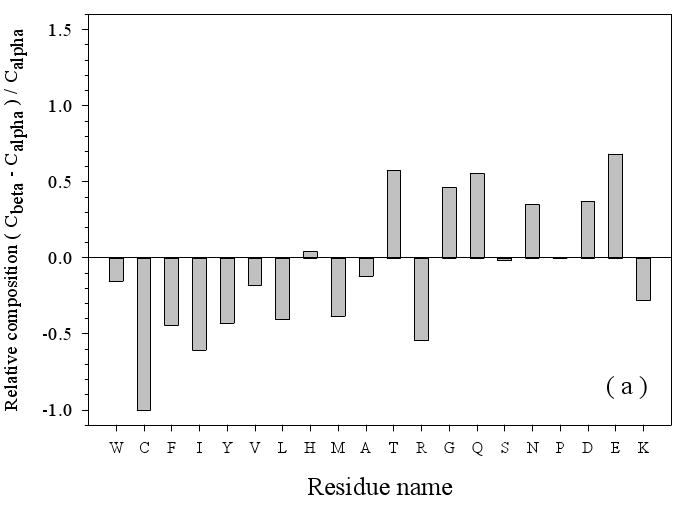
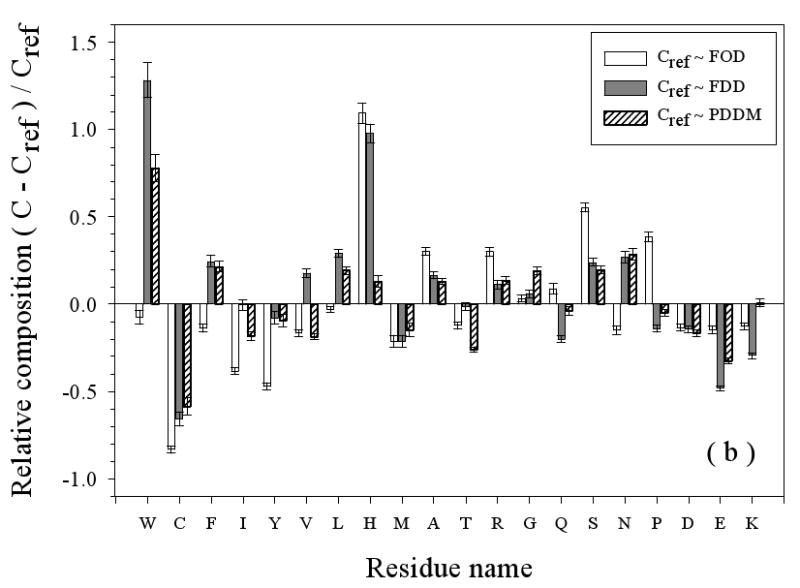
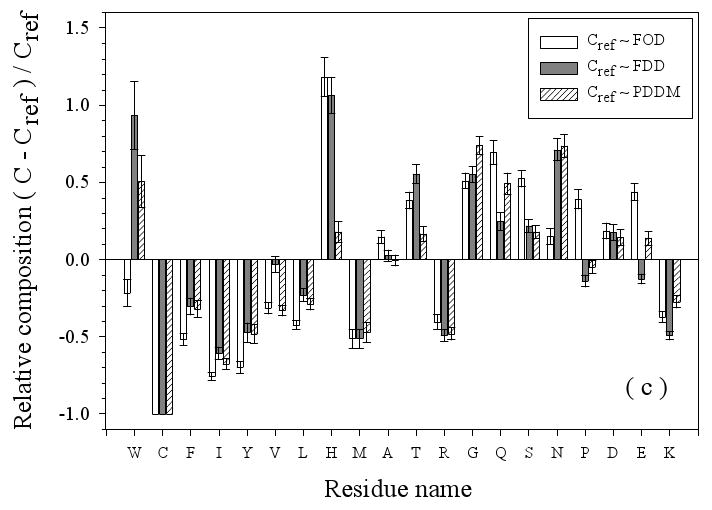
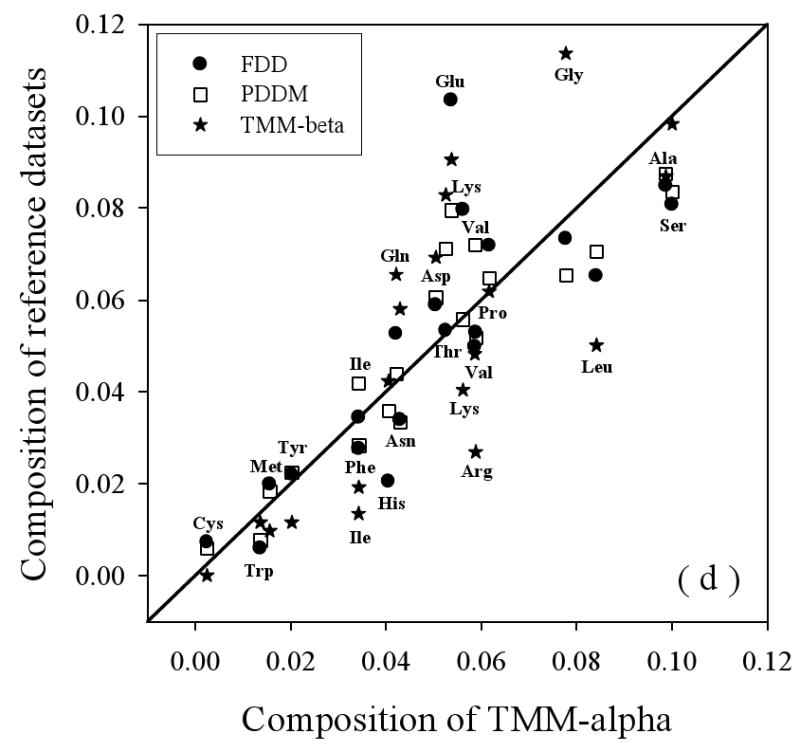
Amino Acid Composition Profiles: Profiles are calculated as (CX-Cref)/Cref where, CX is the composition ratio of a given type of amino acid in one data set, and Cref is the composition of the same amino acid in the dataset being compared, thus giving the fractional difference for each amino acid for the datasets being compared. The arrangement of the amino acids is from the most structure-promoting on the left to the most disorder-promoting on the right. The profile comparisons were carried out for five datasets, which are the following: 1. the missing regions of helical TM proteins (TMM-alpha): 2. the missing regions of beta TM proteins (TMM-beta); 3. the fully ordered dataset(FOD); 4. the fully disordered dataset(FDD); and 5. the missing regions of the partially disordered dataset(PDDM). These pairwise comparisons are as follows: TMM-alpha = CX versus TMM-beta = Cref (a); TMM-alpha = CX versus (from left to right) FOD (white bars), FDD (black bars), or PDDM (cross-hatched bars) = Cref (b); and TMM-beta = CX versus (from left to right) FOD (white bars), FDD (black bars), or PDDM (crosshatched bars) = Cref (c). Pairwise comparisons of the datasets are given by the alternative method of plotting one set of compositions versus the other set of compositions (d), indicated by the following symbols: FDD versus TMM-alpha (black circles); PDDM versus TMM-alpha (white squares); TMM-beta versus TMM-alpha (black stars). The bold line is the diagonal indicating equal compositions in a given pair of datasets.
To further study the compositional biases, the amino acid compositions of proteins in TM-alpha and TM-beta were compared with those of FOD (fully ordered dataset), FDD (fully disordered dataset), and PDDM (missing regions of the partially disordered dataset). Results of this analysis for relative amino acid compositions of disordered regions of TM-alpha and TM-beta proteins are shown in Figures 3(b) and (c), respectively.
Compared to structured proteins (FOD), the disordered regions of helical TM proteins have less W, C, F, I, Y, V, L, M, T, D, and E and more H, A, R, G, S, and P (Figure 3(b)). The depletion of the order-promoting hydrophobic and aromatic residues, and the enrichment in some (but not all) of the disorder-promoting residues is the probable source of the formation of disorder in TMM-alpha dataset
Consistent with the results of Figure 3(a), the disordered regions in beta TM proteins show larger differences than the disordered regions of helical TM proteins when compared to the data from fully structured, FOD, proteins (Figure 3(b)). Specifically, compared to the disordered regions from helical TM proteins, these disordered regions display more extreme reductions in W, C, F, I, Y, V, L, and M, which are structure promoting, and more extreme enrichments in G, Q, S, P, and E, which are disorder promoting. Again, the lack of structure in these regions of beta TM proteins is supported by their amino acid compositions.
Figure 3(b) and 3(c) also compare the amino acid compositions of the disordered regions from helical and beta TM proteins with two previously studied disordered sets, namely from fully disordered proteins (FDD) and from segments of disorder that are connected to structured domains (PDDM). If the various disorder types were the same, the various comparisons would have values near zero. On the other hand, nonzero values for the comparisons indicate differences in the amino acid compositions of the two disorder types being compared. When a comparison with structured proteins and with a disorder type gives a similar value, then the structured and disorder datasets have a similar content of that particular amino acid.
Disorder from helical TM proteins as compared to that from FDD and PDDM is significantly depleted in C and E, with the first being structure-promoting and the latter being disorder promoting. On the other hand, disorder from helical TM proteins is obviously enriched in W, S, and N. In some cases, the two prior disordered sets, FDD and PDDM, show significant differences from each other. Thus, the disordered regions from helical TM proteins are significantly enriched in H as compared to both structured protein, FOD, and compared to fully disordered proteins, FDD, but with similar amounts of H compared to disordered segments, PDDM. As for K, disorder from helical TM segments is more depleted compared to fully disordered proteins, FDD, but quite similar to disordered regions, PDDM. Finally, the amount of V is between the values for the two data sets, so a positive peak is observed when compared to FDD and a negative peak when compared to PDDM.
Disorder from beta TM proteins as compared to that from FDD and PDDM is significantly depleted in C, F, I, Y, L, M, R, and K but is enriched in W, G, and N. The complete absence of C from the beta TM protein disordered regions leads to values of 1 for all three comparisons with the other datasets. As for E, the disorder from beta TM proteins is slightly depleted compared to FDD, but slightly enriched compared to PDDM.
A deficiency in the above analyses is that, if a given amino acid is rare, then a small change in amount leads to a large fractional change and a large peak in the profile. An alternative approach for comparing the compositions is to simply plot one set of compositions versus the other: identities then fall on a diagonal line. Such a comparison plot is given in Figure 3 (d), where FDD, PDDM, and TMM-beta are compared to TMM-alpha. This plot shows that the absolute contents of C, W, M, Y, P, and A do not deviate too much from the diagonal line, indicating that these residues are fairly stable across the four datasets. Of these residues, C remains close to diagonal line in Fig 3(d), but shows large relative changes in Fig 3(a), (b), and (c) due to its small total value. Indeed, C, W, and Y are among the most strongly order-promoting residues, and yet all have very small contents in all the datasets (less than 4%). Also, proline, which strongly inhibits structure formation, remains stable across these four disordered sets (and P is substantially enriched when its composition in these disordered protein datasets is compared to its composition in structured protein regions). On the other hand, several amino acids show large deviations from the diagonal, indicating significant changes in the different datasets. For example, consider the following: 1. compared to FDD, TMM-alpha has more of H, L, A, and S, and less of E, K, V, and Q; 2. compared to PDDM, TMM-alpha has more of L and S, and less of E, V, and T; and 3. compared to TMM-beta, TMM-alpha has more of I, F, R, K, and L, and less of G, E, T, D, N, and Q. Finally note that G and S are over-presented in both TMM-alpha and TMM-beta. G and S are only mildly disorder-promoting in the scale developed by comparing structure and disorder from water-soluble proteins, but perhaps these residues are more important for disorder in membrane proteins.
Comparison of Dataset Similarities
The compositional profiles presented above indicate differences between any given pair of datasets, but fail to provide a quantitative measure of the overall similarity of said pair. Euclidean distances calculated between amino acid composition vectors on a 20-dimensional space have been used to distinguish α–helical proteins from β–sheet proteins 62. Hence, the Euclidean distance can be used to compare two different datasets. As an alternative, we previously employed a different measure 63, the Kullback-Leibler (KL) divergence 64, to describe the similarity between two different protein datasets. One problem with the KL divergence is that it is not symmetrical; if the distributions are reversed in the defining equation, a different value for the divergence results. The summed Kullback-Leibler divergence was developed to correct this problem 65. To choose among these three measures, we compared them with each other (Figure 4). As the difference between two datasets becomes larger, the Euclidean distance gives a smaller estimate for the difference as compared to both types of KL divergence, so this suggests that either KL divergence would give a better comparative measure than the Euclidian distance. The KL divergence and the summed KL divergence do not deviate very much from a straight line, so both appear similar to each other. However, between these two, the summed KL divergence has the advantage of being symmetrical and so seems to be the better choice. Thus, from these data, the summed KL divergence was chosen to estimate the similarities among different datasets.
Figure 4.
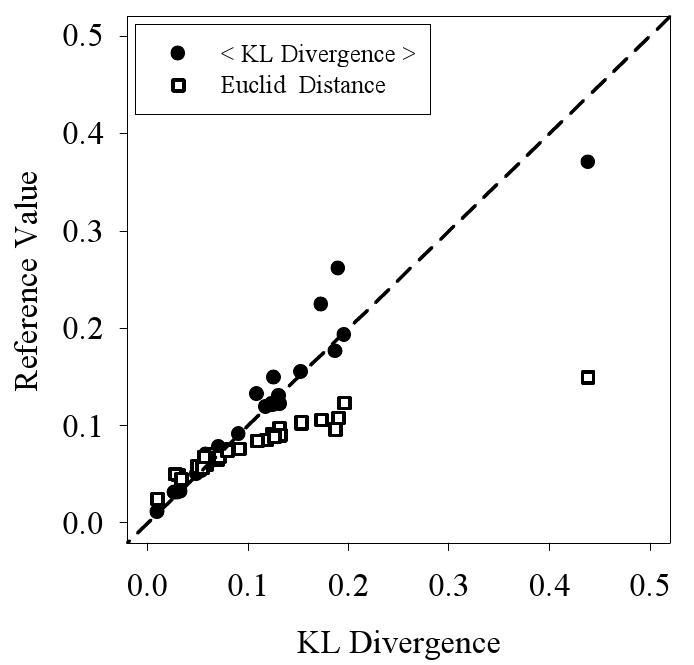
Comparison of Dataset Similarity Measures: Three measures are used to compare the similarities between pairs of datasets, with values for one comparison method (Kullbeck Leibler divergence) given on the X-axis and with the values for the other two methods given on the Y-axis. The resulting comparions are Kullbeck-Leibler divergence versus summed Kullback-Leibler divergence (black circles), and Kullbeck-Liebler divergence versus Euclidean Distance (white squares).
The various datasets are compared by means of the summed KL divergence in Table 1. TM-alpha, which is highly structured, is similar to both FOD and PDD with the averaged KL divergence at around 0.06. Likewise, TM-beta has an averaged KL divergence of 0.07 with FOD and 0.08 with PDD. Despite differences arising from the membrane environment, both TM-alpha and TM-beta are quite similar to structured proteins, FOD and PDD, and much less similar to the disordered datasets, FDD and PDDM. In contrast, the similarity between TM-alpha and TM-beta is much less. Their measure is 0.12 which is two times larger than the measure with the other ordered datasets. These comparisons indicate that, despite small differences associated with being located in membrane environments, the structured regions of membrane proteins have quite similar amino acid compositions compared to the sets of water soluble structured proteins.
Table 1.
Pairwise Kullbeck-Leibler Divergence Values
| TM-alpha | TM-beta | FOD | PDD | TMM-alpha | TMM_beta | FDD | PDDM | |
|---|---|---|---|---|---|---|---|---|
| TM-alpha | 0 | 0.121 | 0.063 | 0.059 | 0.122 | 0.379 | 0.193 | 0.130 |
| TM-beta | 0 | 0.070 | 0.078 | 0.091 | 0.176 | 0.155 | 0.119 | |
| FOD | 0 | 0.011 | 0.073 | 0.261 | 0.075 | 0.053 | ||
| PDD | 0 | 0.050 | 0.224 | 0.061 | 0.032 | |||
| TMM-alpha | 0 | 0.122 | 0.064 | 0.031 | ||||
| TMM-beta | 0 | 0.149 | 0.132 | |||||
| FDD | 0 | 0.031 | ||||||
| PDDM | 0 |
The summed Kullback-Leibler divergence between each pair of datasets. TM-alpha – helical trans-membrane dataset membrane; TM-beta – beta trans-membrane dataset; FOD – fully ordered dataset; PDD – partially disordered dataset; TMM-alpha – disordered regions of helical trans-membrane dataset; TMM-beta – disordered regions of beta trans-proteins. FDD – fully disordered dataset; PDDM – disordered regions of partially disordered dataset.
Despite the differences indicated in the comparisons of individual residue compositions given above in Figure 3, the disordered subsets of TM-alpha, namely TMM-alpha, has fairly good overall similarity to the various other disordered datasets. The summed KL divergence is 0.06 and 0.03 with FDD and PDDM, respectively. On the other hand, the divergence of TMM-beta with any other dataset is always larger than 0.12. Thus, the disordered regions from beta barrels, that is the TMM-beta dataset, have the most distinctive overall amino acid composition.
Disorder prediction
As discussed above, several researchers are beginning to apply disorder prediction to membrane proteins 1-5. However, given the distinction in the amino acid compositions of structure and disorder in water soluble proteins as compared to membrane proteins as shown above, and given that current disorder predictors were trained on structured and disordered regions from water-soluble proteins, the applicability of these predictors to membrane proteins is uncertain. To study the efficacy of disorder prediction on membrane proteins, we chose three of our disorder predictors, namely PONDR® VL3, PONDR® VLXT, and PONDR® VSL2. These three were selected for this study because, when applied to disordered regions from water-soluble proteins, they give somewhat different results; thus we can test, not just the accuracies of these predictors, but also whether the previously observed distinctions carry over to disordered regions from membrane proteins.
We applied a balanced bootstrapping technique to construct ROC curves for all the three datasets: TM-alpha, TM-beta, and PDD, using the three different disorder predictors (Figure 5), with the results from VL3 in 5(a), from VLXT in 5(b), and VSL2 in 5(c). Overall, the helical TM proteins show better discrimination between structure and disorder by all three predictors (e.g. the TM-alpha curves tend to be higher), while the beta TM proteins and water-soluble proteins show less discrimination between structure and disorder, with a tendency for better performance on water soluble proteins at lower threshold values but with a better performance for beta-TM proteins at higher threshold values.
Figure 5.
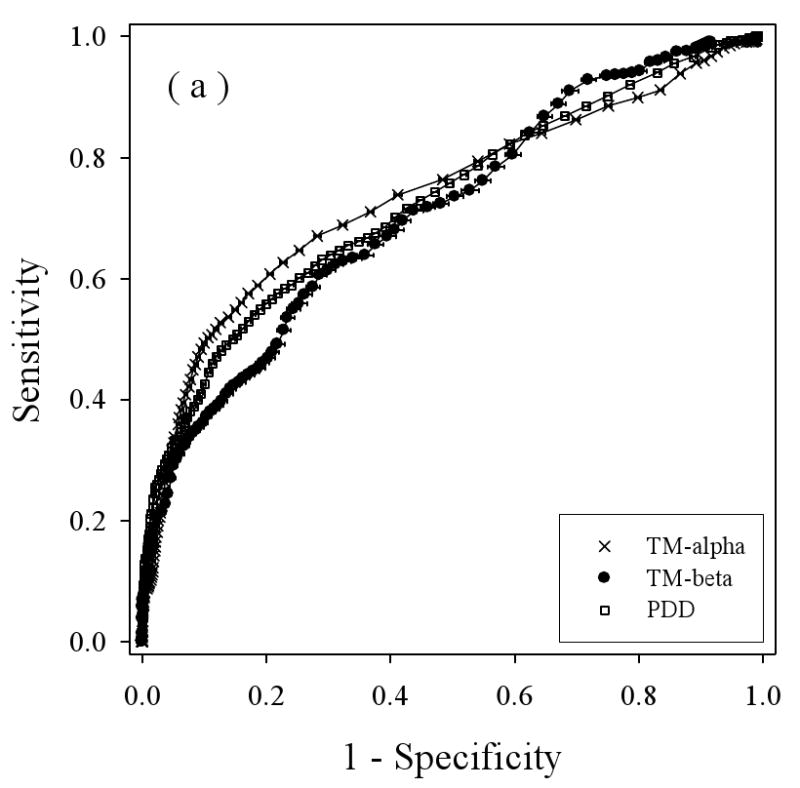
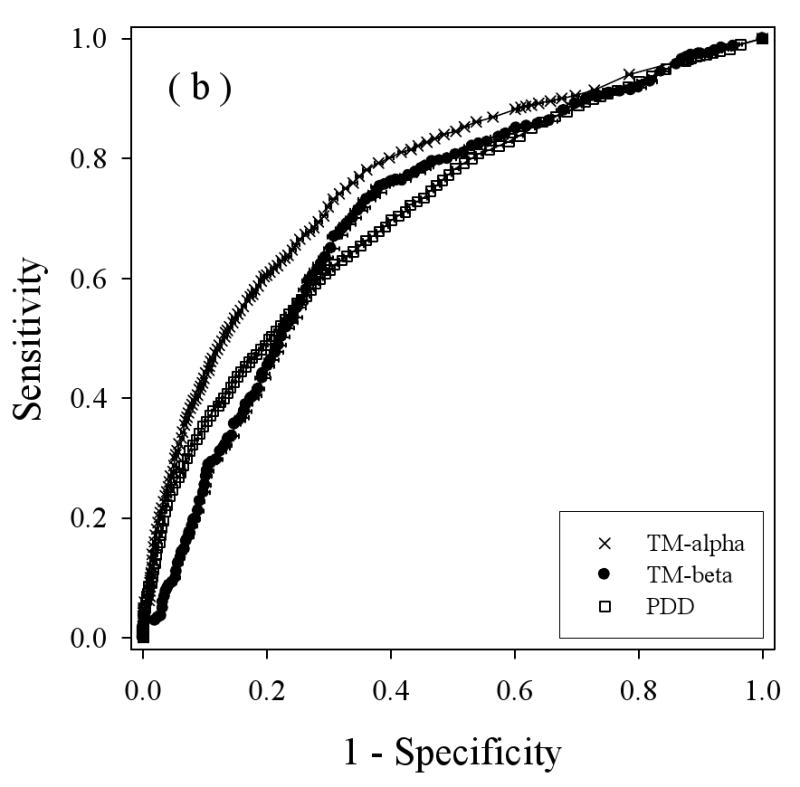
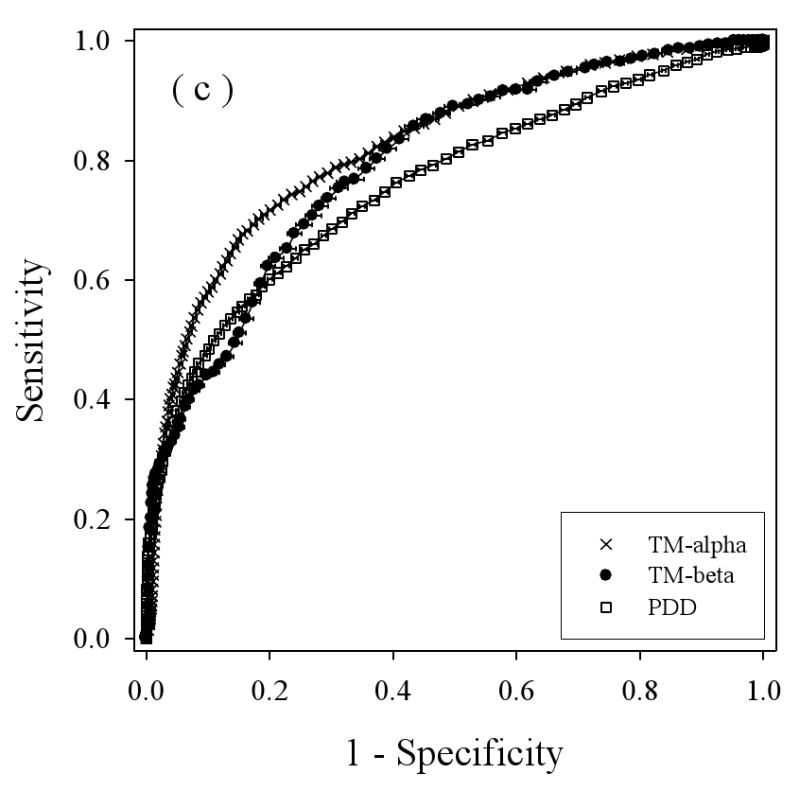
Balanced receiver operating characteristic (ROC) curves: Disorder predictions for three predictors on three datasets are compared by determining the Sensitivity (true positive rate) and 1 – Specificity (false positive rate) for each predictor as the threshold is changed. The three disorder predictors are VL3 (a), VLXT (b), and VSL2 (c). The three datasets are PDD (white squares), TM-beta (black circles), and TM-alpha (crosses). The horizontal bar on each symbol indicate the statistical error of specificity for that point determined by bootstrapping using 1000 iterations, and the symbol itself marks the bootstrapping average.
To estimate the overall results for the various ROC curves the following values were calculated: the areas under the curves, the threshold values at the breakeven points, and the prediction accuracies determined from the breakeven threshold values (Table 2). Of the three prediction algorithms, VSL2 (Figure 5(c)), gave the best results for all three datasets. Thus, the higher accuracy of VSL2 determined for water-soluble proteins carries over to predictions on disordered regions in membrane proteins. Interestingly, for two of the predictors, VLXT and VSL2, the prediction accuracies were ranked the following order: TM-alpha > TM-beta > water-soluble protein (PDD). For VL3, the last two are reversed. Overall, the prediction of disorder in helical TM proteins was found to be more accurate than the prediction of disorder in water-soluble proteins and the prediction of disorder in beta TM proteins is similar in accuracy to the prediction of disorder in water-soluble proteins.
Table 2.
Summary of ROC Curve Results
| Area | Threshold value | Accuracy | |||||||
|---|---|---|---|---|---|---|---|---|---|
| VL3 | VLXT | VSL2 | VL3 | VLXT | VSL2 | VL3 | VLXT | VSL2 | |
| TM-alpha | 0.740 ± 0.002 | 0.768 ± 0.004 | 0.826 ± 0.003 | 0.18 ± 0 | 0.16 ± 0 | 0.31 ± 0 | 67.7% ± 0.5% | 70.8% ± 0.5% | 75.1% ± 0.5% |
| TM-beta | 0.713 ± 0.009 | 0.705 ± 0.010 | 0.796 ± 0.009 | 0.24 ± 0 | 0.38 ± 0.01 | 0.49 ± 0.01 | 64.1% ± 1.3% | 67.7% ± 0.6% | 72.5% ± 0.8% |
| PDD | 0.729 ± 0.003 | 0.712 ± 0.004 | 0.762 ± 0.003 | 0.28 ± 0.01 | 0.33 ± 0 | 0.43 ± 0.01 | 66.0% ± 0.4% | 64.9% ± 0.5% | 69.1% ± 0.3% |
The areas under the ROC curves (Area), the threshold values determined from the breakeven points specified as values on the X-axis (Threshold Values) and accuracies calculated using the indicated threshold values (Accuracy) for data obtained using the VL3, VLXT, and VSL2 predictors as applied to sequences from the TM-alpha, TM-beta and PDD datasets.
To study the prediction behavior in more detail, the sensitivity (true positives) for the various disordered datasets were determined as the thresholds were varied for the three predictors (Figure 6), with the results for PONDR® VSL2 in 6(a), for PONDR® VLXT in 6(b), and PONDR® VSL2 in 6(c). The general trend here is that the true positive fraction for the fully disordered dataset (FDD) gives generally the highest curve for all three predictors and the disorder from the helical membrane proteins (TMM-alpha) gives generally the lowest curve for all three predictors, with some deviations from these trends at high or low threshold values. The disorder from beta TM proteins gives higher curves at lower threshold values compared to the disordered proteins from water-soluble proteins for the VLXT and VSL2 predictors, but the disorder from beta TM proteins gives a lower curve throughout for the VL3 predictor.
Figure 6.
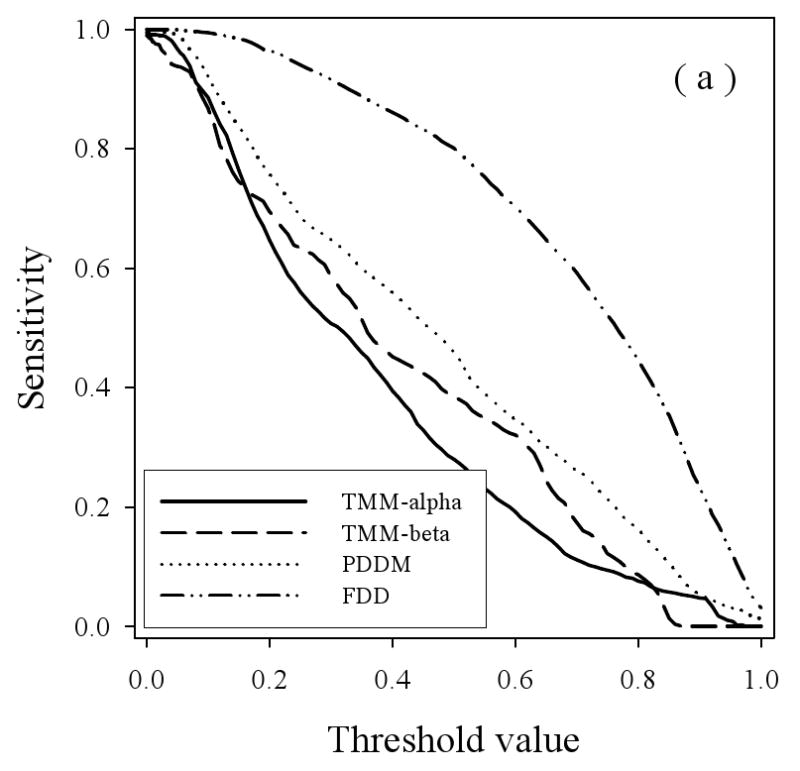
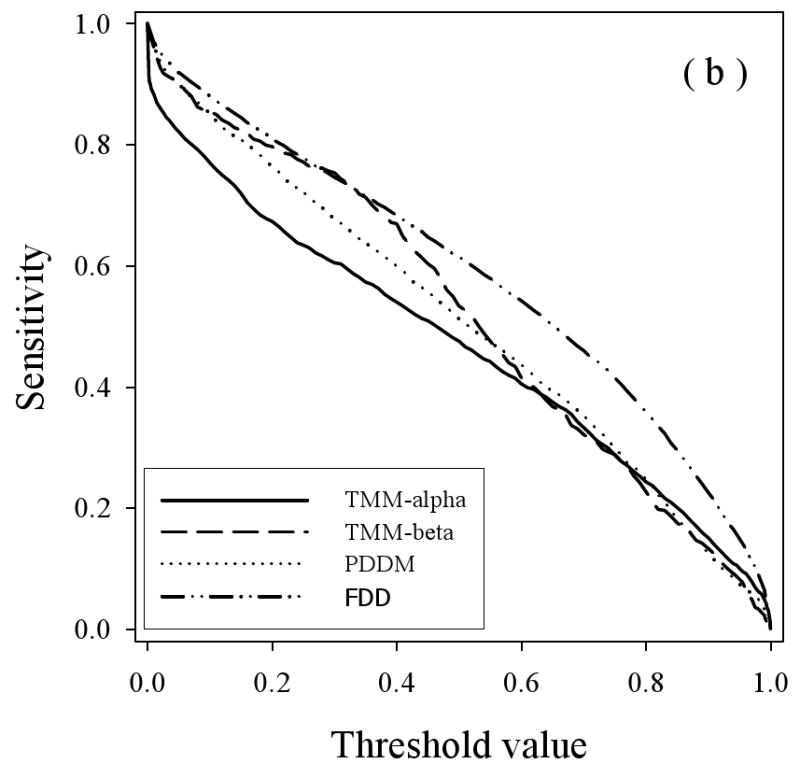
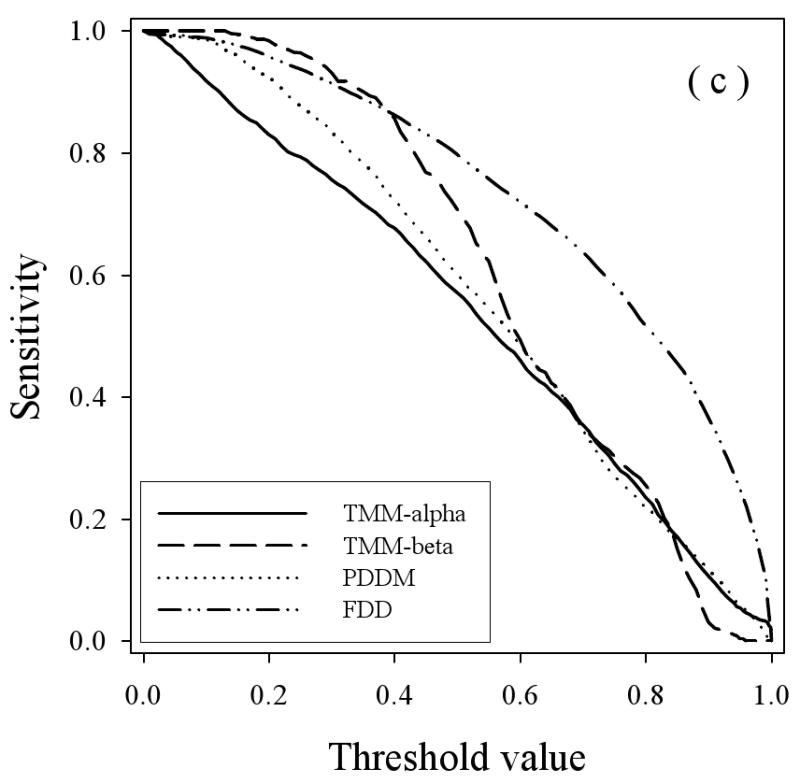
Specificity versus Threshold: The specificity (false positive) values are plotted versus the threshold values using the three predictors VL3 (a), VLXT (b), and VSL2 (c) where the calculations were carried out for the four datasets: TMM-alpha (solid lines), TMM-beta (dashed lines), PDDM (dotted lines), and FDD (dash-dot-dotted lines).
Another important test is to determine whether prediction accuracy depends on the length of the disordered regions. With respect to disordered regions for water-soluble proteins, we noticed that the amino acid compositions of short regions of disorder (< 30 residues) differed significantly from the compositions of long regions of disorder (≥ 30 residues) 63. Because of these differences, we constructed a predictor, VSL2, to take into account this length-dependent difference in compositions. The VSL2 contains two predictors, one for trained on short segments and one trained on long segments, and this predictor also contains a meta-predictor that merges the outputs from the two predictors in an appropriate manner 41. Since VL3 and VLXT were trained on long regions of disorder only, VSL2 gives much more accurate results for predictions on short regions of disorder.
To test whether disordered regions of membrane proteins also show length-dependent prediction accuracies, we divided the disordered regions into short (< 30 residues) and long (≥ 30 residues) subgroups, and calculated their ROC curves (see supplemental material). From these data we repeated the subsequent analyses given above and thereby determined the areas under the curves, the breakeven threshold values, and the prediction accuracies estimated from the breakeven threshold values (Table 3). Generally, the prediction accuracies on long regions of disorder were better than the accuracies on short regions of disorder across all three datasets and for all three predictors. Also, the VSL2 predictor outperformed the other predictors for both short and long regions of disorder. Thus, while some of the finer details show some complexity, overall it appears as if the length-dependent trends observed for disorder prediction on TM proteins follows trends observed previously for disorder prediction on water-soluble proteins.
Table 3.
Summary of ROC Curve Results Using Short and Long Regions of Disorder
| Area | Threshold value | Accuracy | |||||||
|---|---|---|---|---|---|---|---|---|---|
| VL3 | VLXT | VSL2 | VL3 | VLXT | VSL2 | VL3 | VLXT | VSL2 | |
| TM-alpha(L) | 0.827 ± 0.006 | 0.798 ± 0.005 | 0.843 ± 0.005 | 0.19 ± 0 | 0.16 ± 0.01 | 0.32 ± 0.01 | 77.4% ± 0.8% | 74.8% ± 0.5% | 78.2% ± 0.2% |
| TM-beta(L) | 0.818 ± 0.013 | 0.666 ± 0.019 | 0.822 ± 0.014 | 0.40 ± 0.01 | 0.45 ± 0.01 | 0.54 ± 0.01 | 73.6% ± 1.1% | 61.0% ± 1.8% | 73.3% ± 1.1% |
| PDD(L) | 0.735 ± 0.003 | 0.706 ± 0.004 | 0.756 ± 0.004 | 0.30 ± 0.01 | 0.35 ± 0.01 | 0.43 ± 0 | 66.5% ± 0.4% | 65.1% ± 0.1% | 69.1% ± 0.5% |
| TM-alpha(S) | 0.679 ± 0.005 | 0.742 ± 0.006 | 0.816 ± 0.005 | 0.17 ± 0 | 0.17 ± 0.01 | 0.31 ± 0.01 | 61.8% ± 0.01 | 67.8% ± 0.4% | 73.0% ± 0.2% |
| TM-beta(S) | 0.660 ± 0.013 | 0.703 ± 0.011 | 0.768 ± 0.011 | 0.22 ± 0.01 | 0.36 ± 0.01 | 0.49 ± 0.01 | 61.6% ± 0.9% | 67.6% ± 1.0% | 70.8% ± 0.7% |
| PDD(S) | 0.698 ± 0.007 | 0.724 ± 0.008 | 0.770 ± 0.007 | 0.27 ± 0.01 | 0.31 ± 0.01 | 0.42 ± 0.01 | 63.7% ± 0.3% | 65.7% ± 0.8% | 68.9% ± 0.2% |
The areas under the ROC curves (Area), the threshold values determined from the breakeven points specified as values on the X-axis (Threshold Values) and the accuracies calculated using the indicated threshold values (Accuracy) for data obtained using the VL3, VLXT, and VSL2 predictors as applied to sequences from the TM-alpha, TM-beta and PDD datasets. The disordered data were partitioned into groups containing long regions (≥ 30 residues in length, superscript (L)) or short regions (< 30 residues in length, superscript (S))
Discussion
A significant fraction of water-soluble proteins display regions of disorder. This is even true for the proteins in the Protein Data Bank (PDB), which has a very strong bias for structured proteins 66. So the first question is whether membrane proteins also display regions of disorder in their crystal structures. Of course the studies supporting disorder in membrane proteins 6-9 suggest that membrane protein structures will indeed exhibit regions of missing electron density corresponding to disordered segments.
Altogether we collected 944 membrane protein structures. Proteins with > 25% sequence identity were removed, to give 207 non-redundant membrane proteins. Of these, 120 membrane proteins exhibited regions of missing electron density, giving 58% of the membrane proteins with regions of disorder. This fraction containing disorder is lower than the 68% observed for the crystal structures of water-soluble membrane proteins 67.
Figure 1 shows representative membrane protein structures with the disordered regions explicitly illustrated as red segments and loops. The disorder in these loops is evidenced by the difficulty in reaching convergence during the computational search as no single dominant structure for the loops was identified. Visualization of the top 25 conformers for the loops that are generated by the search algorithm revealed a diverse set of conformations with large pairwise root-mean-squared deviations (RMSDs) as illustrated in Figure 1. Such a result is consistent with suggestions that the energy landscapes for IDPs exhibit multiple, shallow minima rather than a single deep one 39. Since regions of disorder do not have specific coordinates, such regions are typically left out when protein 3D structures are displayed in journal articles and books. Maybe this omission is one of the reasons that disordered regions have been mostly ignored for so long when linkages between protein structure and function were discussed.
Another observation is that, just as shown in figure 1, all of the observed disordered segments are located in regions that are very likely to be external to the membrane bilayer. This result is in agreement with previous arguments that the TM parts of membrane proteins are likely to be highly structured due to the low dielectric constant 52, 53. Also, these disordered regions in membrane proteins show a length distribution that is quite similar to the distribution observed in PDB for water-soluble proteins (Figure 2(b)). So, these data suggest that structured water-soluble proteins and membrane proteins may have similar contents of disorder overall, but it should be kept in mind that there is always an uncertainty when using proteins from PDB regarding the extent to which the results are skewed due to sampling bias.
As mentioned in the introduction, several studies have used bioinformatics prediction methods to suggest that disordered regions are important for the function of, or commonly occur in the structures of, membrane proteins 1-5. One of the main purposes of the present study was to determine whether the predictors of disorder developed using disorder examples in water-soluble proteins could even be applied to detect disordered regions in membrane proteins. The results suggest that three different, representative predictors not only give good estimates of disorder in membrane proteins, but by some measures, the current predictors give better accuracies on membrane proteins as compared to water-soluble proteins (Figure 4 and Tables 2 and 3). To the extent that these structured proteins from PDB are representative of membrane proteins in general, these results provide at least some validation for the previous uses of disorder predictors in the study of membrane proteins.
The present study goes beyond mere validation of the use of disorder prediction in the study of membrane proteins and presents new information about such regions. First, we will discuss some of these observations and then we will discuss how these observations could be used to benefit future studies on the disordered regions of membrane proteins.
Previous studies on water-soluble proteins suggest that IDPs and IDRs have higher relative contents of polar, charged, and proline residues 4, 22, 40. In agreement with these earlier observations, the contents of polar residues, Q and S, charged residues R, E, K, and P residues in the fully disordered dataset analyzed in this paper are significantly higher than those in fully ordered dataset.
In contrast to the typical results observed for disordered regions in water soluble proteins just mentioned, in the disordered regions of helical TM proteins, the relative contents of Q, D, E, and K are greatly reduced, while P is slightly reduced compared to the disordered datasets but significantly increased compared the to fully structured set. In fact, the contents of D, E, and K are even lower than those in the fully ordered dataset. The content of G was similar in TMM-alpha and FDD datasets, whereas the content of S and N in TMM-alpha increases about 20% in comparison with the FDD dataset, and the composition of R increases by about 10%. In the disordered regions of the beta TM proteins, the contents of G, Q, S, and N are increased, while the content of P is slightly reduced but still with a value similar to that of the fully disordered dataset. However, the contents of R and K are all also reduced to even lower levels than those in the fully ordered dataset, and the content of D and E are also increased. Furthermore, in TMM-beta dataset, the contents of C, F, I, Y, V, L, and M are decreased, whereas the contents of H, A, and T are increased compared to fully disordered proteins (FDD).
The H content is rather stable in many datasets compared to other amino acids and hence has a value close to zero in the plot of relative composition 22, 40, 41, 68. However, in the disordered regions of TM proteins, histidine has much higher content than in the fully ordered and fully disordered datasets. A similar elevated level was reported earlier when disordered proteins identified by circular dichroism were compared with a dataset of globular proteins containing both ordered and disordered polypeptide chains 40. The relative content reported there was ∼ 0.5 40. Here in this paper, the relative ratios compared to partially disordered dataset are ∼0.5 for the disordered regions of helical and beta TM proteins. The ratios decrease to 0.15 when compared with disordered regions of the partially disordered dataset. Although H is not that common in proteins, the frequency of H is likely to be important for the success of disorder prediction. In fact, this parameter is one of the selected input features for the VLXT40, VSL241, and VL345 predictors used here, and this distinctive H content in TM proteins is likely important for the prediction accuracies reported here.
Overall, the analysis of amino acid compositions suggest that the disordered states of both helical and beta TM proteins may be more dependent on polar and proline residues and less dependent on charged residues and charge asymmetry as compared to disordered states in water-soluble proteins. Also, it was previously reported that there are more G and S residues and less E and K residues at the extracellular side of membrane proteins 4. We also notice a high G and S content in the disordered regions of membrane proteins as compared to disorder in water-soluble proteins. We previously found that, among the 20 amino acids, G and S ranked 1 and 2, respectively, for the variability in their allowed phi and psi angles taken from a large collection of structured proteins 69. The finding that S is more flexible than A was surprising, but might relate to extra structural variability brought about by the hydrogen bonding potential of the OH group on S. If, among all of the amino acids, G and S allow the most conformational flexibility, why do these two amino acids rank at 9 (G) and 3 (S) on the TOP-ID disorder propensity scale 70 rather than at the most-disorder promoting rankings of 1 and 2? One contributing factor is that both G and S are more common in structured proteins than might be expected because these two residues play special roles in the formation of structure. Due to its containing the smallest of all the side chains, G is often found in tight turns where the very small side chain allows a very close approach of the backbone and other side chains; S also often appears in tight turns due to its formation of a hydrogen bonds with the peptide group of the backbone such as when it forms a cap at the end of helix 71. Due to the absence of turns in the cores of TM proteins, perhaps S and G are less likely to appear in these regions, and therefore may have been selected for enrichment in disordered regions. This speculation needs to be tested further.
As indicated in Figure 5 and Tables 2 and 3, three current disorder predictions give greater accuracies in the overall prediction of order and disorder in membrane proteins as compared the predictions of the corresponding features of water-soluble proteins. Such a result is unexpected given that the predictors were trained on water-soluble proteins. As expected, the amino acid compositions of structured and disordered regions from membrane proteins are quite distinct from the corresponding features of water-soluble proteins (Figure 3 and Table 1), and furthermore, as expected predictions on disordered regions without considering predictions on ordered regions show that such predictions are much more accurate than predictions on long disordered regions (Figure 6). The higher accuracies from the ROC curves and the lower accuracies in predictions on disorder seem contradictory. The most likely explanation is that the TM segments of these proteins are especially hydrophobic and so are predicted to be structured with especially high accuracy, thus giving improved overall prediction accuracy, not because disordered regions have lower rates of prediction errors, but because the structured regions have very much lower rates of prediction errors and so compensate for the higher error rates on disordered regions.
An obvious direction for future work would be to train a new set of predictors using structure and disorder from a collection of membrane proteins. For such work, it is almost essential to have much more data. Of course this should happen over time. In addition, one could simply include proteins with a higher degree of sequence similarity overall. Since structure is a major determinant of sequence conservation, it is likely that the sequence conservation would be much less for the disordered regions of membrane proteins as compared to the sequence conservation of the structured regions of the same protein. In this case, keeping proteins with a higher sequence similarity in the structured regions might still add rather dissimilar data to the disordered datasets. Indeed, a faster rate of change for disorder as compared to structure is a common feature of water-soluble proteins 72, and the same would be expected for membrane proteins. If enough data could be collected, comparisons of disorder on the inner and outer sides of membranes would provide useful insight both for plasma and outer membrane proteins. Another useful exercise would be to partition the structured regions of membrane proteins into the TM segments and the loops that are exterior to the membrane bilayer. These exterior-to-the-bilayer segments are likely to be more similar to the disordered regions than the TM segments and so would provide a better set of sequences for training a disorder predictor for membrane proteins.
Disorder in water-soluble proteins has been shown to strongly associated with signaling in general 23, 25, 27, 32, especially by means of providing binding sites for other proteins 35, 36, 73-81 and for nucleic acids 38, 78, 82, 83, sites for posttranslational modification 29, 84, and sites for alternative splicing 85, 86. An improved predictor of disorder for membrane proteins would be a useful tool to help determine whether these and other important activities map to the intrinsically disordered regions in membrane proteins.
As stated earlier, previous predictions 1-5 and laboratory experiments 6-9 indicate the occurrence of disorder and its use for function in membrane proteins. We expect that this is just the beginning and that, just as for water-soluble proteins, intrinsic disorder will become increasingly recognized as a common and functionally important feature of membrane proteins.
Methods
Visualizing Disordered Regions
Ensembles of structures representing the disordered region were constructed using the Sybyl (Tripos, Inc., 1699 South Hanley Road, St. Louis, MO 63144) suite of programs. The biopolymer module within Sybyl was used for visualization, energy minimization, and short annealing molecular dynamics simulations of the various loops. The module reads Cartesian coordinates of the proteins provided from a PDB file, along with the sequence that corresponds to the missing electron density region. Hydrogen atoms and atomic charges were subsequently added to the structure. The SearchLoop option within the Sybyl package was then used to generate a set of potential conformers for the missing loops following an algorithm developed by Blundell and coworkers 87. The loops were classified according to (i) length, (ii) type of secondary structures that flank the loop, and (iii) conformation of the main chain. Two values were used to classify into structural families: mean distance between first and last Cα and the distance to the center of mass of the cluster. For each missing region, the top 25 conformers were selected and shown in Fig. 1.
Datasets
Five main datasets and eight of their subsets were utilized in this study. The original sources for these datasets were Protein Data Bank (PDB) 88, Protein Data Bank of Transmembrane Proteins (PDBTM) 89, and DisProt 90. The software XML2PDB 91 was applied to identify disordered residues in PDB by searching for the residues with missing coordinates.
The first and second datasets were helical TM proteins (TM-alpha) and beta TM proteins (TM-beta), which were obtained from PDBTM. Starting from 801 helical and 143 beta TM proteins, Blastclust from NCBI 92 was applied to remove sequences with > 25% sequence identity. With regard to the protein groups that contained multiple sequences with > 25% sequence identity in one cluster, the longest sequence was selected. The final TM-alpha dataset contained 170 proteins with 30104 residues. In this dataset, 2595 residues from 97 entries were disordered (His-tags and methionines at the first position were removed). The final TM-beta dataset had 37 proteins with 13081 residues. Of these, 614 residues in 23 entries were disordered.
The disordered regions of TM-alpha and TM-beta can be further classified as TMM-alpha and TMM-beta, respectively, where the second M indicates that these databases contain the sequences corresponding to the missing regions of electron density. There are 192 and 48 IDRs in the TMM-alpha and TMM-beta datasets, respectively. Each of the above four datasets, TM-alpha, TMM-alpha, TM-beta, and TMM-beta, was further split into two subsets according to the length of disordered regions, those with sequence length ≥ 30 residues constituted datasets of long IDRs, whereas IDR < 30 residues were assembled into a dataset of short IDRs.
The third dataset referred as Partially Disordered Dataset (PDD) was the same as that used in Ref. 22 It was a set of partially disordered globular proteins that contain a single chain and a unit cell with a primitive space group. The sequence identity of this dataset was less than 25%. PDD included 64 proteins containing 23466 residues (with His-tags removed), of which 3755 in 162 IDRs were disordered, as indicated by the missing electron density. A subset of PDD was developed by including the IDRs of partially disordered proteins and was referred to as PDDM. Both the PDD and PDDM datasets were further divided into long and short subsets according to the criteria mentioned above.
The fourth dataset was fully ordered dataset (FOD) with 554 sequences and 113895 residues 93. This data was derived from PDB database as of July 20, 2008 to include X-ray crystallography structures of single chain non-membrane proteins characterized by unit cells with primitive space groups. Next, all the structures containing ligands and disulfide bonds were removed from this set. By comparing the biological sequences and the crystallized sequences, structures with missing electron densities were also removed. The remaining sequences were further clustered by blastclust from NCBI 92 to keep only those sequences having less than 25% sequence identity. The longest sequence was selected from each protein group that contained multiple sequences with > 25% sequence identity in one cluster.
The fifth dataset had 84 fully disordered proteins (FDD) with 17853 residues 93. This group was extracted from DisProt 4.5 released at July 17, 2008 90. All partially disordered proteins were removed. Both the FOD and FDD datasets were used as references for composition comparison and analysis.
Dataset similarity
To compare overall amino acid compositions of different protein datasets, a Euclidean measure 62, the KL divergence 64, and the summed KL divergence can be used 65. These three measures are defined as follows:
The Kullback-Leibler (KL) divergence dKL(S1,S2) is as follows:
Where S1 and S2 are two different datasets, dKL(S1,S2) is the statistical divergence between them. p1(i) is the composition of i-th component in dataset S1.
The summed KL divergence is as follows:
The Euclid distance in the 20-dimensional space is calculated by the following:
Due to the extreme dissimilarity of sequences from structured and disordered regions, this equation has been simplified compared to that used previously 62.
Order/Disorder prediction
Three different disorder predictors from PONDR® family, VLXT 40, 43, VLS2 41, 46, VL3 24, 44, 45, were used to analyze the differences between the above-described datasets. PONDR® VLXT is an integration of three artificial neural networks which were designed for each of the termini and the internal part of the sequences, respectively. Each individual predictor was trained in a dataset containing only the corresponding part of sequences. The inputs of the neural networks were amino acid composition, hydropathy, net charge, flexibility, and coordination number. The final prediction result was an average over the overlapping regions of three independent predictors 40, 43. VLXT has the advantage of identifying likely binding sites within IDPs and IDRs 75.
PONDR® VSL2 utilized support vector machines to train on long sequences with length ≥ 30 and on short sequences of length < 30, separately. The inputs included hydropathy, net charge, flexibility, coordination number, PSSM from PSI-blast 94, predicted secondary structures from PHDsec 95 and PSIPRED 96. The final output was a weighted average with the weights determined by a meta-predictor 41, 46. VSL2 is accurate in detecting both short and long disordered sequences.
PONDR® VL3 uses a majority voting approach from the predictions given by an ensemble of individual neural networks. The inputs of VL3 were also a combination of flexibility, hydropathy, and amino acid compositions 24, 44, 45. This predictor is especially appropriate for long disordered sequences.
All the above predictors calculated a prediction score for each residue in the sequence. By setting up the threshold value of the prediction score, all the residues whose prediction scores were higher than the threshold value were assigned to be disordered, and the lower-score residues were assigned to be structured.
Accuracy evaluation
Receiver operating characteristic (ROC) 97 plots and simple plots of accuracy versus threshold values were employed to evaluate the performance of each predictor on the available datasets. A difficulty is that the number of structured examples is far larger than the number of disordered examples. For such datasets with imbalanced classes, a useful approach is to use essentially all of the examples from the smaller set and then to use bootstrap statistics with random samples that span the range of examples in the larger set 98. Thus, the first step was to identify the number of true disordered amino acids in the dataset. Then a group of equal number of true ordered amino acids was randomly selected from the same dataset. By using these two sets of examples, a simple ROC curve was calculated. The process of random selection was repeated 1000 times to implement the bootstrapping. The final ROC showed not only the average value of 1000 simple ROC curves, but also the statistical error of them. Because we took all the disordered amino acids into consideration, the error was only presented on specificity for assessing prediction performance of disordered residues. Next we calculated new ROC curves corresponding to plus and minus one standard deviation from each point. These new curves were used to estimate the variances for the areas under the curves, for the variances of the thresholds, and for the variances in the prediction accuracies.
Supplementary Material
Acknowledgments
This work was supported in part by the grants R01 LM007688-01A1 (to A.K.D and V.N.U.) and GM071714-01A2 (to A.K.D and V.N.U.) from the National Institute of Health and the Programs of the Russian Academy of Sciences for the “Molecular and Cellular Biology” (to V.N.U.). We also gratefully acknowledge the support of the IUPUI Signature Centers Initiative.
Contributor Information
Bin Xue, Email: binxue@iupui.edu.
Liwei Li, Email: liwli@iupui.edu.
Samy O. Meroueh, Email: smeroueh@iupui.edu.
Vladimir N. Uversky, Email: vuversky@iupui.edu.
A. Keith Dunker, Email: kedunker@iupui.edu.
References
- 1.Magidovich E, Fleishman SJ, Yifrach O. Bioinformatics. 2006;22:1546–1550. doi: 10.1093/bioinformatics/btl137. [DOI] [PubMed] [Google Scholar]
- 2.Roy S, Schnell S, Radivojac P. Comput Biol Chem. 2006;30:241–248. doi: 10.1016/j.compbiolchem.2006.04.005. [DOI] [PMC free article] [PubMed] [Google Scholar]
- 3.Minezaki Y, Homma K, Nishikawa K. J Mol Biol. 2007;368:902–913. doi: 10.1016/j.jmb.2007.02.033. [DOI] [PubMed] [Google Scholar]
- 4.De Biasio A, Guarnaccia C, Popovic M, Uversky VN, Pintar A, Pongor S. J Proteome Res. 2008;7:2496–2506. doi: 10.1021/pr800063u. [DOI] [PMC free article] [PubMed] [Google Scholar]
- 5.Yang JY, Yang MQ, Dunker AK, Deng Y, Huang X. BMC Genomics. 2008;9 1:S7. doi: 10.1186/1471-2164-9-S1-S7. [DOI] [PMC free article] [PubMed] [Google Scholar]
- 6.Langen R, Cai K, Altenbach C, Khorana HG, Hubbell WL. Biochemistry. 1999;38:7918–7924. doi: 10.1021/bi990010g. [DOI] [PubMed] [Google Scholar]
- 7.Long SB, Campbell EB, Mackinnon R. Science. 2005;309:897–903. doi: 10.1126/science.1116269. [DOI] [PubMed] [Google Scholar]
- 8.Magidovich E, Orr I, Fass D, Abdu U, Yifrach O. Proc Natl Acad Sci U S A. 2007;104:13022–13027. doi: 10.1073/pnas.0704059104. [DOI] [PMC free article] [PubMed] [Google Scholar]
- 9.Popovic M, Coglievina M, Guarnaccia C, Verdone G, Esposito G, Pintar A, Pongor S. Protein Expr Purif. 2006;47:398–404. doi: 10.1016/j.pep.2005.11.027. [DOI] [PubMed] [Google Scholar]
- 10.Wright PE, Dyson HJ. J Mol Biol. 1999;293:321–331. doi: 10.1006/jmbi.1999.3110. [DOI] [PubMed] [Google Scholar]
- 11.Dunker AK, Lawson JD, Brown CJ, Williams RM, Romero P, Oh JS, Oldfield CJ, Campen AM, Ratliff CM, Hipps KW, Ausio J, Nissen MS, Reeves R, Kang C, Kissinger CR, Bailey RW, Griswold MD, Chiu W, Garner EC, Obradovic Z. J Mol Graph Model. 2001;19:26–59. doi: 10.1016/s1093-3263(00)00138-8. [DOI] [PubMed] [Google Scholar]
- 12.Uversky VN, Gillespie JR, Fink AL. Proteins. 2000;41:415–427. doi: 10.1002/1097-0134(20001115)41:3<415::aid-prot130>3.0.co;2-7. [DOI] [PubMed] [Google Scholar]
- 13.Tompa P. Journal of Molecular Structure-Theochem. 2003;666:361–371. [Google Scholar]
- 14.Dunker AK, Obradovic Z. Nat Biotechnol. 2001;19:805–806. doi: 10.1038/nbt0901-805. [DOI] [PubMed] [Google Scholar]
- 15.Tran HT, Mao A, Pappu RV. J Am Chem Soc. 2008;130:7380–7392. doi: 10.1021/ja710446s. [DOI] [PubMed] [Google Scholar]
- 16.Uversky VN. Protein Sci. 2002;11:739–756. doi: 10.1110/ps.4210102. [DOI] [PMC free article] [PubMed] [Google Scholar]
- 17.Uversky VN. Cell Mol Life Sci. 2003;60:1852–1871. doi: 10.1007/s00018-003-3096-6. [DOI] [PMC free article] [PubMed] [Google Scholar]
- 18.Golovanov AP, Chuang TH, DerMardirossian C, Barsukov I, Hawkins D, Badii R, Bokoch GM, Lian LY, Roberts GC. J Mol Biol. 2001;305:121–135. doi: 10.1006/jmbi.2000.4262. [DOI] [PubMed] [Google Scholar]
- 19.Dastmalchi S, Church WB, Morris MB, Iismaa TP, Mackay JP. J Struct Biol. 2004;146:261–271. doi: 10.1016/j.jsb.2004.01.004. [DOI] [PubMed] [Google Scholar]
- 20.Uversky VN, Oldfield CJ, Dunker AK. J Mol Recognit. 2005;18:343–384. doi: 10.1002/jmr.747. [DOI] [PubMed] [Google Scholar]
- 21.Dunker AK, Obradovic Z, Romero P, Garner EC, Brown CJ. Genome Inform Ser Workshop Genome Inform. 2000;11:161–171. [PubMed] [Google Scholar]
- 22.Oldfield CJ, Cheng Y, Cortese MS, Brown CJ, Uversky VN, Dunker AK. Biochemistry. 2005;44:1989–2000. doi: 10.1021/bi047993o. [DOI] [PubMed] [Google Scholar]
- 23.Ward JJ, Sodhi JS, McGuffin LJ, Buxton BF, Jones DT. J Mol Biol. 2004;337:635–645. doi: 10.1016/j.jmb.2004.02.002. [DOI] [PubMed] [Google Scholar]
- 24.Obradovic Z, Peng K, Vucetic S, Radivojac P, Brown CJ, Dunker AK. Proteins. 2003;53 6:566–572. doi: 10.1002/prot.10532. [DOI] [PubMed] [Google Scholar]
- 25.Dunker AK, Brown CJ, Lawson JD, Iakoucheva LM, Obradovic Z. Biochemistry. 2002;41:6573–6582. doi: 10.1021/bi012159+. [DOI] [PubMed] [Google Scholar]
- 26.Dunker AK, Brown CJ, Obradovic Z. Adv Protein Chem. 2002;62:25–49. doi: 10.1016/s0065-3233(02)62004-2. [DOI] [PubMed] [Google Scholar]
- 27.Xie H, Vucetic S, Iakoucheva LM, Oldfield CJ, Dunker AK, Uversky VN, Obradovic Z. J Proteome Res. 2007;6:1882–1898. doi: 10.1021/pr060392u. [DOI] [PMC free article] [PubMed] [Google Scholar]
- 28.Vucetic S, Xie H, Iakoucheva LM, Oldfield CJ, Dunker AK, Obradovic Z, Uversky VN. J Proteome Res. 2007;6:1899–1916. doi: 10.1021/pr060393m. [DOI] [PMC free article] [PubMed] [Google Scholar]
- 29.Xie H, Vucetic S, Iakoucheva LM, Oldfield CJ, Dunker AK, Obradovic Z, Uversky VN. J Proteome Res. 2007;6:1917–1932. doi: 10.1021/pr060394e. [DOI] [PMC free article] [PubMed] [Google Scholar]
- 30.Dunker AK, Cortese MS, Romero P, Iakoucheva LM, Uversky VN. FEBS J. 2005;272:5129–5148. doi: 10.1111/j.1742-4658.2005.04948.x. [DOI] [PubMed] [Google Scholar]
- 31.Dunker AK, Oldfield CJ, Meng J, Romero P, Yang JY, Chen JW, Vacic V, Obradovic Z, Uversky VN. BMC Genomics. 2008;9 2:S1. doi: 10.1186/1471-2164-9-S2-S1. [DOI] [PMC free article] [PubMed] [Google Scholar]
- 32.Iakoucheva LM, Brown CJ, Lawson JD, Obradovic Z, Dunker AK. J Mol Biol. 2002;323:573–584. doi: 10.1016/s0022-2836(02)00969-5. [DOI] [PubMed] [Google Scholar]
- 33.Dyson HJ, Wright PE. Curr Opin Struct Biol. 2002;12:54–60. doi: 10.1016/s0959-440x(02)00289-0. [DOI] [PubMed] [Google Scholar]
- 34.Dyson HJ, Wright PE. Nat Rev Mol Cell Biol. 2005;6:197–208. doi: 10.1038/nrm1589. [DOI] [PubMed] [Google Scholar]
- 35.Tompa P. Trends Biochem Sci. 2002;27:527–533. doi: 10.1016/s0968-0004(02)02169-2. [DOI] [PubMed] [Google Scholar]
- 36.Tompa P. FEBS Lett. 2005;579:3346–3354. doi: 10.1016/j.febslet.2005.03.072. [DOI] [PubMed] [Google Scholar]
- 37.Fink AL. Curr Opin Struct Biol. 2005;15:35–41. doi: 10.1016/j.sbi.2005.01.002. [DOI] [PubMed] [Google Scholar]
- 38.Minezaki Y, Homma K, Kinjo AR, Nishikawa K. J Mol Biol. 2006;359:1137–1149. doi: 10.1016/j.jmb.2006.04.016. [DOI] [PubMed] [Google Scholar]
- 39.Uversky VN, Oldfield CJ, Dunker AK. Annu Rev Biophys. 2008;37:215–246. doi: 10.1146/annurev.biophys.37.032807.125924. [DOI] [PubMed] [Google Scholar]
- 40.Romero P, Obradovic Z, Li X, Garner EC, Brown CJ, Dunker AK. Proteins. 2001;42:38–48. doi: 10.1002/1097-0134(20010101)42:1<38::aid-prot50>3.0.co;2-3. [DOI] [PubMed] [Google Scholar]
- 41.Peng K, Radivojac P, Vucetic S, Dunker AK, Obradovic Z. Bmc Bioinformatics. 2006;7 doi: 10.1186/1471-2105-7-208. [DOI] [PMC free article] [PubMed] [Google Scholar]
- 42.Vacic V, Uversky VN, Dunker AK, Lonardi S. Bmc Bioinformatics. 2007;8:211. doi: 10.1186/1471-2105-8-211. [DOI] [PMC free article] [PubMed] [Google Scholar]
- 43.Romero P, Obradovic Z, Kissinger CR, Villafranca JE, Dunker AK. IEEE Int Conf Neural Networks. 1997;1:90–95. [Google Scholar]
- 44.Vucetic S, Brown CJ, Dunker AK, Obradovic Z. Proteins. 2003;52:573–584. doi: 10.1002/prot.10437. [DOI] [PubMed] [Google Scholar]
- 45.Peng K, Vucetic S, Radivojac P, Brown CJ, Dunker AK, Obradovic Z. J Bioinform Comput Biol. 2005;3:35–60. doi: 10.1142/s0219720005000886. [DOI] [PubMed] [Google Scholar]
- 46.Obradovic Z, Peng K, Vucetic S, Radivojac P, Dunker AK. Proteins. 2005;61 7:176–182. doi: 10.1002/prot.20735. [DOI] [PubMed] [Google Scholar]
- 47.Liu J, Tan H, Rost B. J Mol Biol. 2002;322:53–64. doi: 10.1016/s0022-2836(02)00736-2. [DOI] [PubMed] [Google Scholar]
- 48.Dosztanyi Z, Csizmok V, Tompa P, Simon I. J Mol Biol. 2005;347:827–839. doi: 10.1016/j.jmb.2005.01.071. [DOI] [PubMed] [Google Scholar]
- 49.Dosztanyi Z, Csizmok V, Tompa P, Simon I. Bioinformatics. 2005;21:3433–3434. doi: 10.1093/bioinformatics/bti541. [DOI] [PubMed] [Google Scholar]
- 50.Lenard J, Singer SJ. Proc Natl Acad Sci U S A. 1966;56:1828–1835. doi: 10.1073/pnas.56.6.1828. [DOI] [PMC free article] [PubMed] [Google Scholar]
- 51.Rosenbusch JP. J Biol Chem. 1974;249:8019–8029. [PubMed] [Google Scholar]
- 52.Dunker AK, Jones TC. Membr Biochem. 1978;2:1–16. doi: 10.3109/09687687809063855. [DOI] [PubMed] [Google Scholar]
- 53.Paul C, Rosenbusch JP. Embo J. 1985;4:1593–1597. doi: 10.1002/j.1460-2075.1985.tb03822.x. [DOI] [PMC free article] [PubMed] [Google Scholar]
- 54.Rees DC, DeAntonio L, Eisenberg D. Science. 1989;245:510–513. doi: 10.1126/science.2667138. [DOI] [PubMed] [Google Scholar]
- 55.Stevens TJ, Arkin IT. Proteins. 1999;36:135–143. doi: 10.1002/(sici)1097-0134(19990701)36:1<135::aid-prot11>3.0.co;2-i. [DOI] [PubMed] [Google Scholar]
- 56.Rees DC, Eisenberg D. Proteins. 2000;38:121–122. [PubMed] [Google Scholar]
- 57.Von Heijne G. EMBO J. 1986;5:3021–3027. doi: 10.1002/j.1460-2075.1986.tb04601.x. [DOI] [PMC free article] [PubMed] [Google Scholar]
- 58.Bernsel A, Viklund H, Falk J, Lindahl E, von Heijne G, Elofsson A. Proc Natl Acad Sci U S A. 2008;105:7177–7181. doi: 10.1073/pnas.0711151105. [DOI] [PMC free article] [PubMed] [Google Scholar]
- 59.Krogh A, Larsson B, von Heijne G, Sonnhammer EL. J Mol Biol. 2001;305:567–580. doi: 10.1006/jmbi.2000.4315. [DOI] [PubMed] [Google Scholar]
- 60.Elofsson A, von Heijne G. Annu Rev Biochem. 2007;76:125–140. doi: 10.1146/annurev.biochem.76.052705.163539. [DOI] [PubMed] [Google Scholar]
- 61.von Heijne G. Nat Rev Mol Cell Biol. 2006;7:909–918. doi: 10.1038/nrm2063. [DOI] [PubMed] [Google Scholar]
- 62.Nakashima H, Nishikawa K, Ooi T. J Biochem. 1986;99:153–162. doi: 10.1093/oxfordjournals.jbchem.a135454. [DOI] [PubMed] [Google Scholar]
- 63.Radivojac P, Obradovic Z, Smith DK, Zhu G, Vucetic S, Brown CJ, Lawson JD, Dunker AK. Protein Sci. 2004;13:71–80. doi: 10.1110/ps.03128904. [DOI] [PMC free article] [PubMed] [Google Scholar]
- 64.Kullback S. The American Statistician. 1987;41:340–341. [Google Scholar]
- 65.Lin J. IEEE Transactions on Information Theory. 1991;37:145–151. [Google Scholar]
- 66.Le Gall T, Romero PR, Cortese MS, Uversky VN, Dunker AK. J Biomol Struct Dyn. 2007;24:325–342. doi: 10.1080/07391102.2007.10507123. [DOI] [PubMed] [Google Scholar]
- 67.Daughdrill GW, Pielak GJ, Uversky VN, Cortese MS, Dunker AK. In: Protein Folding Handbook. Buchner J, Kiefhaber T, editors. Vol. 3. Wiley-VCH, Verlag GmbH & Co KGaA; Weinheim, Germany: 2005. pp. 275–357. [Google Scholar]
- 68.Radivojac P, Iakoucheva LM, Oldfield CJ, Obradovic Z, Uversky VN, Dunker AK. Biophys J. 2007;92:1439–1456. doi: 10.1529/biophysj.106.094045. [DOI] [PMC free article] [PubMed] [Google Scholar]
- 69.Miller RT, Douthart RJ, Dunker AK. Proc Twenty-seventh Hawaii Int Conf Sys Sci. 1994;27:235–244. [Google Scholar]
- 70.Campen A, Williams RM, Brown CJ, Meng J, Uversky VN, Dunker AK. Protein Pept Lett. 2008;15:956–963. doi: 10.2174/092986608785849164. [DOI] [PMC free article] [PubMed] [Google Scholar]
- 71.Presta LG, Rose GD. Science. 1988;240:1632–1641. doi: 10.1126/science.2837824. [DOI] [PubMed] [Google Scholar]
- 72.Brown CJ, Takayama S, Campen AM, Vise P, Marshall TW, Oldfield CJ, Williams CJ, Dunker AK. J Mol Evol. 2002;55:104–110. doi: 10.1007/s00239-001-2309-6. [DOI] [PubMed] [Google Scholar]
- 73.Cheng Y, Oldfield CJ, Meng J, Romero P, Uversky VN, Dunker AK. Biochemistry. 2007;46:13468–13477. doi: 10.1021/bi7012273. [DOI] [PMC free article] [PubMed] [Google Scholar]
- 74.Mohan A, Oldfield CJ, Radivojac P, Vacic V, Cortese MS, Dunker AK, Uversky VN. J Mol Biol. 2006;362:1043–1059. doi: 10.1016/j.jmb.2006.07.087. [DOI] [PubMed] [Google Scholar]
- 75.Oldfield CJ, Cheng Y, Cortese MS, Romero P, Uversky VN, Dunker AK. Biochemistry. 2005;44:12454–12470. doi: 10.1021/bi050736e. [DOI] [PubMed] [Google Scholar]
- 76.Oldfield CJ, Meng J, Yang JY, Yang MQ, Uversky VN, Dunker AK. BMC Genomics. 2008;9 1:S1. doi: 10.1186/1471-2164-9-S1-S1. [DOI] [PMC free article] [PubMed] [Google Scholar]
- 77.Tompa P, Fuxreiter M, Oldfield CJ, Simon I, Dunker AK, Uversky VN. Bioessays. 2009;31:328–335. doi: 10.1002/bies.200800151. [DOI] [PubMed] [Google Scholar]
- 78.Toth-Petroczy A, Oldfield CJ, Simon I, Takagi Y, Dunker AK, Uversky VN, Fuxreiter M. PLoS Comput Biol. 2008;4:e1000243. doi: 10.1371/journal.pcbi.1000243. [DOI] [PMC free article] [PubMed] [Google Scholar]
- 79.Vacic V, Oldfield CJ, Mohan A, Radivojac P, Cortese MS, Uversky VN, Dunker AK. J Proteome Res. 2007;6:2351–2366. doi: 10.1021/pr0701411. [DOI] [PMC free article] [PubMed] [Google Scholar]
- 80.Neduva V, Russell RB. FEBS Lett. 2005;579:3342–3345. doi: 10.1016/j.febslet.2005.04.005. [DOI] [PubMed] [Google Scholar]
- 81.Davey NE, Shields DC, Edwards RJ. Nucleic Acids Res. 2006;34:3546–3554. doi: 10.1093/nar/gkl486. [DOI] [PMC free article] [PubMed] [Google Scholar]
- 82.Liu J, Perumal NB, Oldfield CJ, Su EW, Uversky VN, Dunker AK. Biochemistry. 2006;45:6873–6888. doi: 10.1021/bi0602718. [DOI] [PMC free article] [PubMed] [Google Scholar]
- 83.Garza AS, Ahmad N, Kumar R. Life Sci. 2009;84:189–193. doi: 10.1016/j.lfs.2008.12.002. [DOI] [PubMed] [Google Scholar]
- 84.Iakoucheva LM, Radivojac P, Brown CJ, O'Connor TR, Sikes JG, Obradovic Z, Dunker AK. Nucleic Acids Res. 2004;32:1037–1049. doi: 10.1093/nar/gkh253. [DOI] [PMC free article] [PubMed] [Google Scholar]
- 85.Romero PR, Zaidi S, Fang YY, Uversky VN, Radivojac P, Oldfield CJ, Cortese MS, Sickmeier M, LeGall T, Obradovic Z, Dunker AK. Proc Natl Acad Sci U S A. 2006;103:8390–8395. doi: 10.1073/pnas.0507916103. [DOI] [PMC free article] [PubMed] [Google Scholar]
- 86.Tress ML, Bodenmiller B, Aebersold R, Valencia A. Genome Biol. 2008;9:R162. doi: 10.1186/gb-2008-9-11-r162. [DOI] [PMC free article] [PubMed] [Google Scholar]
- 87.Burke DF, Deane CM, Blundell TL. Bioinformatics. 2000;16:513–519. doi: 10.1093/bioinformatics/16.6.513. [DOI] [PubMed] [Google Scholar]
- 88.Berman HM, Westbrook J, Feng Z, Gilliland G, Bhat TN, Weissig H, Shindyalov IN, Bourne PE. Nucleic Acids Research. 2000;28:235–242. doi: 10.1093/nar/28.1.235. [DOI] [PMC free article] [PubMed] [Google Scholar]
- 89.Tusnady GE, Dosztanyi Z, Simon I. Bioinformatics. 2004;20:2964–2972. doi: 10.1093/bioinformatics/bth340. [DOI] [PubMed] [Google Scholar]
- 90.Sickmeier M, Hamilton JA, LeGall T, Vacic V, Cortese MS, Tantos A, Szabo B, Tompa P, Chen J, Uversky VN, Obradovic Z, Dunker AK. Nucleic Acids Res. 2007;35:D786–793. doi: 10.1093/nar/gkl893. [DOI] [PMC free article] [PubMed] [Google Scholar]
- 91.Dunbrack RL. [Google Scholar]
- 92.BLASTCLUST
- 93.Xue B, Oldfield CJ, Dunker AK, Uversky VN. FEBS Lett. 2009 doi: 10.1016/j.febslet.2009.03.070. [DOI] [PMC free article] [PubMed] [Google Scholar]
- 94.Altschul SF, Madden TL, Schaffer AA, Zhang J, Zhang Z, Miller W, Lipman DJ. Nucleic Acids Res. 1997;25:3389–3402. doi: 10.1093/nar/25.17.3389. [DOI] [PMC free article] [PubMed] [Google Scholar]
- 95.Rost B, Sander C, Schneider R. Comput Appl Biosci. 1994;10:53–60. doi: 10.1093/bioinformatics/10.1.53. [DOI] [PubMed] [Google Scholar]
- 96.McGuffin LJ, Bryson K, Jones DT. Bioinformatics. 2000;16:404–405. doi: 10.1093/bioinformatics/16.4.404. [DOI] [PubMed] [Google Scholar]
- 97.Balakrishnan N. Handbook of the logistic distribution, Marcel Dekker Inc. 1991 [Google Scholar]
- 98.Radivojac P, Chawla NV, Dunker AK, Obradovic Z. J Biomed Inform. 2004;37:224–239. doi: 10.1016/j.jbi.2004.07.008. [DOI] [PubMed] [Google Scholar]
Associated Data
This section collects any data citations, data availability statements, or supplementary materials included in this article.


