

Abstract
In prokaryotes, RNA thermometers regulate a number of heat shock and virulence genes. These temperature sensitive RNA elements are usually located in the 5′-untranslated regions of the regulated genes. They repress translation initiation by base pairing to the Shine–Dalgarno sequence at low temperatures. We investigated the thermodynamic stability of the temperature labile hairpin 2 of the Salmonella fourU RNA thermometer over a broad temperature range and determined free energy, enthalpy and entropy values for the base-pair opening of individual nucleobases by measuring the temperature dependence of the imino proton exchange rates via NMR spectroscopy. Exchange rates were analyzed for the wild-type (wt) RNA and the A8C mutant. The wt RNA was found to be stabilized by the extraordinarily stable G14–C25 base pair. The mismatch base pair in the wt RNA thermometer (A8–G31) is responsible for the smaller cooperativity of the unfolding transition in the wt RNA. Enthalpy and entropy values for the base-pair opening events exhibit linear correlation for both RNAs. The slopes of these correlations coincide with the melting points of the RNAs determined by CD spectroscopy. RNA unfolding occurs at a temperature where all nucleobases have equal thermodynamic stabilities. Our results are in agreement with a consecutive zipper-type unfolding mechanism in which the stacking interaction is responsible for the observed cooperativity. Furthermore, remote effects of the A8C mutation affecting the stability of nucleobase G14 could be identified. According to our analysis we deduce that this effect is most probably transduced via the hydration shell of the RNA.
INTRODUCTION
Over recent years, a large body of experimental evidence accumulated revealing the potential of RNAs to regulate the gene-expression pattern of eukaryotic (1–3) and prokaryotic organisms (4–6). Regulatory RNAs are capable of sensing environmental parameters and reacting thereupon by defined structural rearrangements. The structural alterations subsequently lead to changes of gene-expression levels in order to accommodate or react to altered environmental conditions. RNA sensors are independent regulatory devices that typically do not require accessory proteins to be regulatory active. Riboswitches, for instance, control the expression of a considerable number of bacterial genes (7–11) by binding and sensing the concentration of a large variety of low molecular weight compounds.
RNA thermometers located in the 5′-untranslated region (5′-UTR) of mRNAs have the ability to sense temperature. At low temperatures, they render the Shine–Dalgarno (SD) sequence inaccessible and thereby prevent translation initiation. At higher temperatures, partial unfolding of the secondary structure librates the ribosome-binding site and translation initiation can occur (12,13).
ROSE (repression of heat shock gene expression)-like RNA thermometers typically consist of several stem loops and control the expression of small heat shock genes in α- and γ-proteobacteria (13–15). The relevant helix blocking the SD sequence is temperature-labile because of unusual non-canonical base pairing interactions (16). Another class, the fourU RNA thermometers has been shown to induce the expression of the small heat shock protein AgsA in Salmonella at elevated temperatures (17). It is comprised of 4 adjacent uridine nucleotides which base pair with the SD sequence (5′-AGGAG-3′) at low temperatures.
Besides naturally occurring RNA thermometers, artificially engineered RNA thermometers have proven to be fully functional (18,19). These reductionist RNA elements are simply composed of a temperature-labile RNA helix blocking the SD sequence at low temperatures. These synthetic RNA thermosensors provided evidence that blocking of the SD sequence by base pairing is a sufficient requirement to influence the gene expression of a downstream gene.
Previous experiments on RNA thermometers have left several key questions open: Which regulatory requirements do RNA thermometers have to fulfill to adjust the gene expression exactly to the needs of the prokaryotic cell? Which parameters are crucial for tuning the dynamic characteristics of the RNA thermometer? An RNA thermometer can be specified by the temperature region in which gene induction is desired and the strength of induction of the gene product under control. Some RNA thermometers might regulate gene expression very strongly upon small changes in temperature thereby acting as binary on/off switches. RNA thermometers can, however, also modulate gene-expression levels rather smoothly over a wide temperature range comparable to a dimmer. These properties are determined by the temperature-dependent stability of the RNA helix and the cooperativity of the unfolding transition.
Here, we used nuclear magnetic resonance (NMR) spectroscopy to investigate the temperature-dependent stability of the Salmonella fourU RNA thermometer and the cooperativity of its unfolding transition by characterizing the exchange rates of imino hydrogens with the solvent water. These rates provide information on nucleobase stabilities since imino hydrogens participating in hydrogen bonds to other nucleobases are protected from exchange with the solvent (20,21).
In the past, several studies determined base-pair lifetimes of nucleobases by analyzing the dependence of imino exchange rates of nucleobases in RNA (22–28), in tRNA (27), in DNA (22,29–33) and in RNA–DNA hybrids (34–36) on the catalyst concentration. However, the temperature dependence of imino proton exchange rates in RNA molecules has not been analyzed until now.
In this work, we analyze the temperature dependence of the imino proton exchange rates of individual nucleobases within the temperature-responsive second helix of the fourU RNA thermometer. We measured the imino proton exchange rates under EX2 conditions which makes time consuming catalyst titrations dispensable (further discussion in ‘Materials and methods’ section, Imino proton exchange analysis). Applying this approach to the fourU RNA thermometer, it was possible to deduce atom-resolved information on the base-pair stabilities and dissect entropy and enthalpy contributions of the base-pair opening events (Figure 1A). We performed this analysis on the fourU-hairpin2-wt (4U-hp2-wt) RNA (Figure 1B) and the fourU-hairpin2-A8C-mutant (4U-hp2-A8C-mutant) RNA (Figure 1C) and compared the obtained data to circular dichroism (CD) unfolding curves of these two RNAs. By comparing nucleobase stabilities of both RNAs, crucial factors influencing entire helical stability could be identified. Furthermore, from the comparison of the temperature dependence of the base-pair stabilities with the CD melting curves general principles determining the unfolding process of RNA molecules could be deduced.
Figure 1.

(A) Energy diagram describing the imino proton exchange process from the nucleobase in the closed (base paired) conformation to the water. (B) Secondary structure of the 4U-hp2-wt RNA (C) Secondary structure of the 4U-hp2-A8C-mutant RNA. The A8C mutant corresponds to the A29C mutant of the full-length RNA (17).
MATERIALS AND METHODS
NMR spectroscopy
NMR measurements were performed on 600, 800 and 900 MHz Bruker NMR spectrometers equipped with 5 mm cryogenic HCN z-gradient probes. The spectra were recorded and processed using the Bruker TopSpin 2.0/2.1 software. The processed spectra were converted to the UCSF file format and analyzed with Sparky 3.1.1.3.
Resonance assignment
NOESY: For the assignment of the imino resonances of the 15N-labeled 4U-hp2-wt RNA as well as for the 4U-hp2-A8C mutant RNA 2D-1H Soft Watergate NOESY (37,38) experiments with a mixing time of Tm = 150 ms were recorded at a temperature of 283 K. Proton hard pulses were applied at 7.5 ppm prior to the mixing time and at the water frequency (4.7 ppm) during and after the mixing time. During t1 evolution, a 15N 180° hard pulse was applied in order to decouple the 15N resonances from the 1H resonances. The offset of this pulse was set to 121 ppm. The rf field strength was set to 7.4 kHz. During acquisition of the FID GARP4 (39) broadband decoupling was applied on the 15N channel with an rf field strength of 2000 Hz. The 15N carrier frequency was set to 152 ppm. Spectra were recorded with spectral widths of 15 ppm in the indirect dimension and 24 ppm in the direct dimension. 1024 increments were recorded in the t1 dimension and 4096 points in the t2 dimension. Each increment was recorded with 64 scans for the 4U-hp2-wt RNA and with 128 scans for the 4U-hp2-A8C-mut RNA. The recycling delay was set to 1.7 s. For the 4U-hp2-wt RNA a 15N edited 3D-NOESY-HSQC (40) with a Soft Watergate water suppression (38) (Bruker pulse program library na_noesyhsqcf3gpwg3d) was recorded at a temperature of 10°C and a magnetic field strength of 900 MHz in order to resolve assignment ambiguities in the 1H dimension.
15N-HSQC
15N-HSQCs were recorded at 600, 800 and 900 MHz using a standard pulse sequence (41) (Topspin 2.1 pulse program library: fhsqcf3gpph) with a Hard Watergate pulse train for the water suppression (42). Spectra were recorded with a spectral width of 26 ppm in the 15N dimension and 24 ppm in the 1H dimension.
HNN-COSY
The HNN-COSY experiments were recorded at magnetic field strengths of 600 and 800 MHz at temperatures of 10 or 20°C. The experiments were set up as described previously (43).
Inversion recovery experiments
Inversion recovery experiments were performed using a modified 15N HSQC pulse program element with a Hard Watergate pulse train for the water suppression. The inversion recovery pulse program element (44) was placed in front of the 15N-HSQC pulse program element. The inversion recovery module consists of a 180° RE-BURP soft pulse applied on the water frequency, followed by a variable mixing delay τm. During this delay bipolar gradients were applied in z-direction in order to suppress radiation damping of the water signal. The strengths of the bipolar gradients were set to 5%. One hundred percent gradient strength corresponds to 55 Gauss/cm. For τm delays shorter than 300 ms, a second 180° RE-BURP soft pulse was applied on the water frequency directly before the 15N-HSQC pulse program element in order to achieve a better water suppression. The experiment was recorded as a pseudo-3D for various temperatures between 5 and 50°C. At each temperature, between 18 and 22 different τm delays were recorded. The τm delays lie between 2 ms and 4 s. The recycling delay was set to 6 s. Two scans were used for each increment. Totally 120 increments were recorded in the 15N dimension and 2048 points in the 1H dimension.
RNA preparation
15N-labeled RNA oligonucleotides were synthesized by in vitro transcription with T7 polymerase using 15N-labeled nucleotides purchased from Silantes (Munich, Germany). Linearized plasmid DNA was utilized as template for the RNA polymerization. The RNA was purified as described previously (45). Subsequently, the RNA was desalted using Vivaspin 20 concentrators with a molecular weight cutoff (MWCO) of 3000 Da from Sartorius stedim biotech (Aubagne Cedex, France). Refolding of the RNA was achieved by denaturing for 10 min at a concentration of 0.25 mM and a temperature of 95°C followed by 20-fold dilution with ice-cold water and subsequent incubation at 0°C for another 30 min. The RNA was concentrated and exchanged to NMR buffer using Vivaspin 20 concentrators (MWCO = 3000 Da). The correct folding of the RNA was verified by native polyacrylamide gel electrophoresis. The final NMR sample of the 15N-labeled 4U-hp2-wt (fourU-hairpin2-wildtype) RNA contained 0.7 mM RNA, 15 mM KxHyPO4 (pH 6.5), 25 mM KCl, 90% H2O and 10% D2O. The final NMR sample of the 15N-labeled 4U-hp2-A8C-mutant RNA contained 1.1 mM RNA, 15 mM KxHyPO4 (pH 6.5), 25 mM KCl, 90% H2O and 10% D2O.
Native gel electrophoresis
The 5× loading buffer was composed of 87% glycerole, 0.1% (w/v) xylene cyanole FF and 0.1% (w/v) bromophenol blue. The 1× running buffer contained 50 mM Tris–acatate and 50 mM sodium phosphate (pH 8.3). The gel was cast using 15% acrylamide with an acrylamide:bisacrylamide ratio of 37.5:1. Running conditions were set as follows: U = 70 V, P < 0.5 W for 4 h, water cooling to prevent heating. The gel was stained with ethidium bromide.
CD spectroscopy
CD spectra were recorded with a JASCO spectropolarimeter J-810. Acquisition parameters were set as follows: spectral width 300–200 nm, scanning speed 50 nm/min, bandwidth 2 nm, temperature 10°C. RNA concentration was adjusted to 25 µM. Buffer conditions: 15 mM KxHy(PO4), 25 mM KCl, pH 6.5. CD melting curves were recorded with a temperature slope of 1°C/min at a wavelength of 258 nm between 10 and 90°C. CD-refolding curves were recorded with a temperature slope of –1°C/min starting from 90 to 10°C. The CD melting curves were fitted according to Hill’s equation:
| (1) |
where Tm is the melting temperature of the RNA, a the amplitude, T the temperature and b the Hill coefficient. The Hill coefficient is a measure for the cooperativity of the RNA unfolding transition. High Hill coefficients go together with sharp unfolding transitions while low Hill coefficients indicate a gradual transition from the folded to the unfolded conformation. The CD melting curves were normalized and fitted according to Equation (1).
Imino proton exchange rate analysis
Pseudo 3D Inversion recovery spectra were analyzed with Sparky 3.1.1.3. The intensities of the imino signals of each 2D-1H-15N-slide were plotted against the inversion recovery delay τm and fitted to the following Equation (2):
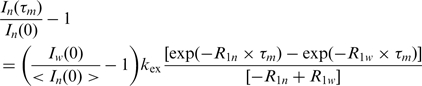 |
(2) |
In(τm) represents the intensity of the imino proton at time point τm, whereas In(0) represents the intensity of the imino proton at time point τm = 0. Iw(0) corresponds to the intensity of the water signal normalized to the number of water protons within the sample and <In(0)> corresponds to the intensity of an individual imino proton species at time point τm = 0 normalized to the number of protons of that species within the NMR sample. Assuming that the 180° RE-BURP pulse completely inverts the water magnetization and leaves the imino magnetization in z orientation, Iw(0)/<In(0)> can be set to –1. R1w corresponds to the R1 relaxation rate of the water signal, R1n corresponds to the R1 relaxation rate of the imino protons and kex represents the exchange rate between the imino protons and the bulk water. The data points were fitted by Equation (2), while R1n, R1w and kex were allowed to adjust freely.
Imino protons of nucleobases in RNA oligonucleotides are protected from chemical exchange with the bulk water as long as they are hydrogen-bonded. Usually this is the case, if nucleobases are located within an RNA double-helix. However, the nucleobases undergo base-pair opening events, even when the helix is stable. As long as the nucleobase resides in the open conformation the imino proton is no longer hydrogen bonded and chemical exchange with the bulk solvent H2O can occur. Most often, exchange with water is catalyzed by other compounds within the buffer solution. In general, every compound which has the capability to accept protons can act as catalyst of the proton exchange reaction. In particular, buffer substances including TRIS, HEPES, MES and phosphate can act as exchange catalyst. Since the NMR buffer we use contains 15 mM KxHyPO4 (pH 6.5) the exchange rate is predominantly determined by and proportional to the concentration of the  ions.
ions.
In order to estimate the imino proton exchange rate kex,open in the open conformation, the exchange rates of model compounds that resemble the open conformation kex,UTP(GTP) have to be measured in NMR buffer in a temperature dependent way. For this purpose the dependence of the imino exchange rates on temperature kex,UTP(GTP)(T) was determined for UTP and GTP NMR samples (sample composition: Supplementary Data, ‘Materials and Methods’ section, Determination of mononucleotide imino proton exchange rates). This temperature dependence can be interpreted in terms of the Eyring formalism according to:
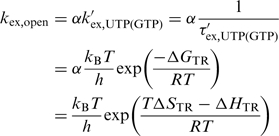 |
(3) |
ΔGTR, ΔSTR and ΔHTR represent parameters describing the transition state of the imino proton exchange process between the imino group and H2O.  represents the diffusion corrected exchange rate of the mononucleotide. Differences in accessibility between the imino proton of the mononucleotide and the imino proton of the nucleobase within the RNA oligonucleotide are expressed by the factor α which was assumed to be temperature independent and close to unity (α = 1) (22).
The exchange process is diffusion controlled. Since UTP and GTP are much smaller than a large RNA molecule, the exchange rates of UTP and GTP have to be corrected by the following formula to account for the difference in diffusion coefficients of RNA and mononucleotide to be applicable to RNA (31):
| (4) |
where Mc is the molecular mass of the catalyst, in this case  (Mc = 80 Da); MRNA the molecular mass of the RNA; and MUTP(GTP) the molecular mass of UTP or GTP.
Considering the base-pair opening event, two extreme sub cases can be distinguished. In the first sub case (EX1 conditions), proton exchange in the open state kex,open is so fast that every time the base pair opens proton exchange to the water will occur. In this case, the kinetic of the exchange process can be described by the following reaction scheme:
| (5) |
In the second sub case (EX2 conditions), the kex,open rate constant is sufficiently slow so that the base pair has to open and close many times on average until proton exchange takes place. If this assumption holds true, equilibrium between the open and the closed state of the base pair can be assumed:
| (6) |
In the latter case, the rate constant kex for the proton exchange reaction can be simplified as follows (20):
| (7) |
where τ0 is the base-pair lifetime; τex, open the exchange time of the open state and Kdiss the equilibrium constant for base-pair opening.
In this work we adjusted the catalyst concentration (HPO4)2– such that imino proton exchange is proportional to the buffer concentration [Figure 1 in (20)] and in the EX2 regime so that Equation (7) can be applied. The equilibrium dissociation constant Kdiss describing the base-pair opening event can be expressed in terms of the Gibbs energy ΔGdiss by
| (8) |
and the exchange time in the open state τex,open can be described in analogy to the Eyring formalism by
| (9) |
By insertion of Equation (8) and Equation (9) into Equation (7) an expression for the proton exchange rate kex can be obtained
| (10) |
Substituting ΔGdiss and ΔGTR in Equation (10) by the corresponding Gibbs–Helmholtz equations
| (11) |
| (12) |
results in Equation (13) which represents an expression describing the dependence of kex on temperature T, the enthalpy and entropy differences ΔHdiss and ΔSdiss of the closed versus the open state of the nucleobase and the enthalpy and entropy values characterizing the transition state of the proton exchange reaction in the open state of the nucleobase ΔHTR and ΔSTR as derived from the exchange measurements performed on UTP and GTP samples.
| (13) |
In terms of sensitivity the inversion recovery method is superior to other available methods to determine proton exchange rates. However, the inversion recovery method is prone to artefacts caused by dipolar cross-relaxation. These effects might result in overestimated exchange rates since magnetization transfer caused by cross relaxation is neglected during the analysis.
However, temperature dependence of the exchange rates allows us to dissect the artefacts from the pure proton exchange rates. This is due to the fact that cross relaxation effects for large macromolecules show either no or slightly negative temperature dependence. In contrast, the pure exchange rates exhibit strong positive temperature dependence. Therefore, it is reasonable to introduce a parameter d into Equation (14) which accounts for cross polarization effects.
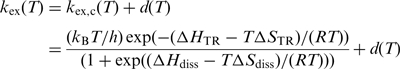 |
(14) |
Equation (14) is used to fit the temperature dependence of the apparent imino exchange rates kex(T) from nucleobases within an RNA oligonucleotide. T is the temperature in Kelvin, kex,c(T) is the corrected imino proton exchange rate without NOE contributions, h is the Planck constant and kB is the Boltzmann constant. ΔHTR and ΔSTR describe the transition state of the imino proton transition from the nucleobase in the open state to the water. These parameters were determined experimentally as described in detail in the Supplementary Data. For uridines the values were determined to be ΔHTR = 38.79 ± 0.64 kJ/mol and TΔSTR = –14.57 ± 1.34 kJ/mol at T = 293.15 K. For guanosines the values were determined to be ΔHTR=38.58 ± 0.54 kJ/mol and TΔSTR = –14.65 ± 1.14 kJ/mol at T = 293.15 K. ΔHdiss and ΔSdiss are the enthalpy and entropy differences between the closed and the open conformation of the nucleobase within the RNA. ΔHdiss, ΔSdiss and d are adjusted in order to minimize the deviation between fitting curve and data points. ΔGdiss(T) can be calculated according to the Gibbs–Helmholtz equation (Equation 11). For larger molecules NOE contributions which are represented by the parameter d in Equation (14) depend on the spectral density at zero frequency J(0) which in turn is proportional to the global rotational correlation time τc. The temperature dependence of τc can be calculated using the temperature dependence of the solvent viscosity which is known. Hence, the temperature dependence of the parameter d(T) can be calculated, if one assumes that no larger structural changes of the RNA occur upon changes in temperature. We assumed the parameter d to be constant over the observed temperature range for the kex(T) analysis of the wildtype (wt) and the mutant RNA which is sufficient to describe the kex(T) dependence of these RNAs. However, there might be cases (other RNAs) in which the temperature dependence of d may become significant e.g. for larger RNA molecules that show stronger NOEs as a consequence of a longer rotational correlation time τc or if the melting is less cooperative so that the observed temperature range becomes larger. In these cases, Equation (15) can be used to incorporate the temperature dependence of d in Equation (14).
| (15) |
Parameters have to be set as follows:
a = 0.8230; b = 0.0505; c = 0.5725; f = 0.0129.
Equation (15) was derived in the Supplementary Data (‘Materials and methods’ section, Theoretically derived temperature dependence of the NOE contributions).
We have treated ΔHdiss and ΔSdiss as being temperature-independent and argue that this assumption is justified for the following reasons. An eventual ΔHdiss(T) dependence would imply a corresponding ΔSdiss(T) dependence because of the universal ΔHdiss(ΔSdiss) correlation (Figure 6A and B). If an eventual ΔHdiss(T) dependence would be large enough to be quantified, it would lead to a significant deviation of the kex(T) curve, which could not be fitted by essentially two parameters plus a dipolar offset anymore. Thus, as long as Equation (14) is sufficient to describe the observed kex(T) dependence, ΔHdiss and ΔSdiss can be considered to be constant.
Figure 6.

(A) Enthalpy–entropy correlation for the base-pair opening event of individual nucleobases in the 4U-hp2-wt RNA. (B) Enthalpy–entropy correlation for the base-pair opening event of individual nucleobases in the 4U-hp2-A8C-mutant RNA. (C) Free energy–entropy correlation for the base-pair opening event of individual nucleobases in the 4U-hp2-wt RNA. (D) Free energy–entropy correlation for the base-pair opening event of individual nucleobases in the 4U-hp2-A8C-mutant RNA. Plots were fitted according to the linear equation f = y0 + mx. Linear fitting results are illustrated within the figures.
RESULTS AND DISCUSSION
NMR assignments
Using 2D NMR experiments, the NMR resonances of the imino hydrogens could be assigned (Figure 2). The imino region observed in the H,N correlation experiment of the 4U-hp2-wt RNA is well resolved and most of the peaks have similar line widths and intensities with the exception of the imino signal of G30 that is broader and weaker (Figure 2A and B). In close proximity to this signal, a couple of other small not assignable signals are present that might belong to additional G30 subpopulations. The resonances of G27 and G28 are not resolved. Upfield of the 15N resonance of G14, four smaller signals are present that belong to G3 and are due to conformational heterogeneity of either the 5′-end or the 3′-end. The assignment of the NMR signals is consistent with the secondary structure reported by Waldminghaus et al. (17) on the basis of in silico m-fold prediction in combination with enzymatic probing experiments. The A7–U32 base pair next to the AG mismatch as well as the loop closing base pair U17–A22 do not give rise to any observable imino signals. Thus, these base pairs are either not present or exhibit a reduced stability.
Figure 2.

(A) Imino region of a 1H-1H-NOESY spectrum recorded on a 4U-hp2-wt RNA sample with a mixing time Tm of 150 ms. Two separate sequential walks are indicated with blue (U4–G6) and green (G30–U23) lines. Assignment labels of cross and diagonal peaks are shown in black. (B) HNN-COSY spectrum recorded on the 4U-hp2-wt RNA. Additionally, the secondary structure of the 4U-hp2-wt RNA is illustrated within the spectrum. Diagonal peaks are given in orange, cross peaks in blue. The corresponding cross and diagonal peaks are connected by dotted lines. (C) Imino region of a 1H-1H-NOESY spectrum recorded on a 4U-hp2-A8C-mutant RNA sample with a mixing time Tm of 150 ms. Sequential walk is indicated in blue. Assignment labels of cross and diagonal peaks are shown in black. (D) HNN-COSY spectrum recorded on the 4U-hp2-A8C-mutant RNA. Additionally, the secondary structure of the 4U-hp2-A8C mutant RNA is illustrated within the spectrum. Diagonal peaks are given in orange, cross peaks in blue. The corresponding cross and diagonal peaks are connected by dotted lines.
Similar to the wt RNA, the imino region of the 1H, 15N-HSQC of the 4U-hp2-A8C-mutant RNA exhibits well resolved and sharp signals of equal size and intensity that could be assigned unambiguously. In contrast to the wt RNA, the G31 nucleobase is base paired in the mutant RNA.
Thus, it is possible to assign an imino signal to the G31 in the spectra of the mutant RNA. Remarkably, the signal of the adjacent nucleobase U32 becomes observable in the spectra of the A8C mutant. In line with this observation, the nucleotide G30 is also stabilized by the newly introduced C8–G31 base pair which results in a smaller and sharper imino signal of the G30 nucleobase. In summary, the C8–G31 base pair in the mutant RNA stabilizes the neighboring base pairs C9–G30 and A7–U32. This stabilizing effect explains the repressed phenotype of the corresponding mutant in vivo (17). The imino proton chemical shifts of the wt RNA and the mutant RNA are given in Supplementary Table S1.
Exchange rates and their temperature dependence determined by NMR
The imino proton exchange rates kex were measured for both RNAs using the inversion recovery method (‘Materials and Methods’ section: inversion recovery experiments). Figure 3A and B show exemplarily 2D slices from the pseudo-3D-inversion recovery experiment recorded at a temperature of 20°C on the wt RNA sample. At short mixing time τm (2 ms), all imino signals had equal sign while for longer mixing times (75 ms) negative signals were observed for rapidly exchanging imino signals. The data points were fitted remarkably well according to Equation (2) to extract the imino exchange rates of the individual nucleobases (Figure 3C). The minimum of the curve becomes deeper and is shifted towards smaller τm values with increasing imino proton exchange rates kex. The kex values of the individual nucleobases exhibit characteristic temperature dependency. For each particular nucleobase, the temperature dependence of the exchange rate kex was fitted to Equation (14) (Figure 3D: solid lines) in order to obtain information about the base-pair stabilities within the RNA helix. Table 1 (wt RNA) and Table 2 (mutant RNA) contain the resulting thermodynamic parameters ΔGdiss, ΔHdiss and ΔSdiss for the individual base-pair opening events.
Figure 3.

1H-15N-2D-slice of the Uracil imino resonances of the 15N-edited inversion recovery experiment recorded on a 4U-hp2-wt RNA sample (A) at a temperature of 20°C and a mixing time of τm = 2 ms. Positive signals are illustrated in orange and (B) at a temperature of 20°C and a mixing time of τm = 75 ms. Positive signals are illustrated in orange, negative signals in blue. (C) Dependence of the intensities of the imino signals U24 (red diamonds), U13 (yellow squares) and G27/G28 (blue triangles) on the mixing time τm. The corresponding fits according to Equation (2) are indicated as solid lines. (D) Temperature dependence of the imino proton exchange rates kex of U24 (red diamonds), U13 (yellow squares) and G27/G28 (blue triangles). The corresponding fits according to Equation (14) are indicated as solid lines.
Table 1.
ΔHdiss, ΔSdiss, T*ΔSdiss (T = 20°C) and ΔGdiss (T = 20°C) for the base pair opening of individual nucleobases within the 4U-hp2-wt RNA
| 4U-hp2-wt | ΔHdiss | ΔΔHdiss | ΔSdiss | ΔΔSdiss | ΔGdiss | ΔΔGdiss | TΔSdiss | TΔΔSdiss |
|---|---|---|---|---|---|---|---|---|
| [kJ/mol] | [kJ/mol] | [J/(mol*K)] | [J/(mol*K)] | [kJ/mol] [T = 20°C] | [kJ/mol] [T = 20°C] | [kJ/mol] [T = 20°C] | [kJ/mol] [T = 20°C] | |
| U23 | 44.61 | 5.34 | 117 | 18 | 10.33 | 0.21 | 34.29 | 5.28 |
| U24 | 116.02 | 2.86 | 339 | 9 | 16.74 | 0.24 | 99.36 | 2.64 |
| G14 | 294.62 | 39.80 | 908 | 129 | 28.61 | 3.12 | 266.13 | 37.81 |
| U13 | 77.06 | 5.12 | 220 | 17 | 12.46 | 0.17 | 64.48 | 4.98 |
| U12 | 57.82 | 1.44 | 155 | 5 | 12.31 | 0.06 | 45.43 | 1.47 |
| G27/G28 | 87.92 | 3.45 | 251 | 11 | 14.35 | 0.14 | 73.57 | 3.22 |
| U11 | 89.03 | 5.35 | 255 | 18 | 14.25 | 0.14 | 74.74 | 5.28 |
| U10 | 123.04 | 10.05 | 358 | 33 | 18.04 | 0.40 | 104.93 | 9.67 |
| G30 | 113.18 | 14.01 | 328 | 46 | 16.91 | 0.78 | 96.14 | 13.48 |
| G31 | – | – | – | – | – | – | – | – |
| U32 | – | – | – | – | – | – | – | – |
| U33 | 68.55 | 5.02 | 201 | 17 | 9.60 | 0.20 | 58.91 | 4.98 |
| G6 | 50.84 | 5.59 | 131 | 19 | 12.55 | 0.18 | 38.40 | 5.57 |
| U5 | – | – | – | – | – | – | – | – |
| U4 | – | – | – | – | – | – | – | – |
ΔΔHdiss, ΔΔSdiss, T*ΔΔSdiss (T = 20°C) and ΔΔGdiss (T = 20°C) represent the experimental errors, respectively.
Table 2.
ΔHdiss, ΔSdiss, T*ΔSdiss (T = 20°C) and ΔGdiss (T = 20°C) for the base pair opening of individual nucleobases within the 4U-hp2-A8C-mutant RNA
| 4U-hp2-A8C-mutant | ΔHdiss | ΔΔHdiss | ΔSdiss | ΔΔSdiss | ΔGdiss | ΔΔGdiss | TΔSdiss | TΔΔSdiss |
|---|---|---|---|---|---|---|---|---|
| [kJ/mol] | [kJ/mol] | [J/(mol*K)] | [J/(mol*K)] | [kJ/mol] [T = 20°C] | [kJ/mol] [T = 20°C] | [kJ/mol] [T = 20°C] | [kJ/mol] [T = 20°C] | |
| U23 | 32.44 | 5.43 | 75 | 18 | 10.56 | 0.20 | 21.98 | 5.28 |
| U24 | 83.54 | 1.84 | 226 | 6 | 17.17 | 0.44 | 66.24 | 1.76 |
| G14 | 265.33 | 11.10 | 775 | 34 | 38.04 | 0.86 | 227.15 | 9.97 |
| U13 | 34.01 | 1.81 | 74 | 6 | 12.250 | 0.15 | 21.69 | 1.76 |
| U12 | 31.45 | 1.44 | 65 | 5 | 12.50 | 0.21 | 19.05 | 1.47 |
| G27/G28 | 70.66 | 7.04 | 182 | 22 | 17.20 | 1.20 | 53.34 | 6.45 |
| U11 | 54.26 | 1.00 | 132 | 3 | 15.60 | 0.09 | 38.69 | 0.88 |
| U10 | 93.41 | 6.66 | 249 | 21 | 20.38 | 5.34 | 72.98 | 6.16 |
| G30 | 167.94 | 10.20 | 476 | 32 | 28.53 | 1.68 | 139.52 | 9.38 |
| G31 | 291.97 | 4.42 | 861 | 14 | 39.51 | 2.77 | 252.36 | 4.10 |
| U32 | 73.24 | 2.12 | 199 | 7 | 14.98 | 0.14 | 58.33 | 2.05 |
| U33 | 75.85 | 1.34 | 206 | 4 | 15.47 | 0.10 | 60.38 | 1.17 |
| G6 | 89.98 | 5.01 | 251 | 16 | 15.59 | 0.38 | 73.57 | 4.69 |
| U5 | 11.08 | 1.34 | 3 | 5 | 10.30 | 0.20 | 0.88 | 1.47 |
| U4 | 21.99 | 2.36 | 36 | 8 | 11.92 | 0.35 | 10.55 | 2.34 |
ΔΔHdiss, ΔΔSdiss, T*ΔΔSdiss (T = 20°C) and ΔΔGdiss (T = 20°C) represent the experimental errors, respectively.
For some nucleobases, we observed deviations of kex(T) from Equation (14) at higher temperatures. However, the correct interpretation of these data is difficult. One possible interpretation would be that these effects are caused by temperature-induced changes in the native state of the RNA fold. Another interpretation would be that cooperative effects accelerate the exchange rate at higher temperatures. In other words, the assumption that the base-pair opening events are uncorrelated might be no longer valid at temperatures near the melting point of the RNA molecule. That deviations are due to changes of the open state is unlikely but cannot be excluded. In principle, these effects could also be examined by the method we propose. However, more data points would be needed to fit the kex(T) dependence to a more complicated model. For that reason only nucleobases for which a temperature dependence of ΔHdiss and ΔSdiss could be excluded were analyzed. Deviations from Equation (14) observed at high temperatures for some nucleobases were not analyzed here.
Thermodynamic stability of the individual nucleobases
Figure 4 summarizes the information on base-pair stabilities of the two RNAs. The diagram on the right hand side of Figure 4A shows the ΔGdiss, ΔHdiss and ΔSdiss*T energies determined for each nucleobase belonging to an observable imino signal. The values represent the differences between the closed (base paired) and the open states. Remarkably, the ΔHdiss and ΔSdiss*T are strongly correlated. ΔHdiss values range from 44.61 kJ/mol (U23) to 294.62 kJ/mol (G14). These large values in ΔHdiss and ΔSdiss*T are of the same order and compensate each other almost entirely. This compensation leads to ΔGdiss values that are one order of magnitude smaller and range from 9.60 kJ/mol (G33) to 28.61 kJ/mol (G14). The resulting ΔGdiss values are correlated to the ΔHdiss and ΔSdiss*T values. Comparison of ΔGdiss values with the secondary structure of the wt RNA reveals that G14 is much more stable than all other nucleobases and involved in key interactions holding the hairpin together.
Figure 4.

(A) Left: free energy representation for the base-pair opening events for the imino resonances belonging to a particular nucleobase of the 4U-hp2-wt-RNA. Red color corresponds to low stability of the closed state with respect to the open state while blue indicates high stability of the closed state in comparison to the open state. Right: diagram representation showing the ΔGdiss (20°C), ΔHdiss, and ΔSdiss*T (20°C) values for the base-pair opening of individual nucleobases of the 4U-hp2-wt RNA (B) Same representation as in (A) for the 4U-hp2-A8C-mutant RNA. (C) Diagram comparing the ΔHdiss and ΔSdiss*T (20°C) values of the 4U-hp2-wt RNA and the 4U-hp2-A8C-mutant RNA. ΔHdiss and ΔSdiss*T (20°C) values are plotted on different scales. 4U-hp2-wt: ΔHdiss (yellow squares), ΔSdiss*T at T = 20°C (red triangles). 4U-hp2-A8C-mutant: ΔHdiss (green circles), ΔSdiss*T at T = 20°C (blue diamonds). (D) Diagram comparing the ΔGdiss (20°C) values of the 4U-hp2-wt RNA (red triangles) and the 4U-hp2-A8C-mutant RNA (blue diamonds).
For the mutant RNA, the ΔHdiss and ΔSdiss*T values are also strongly correlated (Figure 4B). This correlation of ΔHdiss and ΔSdiss*T values leads to a much smaller spread in the ΔGdiss values. G14, G30 and G31, which participate in GC base pairs, are the most stable nucleobases in the mutant. Nucleobases U5 and U4 which are close to the bottom of the helix stem and U17 which is located next to the closing base pair of the loop are unstable. ΔHdiss values in the mutant RNA span a broad range from 11.08 kJ/mol (U5) to 291.97 kJ/mol (G31). The differences in ΔGdiss values are less pronounced and range from 10.3 kJ/mol (U5) to 39.51 kJ/mol (G31). The GC base pairs in A-form helical RNA are significantly more stable than AU and GU base pairs. The values reported here are on the same scale as ΔGdiss values reported by Huang et al. (36) at 10°C for DNA–RNA hybrids but span a broader range which might be due to deviations from A-form helical structure in the hairpin 2 of the fourU RNA thermometer. In addition, Chen et al. (26) determined ΔGdiss values at 10°C for the Sarcin-Ricin Domain (SRD) RNA to lay in between 11.97 and 44.26 kJ/mol. The base-pair stabilities determined previously on RNA hairpins and RNA–DNA hybrids are in agreement with our results.
Figure 4C and D compare ΔHdiss, ΔSdiss*T and ΔGdiss values, respectively, of the RNAs. The nucleobases between U23 and U10 exhibit similar behavior, in other words enthalpy values of wt and mutant are correlated as well as the entropy values of both RNAs (Figure 4C). Surprisingly, the magnitudes of the ΔHdiss and the ΔSdiss*T values are higher in the wt than in the mutant RNA. This observation does, however, not result in higher ΔGdiss values in the wt RNA (Figure 4D). The higher stabilizing enthalpy contributions in the wt RNA are overcompensated by unfavorable entropy contributions. Major differences in both RNAs appear next to the A8–G31 mismatch which is substituted by a C8–G31 base pair in the mutant. In particular, G30 in the wt RNA exhibits a reduced stability in comparison to the mutant RNA which is most probably due to a destabilizing neighboring effect of the A8–G31 mismatch in the wt RNA (Figure 4D). This effect is caused by smaller ΔHdiss values which are not completely compensated by smaller ΔSdiss*T values resulting in greatly diminished ΔGdiss values for the wt RNA in comparison to the mutant RNA. In line with this observation, U32 does not give rise to an observable imino signal in the wt but in the mutant RNA, which indicates reduced stability of the A7–U32 base pair in the wt caused by the neighboring A8–G31 mismatch. Finally, the nucleobases of the following G6–U33 base pair also reveal reduced stability in the wt RNA. Taken together, the reduced stability of the wt RNA is caused by the A8–G31 mismatch, which further destabilizes the neighboring base pairing interactions. The G14–C25 base pairing interaction is significantly less stable in the wt than in the mutant RNA. Although the exact mechanism is not apparent, it is tempting to speculate that this is due to remote effects that are caused by the A8–G31 mismatch and transduced through the A-form helix up to the G14–C25 base pair to permit melting of the structure at physiological growth temperatures.
The unfolding transition of the RNA thermometer
Unfolding of the wt RNA (Figure 5B) and the mutant RNA (Figure 5D) was analyzed by CD spectroscopy. The CD melting curves indicate a melting point Tm of 41.1°C and 53.5°C for wt RNA and mutant RNA, respectively. From the obtained ΔHdiss and ΔSdiss values for the individual base-pair opening processes, ΔGdiss values can be calculated according to the Gibbs–Helmholtz equation [Equation (11)]. These calculated ΔGdiss values can be extrapolated to temperatures above the melting temperature. The ΔGdiss(T) dependence was calculated for wt RNA (Figure 5A) and mutant RNA (Figure 5C) for individual nucleobases. Strikingly, the ΔGdiss(T) curves for the individual nucleobases exhibit an intersection point which exactly coincides with the Tm values derived from the CD melting curves. This observation holds true for the wt (Figure 5A and B) as well as for the mutant RNA (Figure 5C and D). The data indicate that the RNA molecule is not unfolding until all nucleotides have approximately the same ΔGdiss stabilities (Figure 5A and C). Thus, even single stable base pairing interactions such as G14–C25 are able to prevent the RNA helix from unfolding. This observation raises the question on the extent of cooperativity of the unfolding transition.
Figure 5.

(A) ΔGdiss(T) for the base-pair opening event of individual nucleobases in the 4U-hp2-wt RNA. ΔGdiss(T) values are derived from the corresponding ΔHdiss and ΔSdiss values according to the Gibbs–Helmholtz equation (Equation 11) and are extrapolated to higher temperatures. Additionally, the melting point Tm of the 4U-hp2-wt-RNA according to the CD melting curve is indicated. (B) The CD melting curve of the 4U-hp2-wt RNA recorded at a wavelength of 258 nm is depicted as red line. Second derivative of the CD melting curve is shown as blue line. (C) Same representation as (A) but for the 4U-hp2-A8C-mutant RNA (D) Same representation as (B) but for the 4U-hp2-A8C-mutant RNA.
Cooperativity of global unfolding processes can be determined from CD melting curves which exhibit a pronounced sigmoidal shape. Thus, the normalized CD curve of the wt RNA can be fitted to Equation (1) with a Hill coefficient b = 10.6, while the CD curve of the mutant RNA results in a Hill coefficient of b = 18.6. The A8–G31 mismatch in the wt RNA dramatically reduces the cooperativity of the unfolding transition. In general, mismatches or bulges reduce the cooperativity of the unfolding transition of an RNA helix while the melting point increases with an increasing GC content. During evolution, mismatches or bulges as well as GC content might be tuned in a way to find the right balance between on/off switch and dimmer-like temperature dependent induction of gene expression. For example, for a physiologically required melting temperature, a long helix comprised of AU or GU base pairs without mismatch would exhibit a switch-like temperature characteristic while a shorter helix with a high GC-content and additional mismatches would result in a dimmer-like temperature response.
According to the study of Searle and Williams (46) the free energy of helix unfolding ΔGhelix can be approximated by Equation (16)
| (16) |
ΔHstacking is the stacking enthalpy and ΔSrotation represents the entropy loss due to rotational restriction mainly of the phosphodiester backbone upon secondary structure formation. At the melting point Tm the loss in stacking interaction is exactly compensated by the gain of rotational freedom so that both conformations have equal stability (ΔGhelix = 0). Considering the unfolding of a helix consisting of ‘n’ base pairs (2n nucleobases), complete unfolding is accompanied with the loss of ‘2n – 2’ stacking interactions, which is approximately one stacking interaction enthalpy per nucleobase involved.
We argue that during the uncorrelated base-pair opening the backbone stays in its A-form helical geometry for the following reasons: a distorted backbone geometry would destabilize the neighboring base pairs. This distortion is the likely reason why other backbone geometries are thermodynamically unfavourable. In addition, there are also kinetic reasons why changes in backbone conformation are unable to occur. Lifetimes of the open state are usually in the range of τopen = 1–10 ns (22). Changes in backbone conformation have been reported to be on the timescale of tens of nanoseconds for ss dinucleotides in the stacked conformation (47) and are supposed to be even slower in a ds RNA molecule (47). In other words, the nucleobase is already back in the closed conformation before a conformational change of the backbone can occur. Therefore, we argue that the entropic contribution of rotation to the uncorrelated base-pair opening is ΔSrotation ≈ 0, leaving only the stacking interaction ΔGstacking as predominant solute–solute interaction, which in turn is determined by enthalpic interactions ΔGstacking ≈ ΔHstacking.
Although the exact nature of the exchange competent state is unclear, some properties of this state are known. The imino proton has to be directly accessible to the catalyst. In this study, phosphate was used as a catalyst but also substances that are much more bulky e.g. TRIS, triethanolamine or imidazole have been shown to catalyze the exchange of the imino protons in RNA very efficiently (20). Thus, the imino protons have to be exposed to the surface of the RNA in the open state, which can only be explained with a considerable dislocation of the nucleobase into the major groove. This dislocation most probably destroys the stacking interactions to the neighboring nucleobases but at least weakens them considerably. Thus, we propose that for the uncorrelated base-pair opening in an A-form ds RNA, two stacking interactions are lost or extremely weakened (≈2ΔHstacking), while during the global unfolding process only one stacking interaction per base is lost (≈ΔHstacking).
Notably, the intersection point (Figure 5A and C) is at ΔGdiss(T) values of ∼10 kJ/mol. In other words, at the melting point Tm the open state of the uncorrelated base-pair opening is less stable than the closed state. Intuitively, one would expect equal stabilities for the open and the closed state at the melting point. This apparent contradiction can be resolved by taking the stacking interaction of the nucleobases into account. The uncorrelated base-pair opening observed at lower temperatures is accompanied with the loss of approximately two stacking interactions (as discussed above). However, the situation is different if one considers the cooperative unfolding process of the RNA hairpin. If the neighboring nucleobase resides in the open conformation the closed conformation is destabilized due to the missing stacking interaction. Thus, base-pair opening in this intermediate state is accompanied with the loss of only a single stacking interaction. Accordingly, the stacking interactions between the nucleobases within an RNA helix cause the observed cooperativity of a global consecutive zipper-type unfolding process (48).
Former studies performed on single stranded RNA and DNA oligonucleotides including poly(A), poly(C) and poly (dA) yield ΔHstacking values between 33 and 39 kJ/mol (46,49). These values are compensated by ΔSstacking values between 31.3 and 39.6 J/(mol K). In mixed-sequence DNA oligomers, however, the mean stacking enthalpy per nucleobase is reduced to ΔHstacking 9.5–10.2 kJ/mol and the mean stacking entropy ΔSstacking is reduced to 9.1–10.1 J/(mol K) (46,50). Entropy loss upon stacking is caused by loss of rotational freedom of the sugar-phosphate backbone in the single stranded oligonucleotide.
If one assumes that upon base-pair opening the sugar phosphate backbone of an RNA double strand resides in the A-form conformation (as discussed above), the entropy term ΔSstacking between open and closed conformation becomes close to zero. In this case, ΔGstacking is dominated by ΔHstacking and therefore quantifies to ∼9.5–10.2 kJ/mol. Thus, we conclude that the ordinate intercept at the intersection point (Figure 5A and C) indicates the mean free stacking energy per base, ΔGdiss(Tm) ≈ ΔGstacking ≈ ΔHstacking, which is ∼10 kJ/mol.
Enthalpy–entropy correlations and implications
Figure 6A and B shows the enthalpy–entropy correlations for the base-pair-opening events for wt RNA and mutant RNA, respectively. Apparently, ΔHdiss and ΔSdiss reveal a strictly linear correlation in both RNAs. It can be shown that the observed ΔHdiss(ΔSdiss) correlations are not an artifact due to error compensation (51). A statistical test is provided in the Supplementary Data. In addition, ΔGdiss and ΔHdiss values are also correlated linearly in both RNAs, although this correlation is not as strict (Figure 6C and D). The correlation plots (Figure 6C and D) are presented for a temperature of 20°C. The slope of the correlation is dependent on the temperature and becomes zero at T = m, as can be derived from Equation (17).
Correlation of ΔHdiss and ΔSdiss has some important implications. In particular, it leads to the following equation
| (17) |
where m is the slope of the ΔHdiss and ΔSdiss correlation (Figure 6A and B), T is the temperature and y0 is the ordinate intercept. It follows from this equation that at the temperature T = m due to the correlation between ΔHdiss and ΔSdiss, all ΔGdiss values have the same value equal to y0 (Figure 5A and C). A comparison with the corresponding CD melting curves reveals that this temperature is very similar to the melting temperature of the RNA (Figure 5B and D). For the wt RNA, the slope is m = 316 ± 2.1 K and the melting temperature is Tm = 314.3 K and for the mutant RNA, m = 329.6 ± 1.5 K and Tm = 326.7 K. Linear ΔHdiss (ΔSdiss) correlations have been reported previously for base-pair opening events in DNA duplexes (52,53). Chen et al. determined a slope of m = 306 K for the linear ΔHdiss and ΔSdiss correlation on a 12mer duplex DNA.
Enthalpy–entropy compensation (EEC) is a well-known principle which occurs in a variety of chemical and biochemical reactions (54). In addition, the characteristic that enthalpy and entropy are correlated linearly is a feature which has been described for many systems, among others for the unfolding of proteins and nucleic acids (55). It is commonly assumed that the linear correlation is a ubiquitous property of water and that the slope of the correlation is determined by solvation contributions while the ordinate intercept contains interactions other than those with H2O (54). Accordingly, the ordinate intercept of the ΔHdiss (ΔSdiss) correlations can be interpreted as the mean stacking free energy per nucleobase. We can write ΔGdiss (Tm) ≈ ΔGstacking ≈ ΔHstacking ≈ y0 (as discussed above). With 8.33 ± 0.75 kJ/mol (wt RNA) and 9.29 ± 0.51 kJ/mol (mutant RNA), the y0 values fit remarkably well to the ΔGstacking energies derived from RNA unfolding studies (46).
In general, the open state of a nucleobase exhibits a higher entropy and a lower enthalpy than the base-paired state. Interestingly, this effect is much more pronounced for GC base pairs than for AU base pairs. In fact, such high enthalpy and entropy values can only be explained by solvation effects. Base-pair opening seems to release highly ordered water molecules from the major groove, thereby increasing the entropy and reducing the enthalpy of the solvent.
The importance of solvent–solute interactions for RNA folding has been investigated in previous studies. Auffinger and Westhof (56) performed MD simulations at 5, 25 and 37°C and investigated the residence times of the water molecules in the first hydration shell. They found that the number of water molecules in the first hydration shell reduces from 22 (5°C) to 17 (37°C) while the residence times reduce from 1 ns (5°C) to 0.5 ns (37°C). At the same time, the RNA fold remains almost unchanged.
Figure 5A and C show the ΔGdiss(T) dependence which is influenced by solute–solvent interactions. We refer to Rufus et al. (54) who provided evidence that the slope of the ΔHdiss(ΔSdiss) correlation is determined by solute–solvent interactions while the ordinate intercept contains solute–solute interactions. According to Equation (17), the solute–solvent interactions stabilize the closed conformation of the nucleobase. This stabilization can be explained by thermodynamically favourable ΔHdiss contributions that overweigh the unfavourable TΔSdiss contributions at low temperatures. This stabilizing effect on ΔGdiss decreases linearly until it vanishes completely at T = m. At this temperature, the stabilizing ΔHdiss contributions and destabilizing TΔSdiss contributions cancel each other.
In agreement with Auffinger and Westhof (56), who detected a change in the RNA–solvent interaction before melting of the RNA, we observed a weakening of the RNA–solvent interaction before melting of the RNA strand by looking at the ΔGdiss(T) dependence. This weakening is found to be already present at low temperatures and is linearly correlated with the temperature. We found that the investigated RNAs melt when the stabilizing RNA–solvent interaction has vanished completely. In other words, melting of the water in the hydration shell is a prerequisite for the melting of the RNA.
At the point T = m, hydration of the RNA has neither stabilizing nor destabilizing effects. Thus, at T = m the stability of the RNA is determined by interactions within the RNA (solute–solute interactions). These interactions are dominated by the stacking interactions ΔHstacking between neighboring nucleobases. As discussed above, these stacking interactions are responsible for the cooperativity of the unfolding transition, especially in cases where other relevant interactions including the RNA–solvent interaction cancel (at T = m).
Interestingly, the A8C point mutation changes the slope of the linear ΔHdiss(ΔSdiss) correlation. As a consequence, all other nucleotides within the RNA helix experience the changes in the slope and change their ΔHdiss and ΔSdiss values according to the altered ΔHdiss(ΔSdiss) correlation. Thus, these remote effects like the reduced stability of G14–C25 in the wt in comparison to the mutant RNA have to be transduced by the hydration shell of the RNA, if one assumes that the slope is determined by solvation effects.
Using a combination of NMR spectroscopy and CD spectroscopy it was possible to describe the temperature dependent characteristics of the temperature labile second helix of the Salmonella FourU RNA thermometer and its corresponding temperature stable A8C mutant. Determination of the individual base-pair stabilities of the two investigated RNA oligonucleotides at lower temperatures allows the prediction of their melting points at higher temperatures. Our results are consistent with the in vivo phenotypes of the wt and the mutant RNA (17). We could show that the temperature dependent behavior of the two RNAs relies on basic biophysical principles which determine RNA helical stability in aqueous solutions in general. Linear ΔHdiss(ΔSdiss) correlations are the reason, why base pairs have equal stabilities at a defined temperature (T = m) which is identical to the slope of the corresponding ΔHdiss(ΔSdiss) correlation. This temperature coincides with the melting temperature since the global unfolding of an RNA helix is a cooperative process for which equal stability of the base pairs within the helix is a prerequisite.
SUPPLEMENTARY DATA
Supplementary Data are available at NAR Online.
ACKNOWLEDGEMENT
The authors dedicate the paper to Prof. H. Rueterjans on the occasion of his 70th birthday.
FUNDING
State of Hesse (Center for Biomolecular Magnetic Resonance, BMRZ); Deutsche Forschungsgemeinschaft (DFG) (priority program SPP 1258: Sensory and regulatory RNAs in prokaryotes). H.S. is member of the Cluster of Excellence: Macromolecular complexes. Funding for open access charges: DFG.
Conflict of interest statement. None declared.
REFERENCES
- 1.Bocobza SE, Aharoni A. Switching the light on plant riboswitches. Trends Plant Sci. 2008;13:526–533. doi: 10.1016/j.tplants.2008.07.004. [DOI] [PubMed] [Google Scholar]
- 2.Sudarsan N, Barrick JE, Breaker RR. Metabolite-binding RNA domains are present in the genes of eukaryotes. RNA. 2003;9:644–647. doi: 10.1261/rna.5090103. [DOI] [PMC free article] [PubMed] [Google Scholar]
- 3.Croft MT, Moulin M, Webb ME, Smith AG. Thiamine biosynthesis in algae is regulated by riboswitches. Proc. Natl Acad. Sci. USA. 2007;104:20770–20775. doi: 10.1073/pnas.0705786105. [DOI] [PMC free article] [PubMed] [Google Scholar]
- 4.Sharp PA. The centrality of RNA. Cell. 2009;136:577–580. doi: 10.1016/j.cell.2009.02.007. [DOI] [PubMed] [Google Scholar]
- 5.Waters LS, Storz G. Regulatory RNAs in bacteria. Cell. 2009;136:615–628. doi: 10.1016/j.cell.2009.01.043. [DOI] [PMC free article] [PubMed] [Google Scholar]
- 6.Narberhaus F, Vogel J. Regulatory RNAs in prokaryotes: here, there and everywhere. Mol. Microbiol. 2009;74:261–269. doi: 10.1111/j.1365-2958.2009.06869.x. [DOI] [PubMed] [Google Scholar]
- 7.Dambach MD, Winkler WC. Expanding roles for metabolite-sensing regulatory RNAs. Curr. Opin. Microbiol. 2009;12:161–169. doi: 10.1016/j.mib.2009.01.012. [DOI] [PMC free article] [PubMed] [Google Scholar]
- 8.Serganov A. The long and the short of riboswitches. Curr. Opin. Struct. Biol. 2009;19:251–259. doi: 10.1016/j.sbi.2009.02.002. [DOI] [PMC free article] [PubMed] [Google Scholar]
- 9.Roth A, Breaker RR. The structural and functional diversity of metabolite-binding riboswitches. Ann. Rev. Biochem. 2009;78:305–334. doi: 10.1146/annurev.biochem.78.070507.135656. [DOI] [PMC free article] [PubMed] [Google Scholar]
- 10.Montange RK, Batey RT. Riboswitches: emerging themes in RNA structure and function. Ann. Rev. Biophys. 2008;37:117–133. doi: 10.1146/annurev.biophys.37.032807.130000. [DOI] [PubMed] [Google Scholar]
- 11.Schwalbe H, Buck J, Fürtig B, Noeske J, Wöhnert J. Structures of RNA switches: insight into molecular recognition and tertiary structure. Angewandte Chemie. 2007;46:1212–1219. doi: 10.1002/anie.200604163. [DOI] [PubMed] [Google Scholar]
- 12.Narberhaus F, Waldminghaus T, Chowdhury S. RNA thermometers. FEMS Microbiol. Rev. 2006;30:3–16. doi: 10.1111/j.1574-6976.2005.004.x. [DOI] [PubMed] [Google Scholar]
- 13.Waldminghaus T, Fippinger A, Alfsmann J, Narberhaus F. RNA thermometers are common in alpha- and gamma-proteobacteria. Biol. Chem. 2005;386:1279–1286. doi: 10.1515/BC.2005.145. [DOI] [PubMed] [Google Scholar]
- 14.Nocker A, Hausherr T, Balsiger S, Krstulovic NP, Hennecke H, Narberhaus F. A mRNA-based thermosensor controls expression of rhizobial heat shock genes. Nucleic Acids Res. 2001;29:4800–4807. doi: 10.1093/nar/29.23.4800. [DOI] [PMC free article] [PubMed] [Google Scholar]
- 15.Balsiger S, Ragaz C, Baron C, Narberhaus F. Replicon-specific regulation of small heat shock genes in Agrobacterium tumefaciens. J. Bacteriol. 2004;186:6824–6829. doi: 10.1128/JB.186.20.6824-6829.2004. [DOI] [PMC free article] [PubMed] [Google Scholar]
- 16.Chowdhury S, Maris C, Allain FH, Narberhaus F. Molecular basis for temperature sensing by an RNA thermometer. EMBO J. 2006;25:2487–2497. doi: 10.1038/sj.emboj.7601128. [DOI] [PMC free article] [PubMed] [Google Scholar]
- 17.Waldminghaus T, Heidrich N, Brantl S, Narberhaus F. FourU: a novel type of RNA thermometer in Salmonella. Mol. Microbiol. 2007;65:413–424. doi: 10.1111/j.1365-2958.2007.05794.x. [DOI] [PubMed] [Google Scholar]
- 18.Waldminghaus T, Kortmann J, Gesing S, Narberhaus F. Generation of synthetic RNA-based thermosensors. Biol. Chem. 2008;389:1319–1326. doi: 10.1515/BC.2008.150. [DOI] [PubMed] [Google Scholar]
- 19.Neupert J, Karcher D, Bock R. Design of simple synthetic RNA thermometers for temperature-controlled gene expression in Escherichia coli. Nucleic Acids Res. 2008;36:e124. doi: 10.1093/nar/gkn545. [DOI] [PMC free article] [PubMed] [Google Scholar]
- 20.Gueron M, Leroy JL. Studies of base pair kinetics by NMR measurement of proton exchange. Methods Enzymol. 1995;261:383–413. doi: 10.1016/s0076-6879(95)61018-9. [DOI] [PubMed] [Google Scholar]
- 21.Russu IM. Probing site-specific energetics in proteins and nucleic acids by hydrogen exchange and nuclear magnetic resonance spectroscopy. Methods Enzymol. 2004;379:152–175. doi: 10.1016/S0076-6879(04)79009-6. [DOI] [PubMed] [Google Scholar]
- 22.Snoussi K, Leroy JL. Imino proton exchange and base-pair kinetics in RNA duplexes. Biochemistry. 2001;40:8898–8904. doi: 10.1021/bi010385d. [DOI] [PubMed] [Google Scholar]
- 23.Lee JH, Jucker F, Pardi A. Imino proton exchange rates imply an induced-fit binding mechanism for the VEGF165-targeting aptamer, Macugen. FEBS Lett. 2008;582:1835–1839. doi: 10.1016/j.febslet.2008.05.003. [DOI] [PMC free article] [PubMed] [Google Scholar]
- 24.Lee JH, Pardi A. Thermodynamics and kinetics for base-pair opening in the P1 duplex of the Tetrahymena group I ribozyme. Nucleic Acids Res. 2007;35:2965–2974. doi: 10.1093/nar/gkm184. [DOI] [PMC free article] [PubMed] [Google Scholar]
- 25.Dupont JA, Snoussi K. Mg(2+) modulation of EMCV IRES key activity fragment equilibria and r(G.C) base-pair kinetics. J. Biol. Phys. 2009;35:231–243. doi: 10.1007/s10867-009-9151-2. [DOI] [PMC free article] [PubMed] [Google Scholar]
- 26.Chen C, Jiang L, Michalczyk R, Russu IM. Structural energetics and base-pair opening dynamics in sarcin-ricin domain RNA. Biochemistry. 2006;45:13606–13613. doi: 10.1021/bi060908n. [DOI] [PubMed] [Google Scholar]
- 27.Vermeulen A, McCallum SA, Pardi A. Comparison of the global structure and dynamics of native and unmodified tRNAval. Biochemistry. 2005;44:6024–6033. doi: 10.1021/bi0473399. [DOI] [PubMed] [Google Scholar]
- 28.Nonin S, Jiang F, Patel DJ. Imino proton exchange and base-pair kinetics in the AMP-RNA aptamer complex. J. Mol. Biol. 1997;268:359–374. doi: 10.1006/jmbi.1997.0986. [DOI] [PubMed] [Google Scholar]
- 29.Leroy JL, Kochoyan M, Huynh-Dinh T, Gueron M. Characterization of base-pair opening in deoxynucleotide duplexes using catalyzed exchange of the imino proton. J. Mol. Biol. 1988;200:223–238. doi: 10.1016/0022-2836(88)90236-7. [DOI] [PubMed] [Google Scholar]
- 30.Kochoyan M, Leroy JL, Gueron M. Proton exchange and base-pair lifetimes in a deoxy-duplex containing a purine-pyrimidine step and in the duplex of inverse sequence. J. Mol. Biol. 1987;196:599–609. doi: 10.1016/0022-2836(87)90036-2. [DOI] [PubMed] [Google Scholar]
- 31.Leroy JL, Gao XL, Gueron M, Patel DJ. Proton exchange and internal motions in two chromomycin dimer-DNA oligomer complexes. Biochemistry. 1991;30:5653–5661. doi: 10.1021/bi00237a003. [DOI] [PubMed] [Google Scholar]
- 32.Wärmländer S, Sen A, Leijon M. Imino proton exchange in DNA catalyzed by ammonia and trimethylamine: evidence for a secondary long-lived open state of the base pair. Biochemistry. 2000;39:607–615. doi: 10.1021/bi991863b. [DOI] [PubMed] [Google Scholar]
- 33.Leroy JL, Charretier E, Kochoyan M, Gueron M. Evidence from base-pair kinetics for two types of adenine tract structures in solution: their relation to DNA curvature. Biochemistry. 1988;27:8894–8898. doi: 10.1021/bi00425a004. [DOI] [PubMed] [Google Scholar]
- 34.Gonzalez C, Stec W, Kobylanska A, Hogrefe RI, Reynolds M, James TL. Structural study of a DNA.RNA hybrid duplex with a chiral phosphorothioate moiety by NMR: extraction of distance and torsion angle constraints and imino proton exchange rates. Biochemistry. 1994;33:11062–11072. doi: 10.1021/bi00203a002. [DOI] [PubMed] [Google Scholar]
- 35.Maltseva TV, Zarytova VF, Chattopadhyaya J. Base-pair exchange kinetics of the imino and amino protons of the 3′-phenazinium tethered DNA-RNA duplex, r(5′GAUUGAA3′):d(5′TCAATC3′-Pzn), and their comparison with those of B-DNA duplex. J. Biochem. Biophys. Methods. 1995;30:163–177. doi: 10.1016/0165-022x(94)00075-o. [DOI] [PubMed] [Google Scholar]
- 36.Huang Y, Chen C, Russu IM. Dynamics and stability of individual base pairs in two homologous RNA-DNA hybrids. Biochemistry. 2009;48:3988–3997. doi: 10.1021/bi900070f. [DOI] [PMC free article] [PubMed] [Google Scholar]
- 37.Jeener J, Meier BH, Bachmann P, Ernst RR. Investigation of exchange processes by two-dimensional NMR spectroscopy. J. Chem. Phys. 1979;71:4546–4553. [Google Scholar]
- 38.Piotto M, Saudek V, Sklenar V. Gradient-tailored excitation for single-quantum NMR spectroscopy of aqueous solutions. J. Biomol. NMR. 1992;2:661–665. doi: 10.1007/BF02192855. [DOI] [PubMed] [Google Scholar]
- 39.Shaka AJ, Barker PB, Freeman RJ. Computer-optimized decoupling scheme for wideband applications and low-level operation. J. Magn. Reson. 1985;64:547–552. [Google Scholar]
- 40.Jahnke W, Baur M, Gemmecker G, Kessler H. Improved accuracy of NMR structures by a modified NOESY-HSQC experiment. J. Magn. Reson. Ser. B. 1995;106:86–88. [Google Scholar]
- 41.Bodenhausen G, Ruben DJ. Natural abundance nitrogen-15 NMR by enhanced heteronuclear spectroscopy. Chem. Phys. Lett. 1980;69:185–189. [Google Scholar]
- 42.Sklenar V, Piotto M, Leppik R, Saudek V. Gradient-tailored water suppression for 1H-15N HSQC experiments optimized to retain full sensitivity. J. Magn. Reson. Ser. A. 1993;102:241–245. [Google Scholar]
- 43.Dingley AJ, Nisius L, Cordier F, Grzesiek S. Direct detection of N-H[…]N hydrogen bonds in biomolecules by NMR spectroscopy. Nat. Protocols. 2008;3:242–248. doi: 10.1038/nprot.2007.497. [DOI] [PubMed] [Google Scholar]
- 44.Morris GA, Freeman R. Selective excitation in Fourier transform nuclear magnetic resonance. J. Magn. Reson. 1978;29:433–462. doi: 10.1016/j.jmr.2011.08.031. [DOI] [PubMed] [Google Scholar]
- 45.Stoldt M, Wöhnert J, Ohlenschläger O, Görlach M, Brown LR. The NMR structure of the 5S rRNA E-domain-protein L25 complex shows preformed and induced recognition. EMBO J. 1999;18:6508–6521. doi: 10.1093/emboj/18.22.6508. [DOI] [PMC free article] [PubMed] [Google Scholar]
- 46.Searle MS, Williams DH. On the stability of nucleic acid structures in solution: enthalpy-entropy compensations, internal rotations and reversibility. Nucleic Acids Res. 1993;21:2051–2056. doi: 10.1093/nar/21.9.2051. [DOI] [PMC free article] [PubMed] [Google Scholar]
- 47.Vokacova Z, Budesinsky M, Rosenberg I, Schneider B, Sponer J, Sychrovsky V. Structure and dynamics of the ApA, ApC, CpA, and CpC RNA dinucleoside monophosphates resolved with NMR scalar spin–spin couplings. J. Phys. Chem. 2009;113:1182–1191. doi: 10.1021/jp809762b. [DOI] [PubMed] [Google Scholar]
- 48.Chen SJ, Dill KA. RNA folding energy landscapes. Proc. Natl Acad. Sci. USA. 2000;97:646–651. doi: 10.1073/pnas.97.2.646. [DOI] [PMC free article] [PubMed] [Google Scholar]
- 49.Dewey TG, Turner DH. Laser temperature-jump study of stacking in adenylic acid polymers. Biochemistry. 1979;18:5757–5762. doi: 10.1021/bi00593a002. [DOI] [PubMed] [Google Scholar]
- 50.Vesnaver G, Breslauer KJ. The contribution of DNA single-stranded order to the thermodynamics of duplex formation. Proc. Natl Acad. Sci. USA. 1991;88:3569–3573. doi: 10.1073/pnas.88.9.3569. [DOI] [PMC free article] [PubMed] [Google Scholar]
- 51.Sharp K. Entropy-enthalpy compensation: fact or artifact? Protein Sci. 2001;10:661–667. doi: 10.1110/ps.37801. [DOI] [PMC free article] [PubMed] [Google Scholar]
- 52.Folta-Stogniew E, Russu IM. Sequence dependence of base-pair opening in a DNA dodecamer containing the CACA/GTGT sequence motif. Biochemistry. 1994;33:11016–11024. doi: 10.1021/bi00202a022. [DOI] [PubMed] [Google Scholar]
- 53.Chen C, Russu IM. Sequence-dependence of the energetics of opening of AT basepairs in DNA. Biophys. J. 2004;87:2545–2551. doi: 10.1529/biophysj.104.045179. [DOI] [PMC free article] [PubMed] [Google Scholar]
- 54.Rufus L, Shyamala R. Enthalpy-entropy compensation phenomena in water solutions of proteins and small molecules: A ubiquitous property of water. Biopolymers. 1970;9:1125–1227. doi: 10.1002/bip.1970.360091002. [DOI] [PubMed] [Google Scholar]
- 55.Strazewski P. Thermodynamic correlation analysis: hydration and perturbation sensitivity of RNA secondary structures. J. Am. Chem. Soc. 2002;124:3546–3554. doi: 10.1021/ja016131x. [DOI] [PubMed] [Google Scholar]
- 56.Auffinger P, Westhof E. Melting of the solvent structure around a RNA duplex: a molecular dynamics simulation study. Biophys. Chem. 2002;95:203–210. doi: 10.1016/s0301-4622(01)00257-5. [DOI] [PubMed] [Google Scholar]
Associated Data
This section collects any data citations, data availability statements, or supplementary materials included in this article.