

Abstract
Deciphering transcription factor networks from microarray data remains difficult. This study presents a simple method to infer the regulation of transcription factors from microarray data based on well-characterized target genes. We generated a catalog containing transcription factors associated with 2720 target genes and 6401 experimentally validated regulations. When it was available, a distinction between transcriptional activation and inhibition was included for each regulation. Next, we built a tool (www.tfacts.org) that compares submitted gene lists with target genes in the catalog to detect regulated transcription factors. TFactS was validated with published lists of regulated genes in various models and compared to tools based on in silico promoter analysis. We next analyzed the NCI60 cancer microarray data set and showed the regulation of SOX10, MITF and JUN in melanomas. We then performed microarray experiments comparing gene expression response of human fibroblasts stimulated by different growth factors. TFactS predicted the specific activation of Signal transducer and activator of transcription factors by PDGF-BB, which was confirmed experimentally. Our results show that the expression levels of transcription factor target genes constitute a robust signature for transcription factor regulation, and can be efficiently used for microarray data mining.
INTRODUCTION
Data mining in gene lists generated by microarray experiments remains a major challenge. A particularly intricate issue is to identify the regulatory network responsible for gene regulation in a given biological system. Several tools like GSEA offer the possibility to search for enriched transcription factor (TF) targets in lists of co-expressed genes (1–5). They mostly use precomputed putative cis-regulatory elements predicted in gene promoters and compare their results to the submitted gene lists. A drawback of binding site prediction is the high level of noise when it is applied to mammalian genomes (6). Several improvements have been proposed, such as context-sensitive promoter analysis and promoter clustering based on microarray co-expressed genes (7–12).
We and others have observed that the activation of TFs like SREBP1 (13,14) and p53 (15) can easily be detected in microarray gene lists based on the fact that the expression of their target genes is changed. It is, however, not clear as to whether this approach is valid for other TFs.
The aim of this work was to test whether a catalog of well-characterized TF targets can be used to predict the activity of transcription factors in various biological systems, based on microarray data.
As a model system to test this method, we studied gene regulation by growth factor receptors in normal and leukemia cells. Growth factors, such as platelet-derived growth factor (PDGF) and fibroblast growth factor (FGF), are key regulators of cell proliferation, differentiation and survival. They exert these effects through specific tyrosine kinase receptors, which activate signalling pathways that ultimately regulate transcription factors and gene expression. Previous reports using expression microarrays suggested that growth factors regulate gene sets involved in wound healing (16), fatty acid and cholesterol synthesis (13,14), cell division and differentiation (17). Various tyrosine kinase receptors are thought to induce overlapping gene expression, suggesting that growth factors activate a common transcriptional program associated with cell growth (18).
MATERIALS AND METHODS
Data
To build a database linking TFs to their target genes, we started with lists of genes obtained from curated TRED (19), TRRD (20), PAZAR (21) and NFIregulomeDB databases, and completed some of these factor-gene lists with the regulation type (‘up’ or ‘down’) based on the original publications. SREBP and p53 target gene signatures were based on our previous reports (13,15) and were completed by data from TRED. The FOXO1, FOXO3, TCF/β-Catenin, GLI, ID, AR, GR, LXR, NOTCH/RBP-J, PPARα, ATF6, HNF, SF1 and STAT transcription factors gene target lists were collected from published papers. On the basis of these data, we built two catalogs: the ‘sign-sensitive’ catalog that takes into account the sign of the regulation (‘up’ or ‘down’) and the ‘sign-less’ catalog that neglects this information (see Figure 1 and Supplementary Data in supplementary file 1 for catalogs and references).
Figure 1.

Data integration in TFactS catalogs.
Statistics
The number of target genes for a particular TF in the query gene lists and in the catalog are compared using right-sided Fisher’s test. Three different hypotheses are tested for each TF. These hypotheses are, respectively, activation and inhibition (using sign-sensitive catalog), and regulation (using sign-less catalog). For each hypothesis, we compute the P-value (Pval), E-value (Eval), Q-value (Qval), false discovery rate control (FDRC), as well as a non-parametric random control (RC).
The P-value is computed according to the hypergeometric formula: 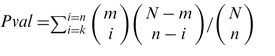 , where m is the number of target genes annotated for the TF under consideration, n the number of query genes, N the number of regulations in the catalog (sign-less or sign-sensitive) and k varies with the tests as follows.
sign-less regulation: k is the number of query genes that are annotated as regulated by TF (i.e. the intersection between the query and the TF signature);
sign-sensitive activation: is the number of query genes for which the sign of the transcriptional response (+for upregulated, −for downregulated) is the same as the sign of their regulation by TF (+ for activation, −for repression);
sign-sensitive inhibition: k is the number of query genes for which the sign of the transcriptional response is the opposite of the sign of their regulation by TF.
The nominal P-value (Pval) represents the risk of false positive for a single test. Since the list of query genes is systematically compared to each target gene signature, a multi-testing condition is required. The Eval represents the expected number of false positives for a given nominal P-value. It is computed using the formula: Eval = Pval·T, where T is the number of tests.
The Q-value (Qval), which is an estimate of the False Discovery Rate (FDR), i.e. the fraction of predictions expected to be false (false predictions/all predictions) for a given level of nominal P-value, is computed using the R package from Storey et al. (22).
The Benjamini–Hochberg procedure to control the FDR is implemented as described in Benjamini et al. (23).
To evaluate empirically the probability to select a TF by chance, we run Fisher's tests with random gene selections. The program computes the RC as follows:  , λ is a user-specified threshold on (λ = 0.05 by default), N is the number of repetitions to perform (N = 100 by default) and N (EvalTF ≤ λ) is the number of random simulations returning an Eval ≤ λ.
Implementation and availability
The tool is available via a Web page www.tfacts.org. It is implemented in HTML, JavaScript, PHP, R and Perl, the catalog of TF signatures is stored and maintained under MySQL.
Validation/comparison
NCI60 data set (24) was retrieved from cellMiner web site. In the E-value matrix constructed from NCI60 data set analysis, prior to the −log10 transformation, we arbitrarily set all the null E-values to 1.00e−4, and put the non-detected TF’s E-values to the matrix maximum value.
Cell cultures and microarray analysis
Human fibroblasts (AG01518) were cultured (1.5 × 10⁶ cells/10 cm dish) in minimum essential medium (MEM) with fetal calf serum 10% and l-Glutamine for 24 h. Cells were starved for 24 h in MEM (0.05% bovine serum albumin and l-Glutamine) and then stimulated for another 24 or 1 h by PDGF-BB (25 ng/ml) or b-FGF (10 ng/ml) in the presence of heparin (50 µg/ml). The control condition was left without stimulation in the starvation medium for 48 h.
The human fibroblast microarray experiment was done in two biological replicates. RNA extraction was performed using RNeasy (Qiagen). RNA quality was tested in agarose gel electrophoresis and by real-time PCR for two known PDGF-BB target genes: NR4A1 (after 1 h) and SCD (after 24 h) compared with a control gene RPLPO (13). The human Affymetrix chip HGU133A2 was used as described (25,26). Results from Affymetrix chips were analyzed using the GCOS suite software, and in each replicate the stimulated conditions were normalized using the control condition as baseline for the comparison. The MAS5 algorithm in GCOS was used as follows: the scaling factor using all probe sets was set to 100 and the normalize factor was set to 1. Using MeV (27), the Significant Analysis of Microarray (SAM) algorithm was applied to detect the most significant probe sets differentially expressed between the four conditions normalized to the control condition (b-FGF stimulated after 1 h, b-FGF stimulated after 24 h, PDGF-BB stimulated after 1 h and PDGF-BB stimulated after 24 h), with 6.73 as the median number of falsely significant genes (a FDR of 5.85%) and a delta value equal to 1.01. The hierarchical analysis of these probe sets and the samples was done using the Euclidian distance and the average linkage clustering. Fold change analysis was done between each condition and the control after the absent calls filtering and taking only probe sets that are marked by GCOS software as increased or decreased having the mean log2 ≥ ratio absolute value of the two replicates 1.
EOL1 [human acute myeloid eosinophilic leukemia cell line (28)] was purchased from DSMZ (ACC386, Germany). Cells were maintained in RPMI medium with 10% fetal bovine serum and supplemented with penicillin–streptomycin solution (Sigma). Cells were treated with 100 nM imatinib mesylate for 4 h and then washed once in ice-cold PBS before being used for further experiments. RNA extraction was done as above from 510 cells and the human Affymetrix Chip U133 Plus 2.0 was used according to manufacturer's instruction (Affymetrix). GCOS was used with the same parameters as above with the imatinib-treated condition as baseline. Lists of regulated genes used here were obtained by applying a 3-fold expression filter.
These data sets are available in Gene Expression Omnibus database (ref: GSE14256 and GSE15237).
Western blots were performed as described (25,29–31) with antibodies from Cell Signalling Technology.
RESULTS AND DISCUSSION
Construction of the catalogs
In an effort to build a catalog linking transcription factors to their known target genes, we integrated data from the literature and freely available databases (Figure 1). This catalog contains 6401 regulations linking 343 distinct TFs to 2720 distinct genes. We considered all TF target genes independently from conditions such as tissue, treatment or cell type. Since gene regulation is highly conserved in mammals, data from human, mouse and rat were pooled. This is justified by the fact that many published experiments were performed in heterogeneous biological systems, for instance human promoters studied in mouse cells transfected with cDNA from different species. We reasoned that including the sign of the TF–gene associations (‘up-’ or ‘down-’ regulation) would be useful. However, although it is usually available from experimental data, this information is surprisingly not systematically included in mammalian TF databases. Therefore, in our first catalog, we did not take into account the sign of each regulation (i.e. activation or repression). We will refer to it as the ‘sign-less’ catalog.
To build a ‘sign-sensitive’ catalog, we annotated the regulations from original publications and from databases when available. Altogether, this second catalog contains 63 TFs (Figure 1). Both catalogs are provided in Supplementary Data in supplementary file 1.
For some TFs, the ‘specific target gene signature’ was defined as the list of target genes known to be regulated by, a given TF. We further define ‘generic target gene signatures’ by regrouping closely related TFs sharing many target genes. For instance, the E2F generic signature groups target genes of the four activating isoforms of E2F (E2F1–4).
Enrichment in transcription factor target genes: statistical analysis
The comparison between TF signatures and the query gene lists is based on Fisher's test. For each TF, a contingency table is created that compares the gene query lists and the TF signature in the catalog. Using the sign-sensitive catalog, we calculate P-values (Pval) for two hypotheses, respectively, activation (activated target genes are ‘up’ and repressed are ‘down’) and TF inhibition (activated target genes are ‘down’ and repressed target genes are ‘up’), see ‘Materials and Methods’ section for more details. Using the sign-less catalog we calculated target gene enrichment Pval for each TF (this is called regulation hypothesis). Examples of contingency tables for the three hypotheses (‘regulation’, ‘activation’ and ‘inhibition’, respectively) are presented in Supplementary Data in supplementary file 2.
The corresponding E-value (Eval), Q-value (Qval) and FDRC for each P-value (Pval) are calculated to control the rate of false positives in multiple testing conditions.
As a negative control, we included a non-parametric false positive percentage estimation, which we call RC. It is based on the selection of random sets of genes from the catalog according to the number of genes in the query lists.
In this study, we considered a TF as regulated, activated or inhibited, respectively, if, under the corresponding hypothesis the Pval was significant (≤0.05) combined with either Eval ≤ 0.05 or Qval ≤ 0.05 or significant FDRC or RC≤5%.
User interface
TFactS is available at www.tfacts.org. The main page includes three frames. The query frame allows the user to submit the lists of upregulated and/or downregulated genes, and to select the analysis parameters (statistical thresholds, number of random selections). By default, in this version, only HGNC standard official gene names and Entrez gene IDs are accepted in the list of query genes. The user is allowed to enter a custom catalog, as an alternative to the TFactS catalog proposed by default.
Results are displayed in the main frame. The results of each run are reported in two pages. Depending on which catalog the user chooses, the first page contains a table for each type of hypothesis: regulation (sign-less catalog), activation and inhibition (sign-sensitive catalog), each one contains a list of regulated TFs, the corresponding Pval, Eval, Qval, FDRC, the number of genes in the intersection, the number of target genes for that TF and the RC (see ‘Materials and Methods’ section). The second page shows for each submitted gene the corresponding TFs in the catalog and its type of regulation. An export link to the raw results is also provided.
The tool is documented at various levels. The statistical methods and options are explained in a detailed help page. A ‘Demo’ button loads the tool with a study case data set, to illustrate the process for a typical submission. An additional frame allows browsing the list of target genes for a particular TF.
Validation with published microarray data
TFactS validation was first performed by reanalyzing microarray-based studies in which TFs present in our catalogs were shown to be activated or inhibited. Sixteen such studies, independent from those used to build the database, were found in PubMed (32–47), covering 18 transcription factors in total (14 activations and 4 inhibitions). These experiments consisted in detecting genes that are differentially expressed between tumor and normal cells, in different cell types, or that respond to cytokines (interferons) or drugs affecting specific signaling pathways (Table 1). Those studies cover Human and Mouse species and a broad range of biological processes and conditions. In each report, the regulation of one or more TF was inferred from microarray and experimental data.
Table 1.
TFactS validation
| Sign-less | Sign-sensitive | |||
|---|---|---|---|---|
| catalog | catalog | |||
| Ref. | Model | Expected TFs | Regulation | Act./Inh. |
| (33): | Colon cancer | FOXO3 act. | y | + |
| MYC inh. | y | n | ||
| (34): | fibroblasts | MYC act. | y | + |
| (35): | fibrosarcoma | STAT1 act. | y | + |
| (36): | lung cancer | p53 act. | y | + |
| (37): | glioblastoma | SREBP act. | y | + |
| (38): | granulocytes | NF-κB act. | y | + |
| (39): | B Lymphocytes | NF-κB act. | y | + |
| (40): | B lymphoma | SREBP inh. | y | − |
| (32): | glioblastoma | FOXO3 act. | y | + |
| NF-κB inh. | y | − | ||
| (41): | adrenocortical cells | SF-1 act. | y | n |
| (42): | endothelial cells | EGR-1 act. | y | + |
| (43): | synovial fibroblasts | SMAD act. | y | + |
| (44): | Commd1 null mice | HIF-1 act. | y | + |
| (45): | TG2 null mice | SP-1 act. | y | + |
| hepatocytes | ||||
| (46): | osteosarcoma | E2F act. | y | + |
| (47): | keratinocytes | AP-1 inh. | y | − |
| Expected hits (Found/total) | 18/18 | 16/18 | ||
Eighteen TFs (14 activated and 4 inhibited) reported in 16 studies were used to test TFactS. Under each hypothesis, TFs are considered significant on the basis of multiple score thresholds (Pval and Eval or Qval or F D Rc or RC) as described in the text. The expected TFs that were described in the studies are represented here with names in bold character. Symbols: (y): found regulated, (+): found activated, (−): found inhibited and (n): not found. act.: activation and inh.: inhibition.
To evaluate the ability of TFactS to detect the relevant TFs, we submitted the genes reported by the authors as showing a significant response in their respective microarray analysis. When regulated genes were not listed in the paper, we reanalyzed the raw data obtained from GEO database and we selected genes significantly regulated >2-fold.
Even though these studies were based on very different biological systems, the results summarized in Table 1 (details in Supplementary Data in supplementary file 1) show that TFactS identified all (18/18) of the relevant TFs. For example, Terragni et al. (32) showed that inhibition of the AKT pathway provokes the activation of FOXO3 and the inhibition of NF-κB. Consistently, TFactS identified FOXO3 as regulated (Pval≃0.00e+0) and activated (Pval = 1.40e−4) and NF-κB as regulated (Pval≃0.00e+0) and inhibited (Pval=1.16e−3).
For some studies, the association is detected both in the sign-less test and in the sign-sensitive tests (activation or inhibition). The associations are sometimes returned both at the generic (e.g. FOXO) and specific (e.g. FOXO3) levels.
The sign-sensitive catalog allowed inferring the type of TF regulation (activated or inhibited). As shown in Table 1 (details in Supplementary Data in supplementary file 1), TFactS failed to recognize the sign of the regulation in two cases. Another limitation of the sign-sensitive catalog is the more restricted number of TFs that is included. As expected, tests using that catalog returned a lower RC compared with sign-less predictions, indicating that it is more conservative.
In summary, using the sign-less catalog associated with Fisher statistics, TFactS results matched the conclusions of published experimental studies. Taking into account the sign of regulation provided a useful piece of information, but did not improve the predictions, at least in these initial validation tests. However, much more sign annotations would be required to provide a fair comparison between the two catalogs.
Comparison with other methods
We attempted to compare the results returned by TFactS with those of other freely available tools, which are generally based on in silico cis-regulatory motif predictions in gene promoters.
Among those tools, we used GSEA (1) based on (‘c3’) signatures generated from predictions of cis-regulatory motifs that are conserved across the human, mouse, rat and dog genomes and matched to known TFs by their consensus DNA binding motifs. We also chose four other tools: TFM-Explorer (2), CORE_TF (3), CRSD (4) and oPOSSUM (5), which are based on overrepresentation of TF binding sites using TRANSFAC (48) and JASPAR (49) position weight matrices (PWM) for gene promoter scanning. TRANSFAC contains 365 and presents a large overlap with TFactS database, including all TFs used in the validation step. Each tool has a specific method for background filtering. CRSD prefilters results by Q-value ranking; TFM-Explorer uses a threshold based on the parameters determined by the local genomic context; CORE_TF compares the submitted gene promoter set with a random set; and oPOSSUM is based on phylogenetic footprinting.
To compare the different tools, we have used similar settings for all of them in terms of statistical cutoff and promoter length. Lists of enriched transcription factors generated using these tools were ranked according to P-values or FWER P-value (GSEA). We considered only significant results (nominal P-value) and limited the number of TFs in the output lists to maximum 100, even though such long lists are not suitable for experimental validation. Using these parameters, CRSD and CORE_TF found 12 out of 18 expected TFs, TFM-Explorer 8, oPOSSUM 7 and GSEA 2. Three TFs were absent from JASPAR profiles used by oPOSSUM. When used with TFactS sign-less catalog instead of ‘c3’ signatures, GSEA performed better (5/18). We did not use other GSEA gene set signatures as they are not centered on TFs. Detailed results and methods are shown in Supplementary Data supplementary file 2. Compared to TFactS, these tools produced much longer lists of regulated TFs, but it is not clear whether these represent background or previously unrecognized regulations. In summary, TFactS was able to identify expected transcription factor regulations, which, at least in some cases, were not found by tools based on PWM or consensus motifs, using standard settings.
Analysis of NCI60 cancer cell line data set
To test whether TFactS could be used to screen cancer microarray data sets, we analyzed the NCI60 (24) cancer collection, which contains 60 human cancer cell lines clustered in nine tumor types (melanoma, ovarian, lung, leukemia, prostate, renal, colon, glioma and breast). On the basis of normalized log ratio, we selected genes that were significantly regulated at least 2-fold compared to the reference provided by Shankavaram et al. These lists of genes were analyzed by TFactS, which predicted a number of regulated TF in each cell line. In order to compare the different cell lines, a matrix of E-values (Eval) was constructed from these results with TFs in rows and cell lines in columns. We observed that some TFs, such as β-catenin, FOXO and NF-κB, were found significantly regulated in a large number of cell lines, as expected from their widespread role in cancer. Next, we applied the SAM algorithm to identify TFs differentially regulated between the nine tumor groups. Among these TFs, SOX10, MITF and JUN were significantly regulated in melanomas in comparison with other cancer types (Figure 2). The specific role of MITF in melanocytes and melanoma is well known. By contrast, SOX10 is widely expressed and its unique association with melanoma was more surprising. Future work will have to unravel whether SOX10 may be a specific target for this cancer type.
Figure 2.

SOX10, MITF and JUN transcription factors are regulated in melanoma and associated with mutations in RAS and RAF. E-values of TFactS-predicted TF regulations for each NCI60 cell line are transformed into scores [−log10(E-value)]. These scores were plotted by cancer type (A) or by pathway mutations (B) for SOX10, MITF and JUN. Mutations clustered into RAF-RAS pathway targeted BRAF, KRAS, HRAS and NRAS. P-values were obtained by Kruskal–Wallis test (A) and Student’s t-test (B). WT, ‘wild type’; MUT, ‘mutant’; BR, breast; CNS, central nervous system; CO, colon; LC, lung cancer; LE, leukemia; ME, melanoma; OV, ovarian; PR, prostate; RE, renal.
Since the NCI60 data set contains information about the presence of cancer mutations in each cell line, we looked for significant associations between these mutations and TF regulations. As the number of cell lines harboring one particular mutation was low, we grouped mutations according to signal transduction pathways. Figure 2B shows that mutations in RAS or RAF genes, key mediators of the MAP kinase pathway which are frequently mutated in melanoma and other tumors, were associated with the regulation of SOX10, MITF and JUN. The regulation of JUN and MITF by MAP kinases has already been described (50,51). In contrast, association of SOX10 with this pathway was not expected.
Analysis of novel microarray data sets
As an experimental validation for our approach, we performed two microarray experiments in two distinct well-defined biological models: the human eosinophilic leukemia cell line EOL1 and primary human fibroblast cells stimulated with growth factors.
EOL1 cells express a constitutively activated FIP1L1-PDGF receptor α fusion protein (28). This oncogene can be efficiently inhibited by the drug imatinib mesylate (Gleevec®). We compared gene expression profiles of EOL1 cells treated with imatinib for 4 h to those of untreated cells. We selected genes that were significantly regulated at least 3-fold in control compared imatinib-treated cells (with Supplementary Data in supplementary file 3). TFactS indicated a significant activation of signal–transduces and activator of tracription (STAT)1, STAT3 and STAT5 (Figure 3).
Figure 3.

STAT1 and STAT3 are phosphorylated in EOL1 cells and inhibited by imatinib. (A) STAT activation Benjamini-Hochberg corrected P-values predicted by TFactS. (B) Cell lysates from imatinib-treated or control EOL1 cells were used in western blot probed with antibodies against phospho-STAT3 and phospho-STAT1. As a control, we used antibodies against total STAT3 and STAT1.
The FIP1L1-PDGFRα has previously been reported to activate STAT5 (28) and STAT3 (52), but to our knowledge the activation of STAT1 has not been established yet. We tested this prediction by western blotting using antibodies that are able to recognize the active, phosphorylated form of STATs. Figure 3 shows that STAT3 and STAT1 are indeed phosphorylated in EOL1 cells and that this phosphorylation is inhibited by imatinib, suggesting that it may also play a role in the transformation process. These results confirmed the validity of the TFactS target gene analysis.
We next tested the impact of the length of the input gene list on TFactS results. Starting from the list of significantly regulated genes ranked according to absolute fold-change, we submitted increasing numbers of top-ranked genes to TFactS (from 10 to 2500). TFactS found STAT1 regulated if the number of submitted genes was superior to 50 (Supplementary Figure S1 in supplementary file 2). Similar data were obtained for STAT3 and STAT5. We then performed a robustness analysis by adding randomly selected genes to the same data set. The addition of a background of up to 500 random genes affected the final result significantly only when short lists of regulated genes were submitted (Supplementary Figure S1), suggesting that TFactS can detect a TF signature even when it is diluted in a large number of unrelated genes.
We also analyzed gene expression data from human fibroblasts stimulated by either PDGF-BB or b-FGF for 1 and 24 h. SAM analysis identified 115 relevant probe sets. Hierarchical clustering of these probe sets showed divergent early gene regulation by PDGF and FGF but overlapping late response (data not shown).
We first analyzed genes commonly regulated by PDGF-BB and b-FGF 2-fold after 24 h of stimulation. TFactS indicated that these two growth factors activate SREBP and inhibit FOXO (Table 2 and supplementary data in supplementary file 3), as expected from our previous publications (13,14,25). Our previous in silico promoter analysis did not point to any known TF regulation (A.E. and J.V.H., unpublished data). However, in a similar model, SREBP activation had been detected using a combination of promoter analysis and literature mining (53).
Table 2.
Analysis of genes regulated by growth factors in human fibroblasts using TFactS
| TF | Pval | Eval | ∩ | # TG | RC (%) | |
|---|---|---|---|---|---|---|
| Genes regulated by both PDGF and FGF after 24 h | ||||||
| Regulation | SREBP | 0.00e+0 | 0.00e+0 | 9 | 46 | 0 |
| FOXO1 | 0.00e+0 | 0.00e+0 | 15 | 145 | 4 | |
| FOXO3 | 2.00e−5 | 1.90e−3 | 8 | 68 | 1 | |
| Activation | SREBP | 1.00e−5 | 3.00e−4 | 9 | 46 | 0 |
| Inhibition | FOXO1 | 2.00e−4 | 6.00e−3 | 14 | 144 | 0 |
| FOXO3 | 1.29e−3 | 3.87e−2 | 8 | 66 | 0 | |
| Genes regulated specifically by PDGF after 1 h | ||||||
| Regulation | STAT3 | 0.00e+0 | 0.00e+0 | 8 | 67 | 2 |
| STAT1 | 2.50e−4 | 1.70e−2 | 4 | 61 | 1 | |
| STAT5 | 6.00e−5 | 4.08e−3 | 4 | 42 | 1 | |
| Activation | STAT3 | 0.00e+0 | 0.00e+0 | 8 | 48 | 2 |
| STAT1 | 5.00e−5 | 1.05e−3 | 4 | 23 | 1 | |
| STAT5 | 5.40e−4 | 1.13e−2 | 4 | 42 | 2 | |
Analysis of significant gene lists regulated >2-fold by PDGF-BB and b-FGF after 24 h (upper Table) or only by PDGF-BB after 1 h (lower Table) of stimulation. For each test: regulation (sign-less), activation and inhibition (sign-sensitive), only transcription factors verified experimentally in this study or elsewhere are listed with corresponding statistics as reported by TFactS (detailed results are shown in Supplementary Data in supplementary file 3). ∩, number of genes in common between TF target genes and the query list; # TG, number of target genes for the corresponding TF.
We then focused on the early gene expression response induced by both growth factors. A combined analysis with Affymetrix GCOS and a 2-fold threshold on expression ratio, led to the selection of 114 probe sets responding to PDGF-BB and 42 probe sets responding to b-FGF, 37 of which were shared between the two gene lists. We analyzed genes specifically regulated by PDGF-BB (and not b-FGF). TFactS detected several significant STAT signatures: STAT1, STAT3 and STAT5 (Table 2).
To further confirm these TFactS findings, we sought to cluster the conditions in this microarray experiment using the expression of predicted TF target genes that were also present in submitted lists. Figure 4 shows a time-dependent clustering of the PDGF-BB and b-FGF conditions based on SREBP target genes, which is consistent with the late (24 h) activation of SREBP by both growth factors. It shows also a successful clustering of the two PDGF-BB 1 h stimulation replicates based on STAT target genes, confirming the predicted early (1 h) specific activation of STATs by PDGF-BB.
Figure 4.

Hierarchical clustering of STAT or SREBP target genes significantly regulated by PDGF-BB and b-FGF in human fibroblasts. STAT(1, 3 and 5) target gene signatures were pooled as well as SREBP(1 and 2) target genes. Several reports have shown that IRS2 gene expression is downregulated by SREBP while other targets are up-regulated . The intensities are in log2 ratios (color scale). Two replicate experiments are shown. F1, b-FGF(1 h); F24, b-FGF(24 h); P1, PDGF-BB(1 h); P24, PDGFBB(24 h).
It is well known that growth factors activate STAT (54–57), but the specific regulation of these transcription factors by PDGF and not by FGF was unexpected. To test the specific action of PDGF-BB, we performed western blots against phosphorylated STAT1 and STAT3 in human fibroblasts after short-term (15 min) stimulation with PDGF-BB or b-FGF. Figure 5 shows that PDGF-BB induced a strong phosphorylation of STAT1 and STAT3, while b-FGF did not. We also included other fibroblast mitogens, such as IGF1, PDGF-AA, PDGF-AB, FGF-4 and insulin. None of these growth factors activated STAT1 or STAT3 to a significant extent. As a control for b-FGF activity, we checked other signalling pathways and showed JNK phosphorylation by both PDGF and FGF.
Figure 5.

STAT phosphorylation is specifically induced by PDGF-BB. Human fibroblasts were starved for 48 h in serum-free medium and stimulated with the indicated growth factors for 15 min. Total cell lysate was used for western blot with antibodies against specific phospho-STAT, phospho-JNK, phospho-AKT, total STAT and total JNK as indicated. Actin was detected as a control.
The current hypothesis is that growth factors activate largely overlapping signal transduction pathways (18). This was confirmed for late gene regulation in our model. However, in this model, PDGF-BB stimulation specifically produced a STAT transcriptional signature in contrast with other growth factors. A STAT3-dependent pathway has been suggested to contribute to PDGF-driven proliferation (54), but whether this cascade is shared by multiple growth factors is not clear. The mechanism by which PDGF receptors specifically activates STAT requires further investigations.
In conclusion, TFactS allowed us to pinpoint an unexpected specificity in the activation of STAT transcription factors by PDGF receptors in fibroblasts and leukemia cells.
CONCLUSIONS
In this study, we showed that the regulation of TFs can be accurately predicted from transcriptome data, by comparing the lists of up- and downregulated genes to a list of curated target gene signatures. We validated the approach using published microarray studies and new experimental data. It proved able to propose valid candidate TFs involved in the transcriptional response to a specific treatment (i.e. imatinib or growth factors). These predictions were relatively robust, although it is likely that the quality of the experimental microarray data and the normalization steps may significantly affect the final results. This applies to all the methods dealing with sets of co-expressed genes as input.
We also showed that TFactS can accurately predict the activity of TFs if based on a catalog that is annotated with the sign of the regulation (activation or repression). However, we could not fully assess the performance of this feature, by comparing with other methods, because of the limited number of signatures annotated in the sign-sensitive TFactS catalog.
TF signature validations were performed on well-characterized TF for which a significant number of target genes are known (at least 21 in Table 1). In the NCI60 cancer data set analysis, MITF and SOX10 were represented by only 3 and 10 targets in the database, respectively, indicating that shorter signatures can also be useful. We are currently working on extending the number of regulations and increasing the number of TFs in the catalog. In addition, we offer the possibility to the scientific community to add their own annotated target genes either temporarily or permanently. This option is already implemented in the online version of TFactS. A limitation of our approach is the availability of high-quality experimental target gene signatures. A few databases, such as TRANSFAC (48), TRED (19), TRRD (20), ORegAnno (58) and PAZAR (21), tackle this issue by gathering published promoter analysis. As mentioned above, it would be valuable to systematically annotate the sign of regulation in these databases, which has not been done so far. Obviously, much more work will be needed to identify the gene signature of all transcription factors present in mammalian genomes.
At this stage, we pooled data from experimental systems differing in terms of species (rat, mouse and human), cell types and environmental conditions, in order to get consensus signatures. The results from TFactS validation, based on multiple tissues, species and cell types, suggest the existence of robust core target signatures for the transcription factors that were analyzed. Nevertheless, the importance of these parameters will be carefully tested in future versions of the tool, in order to account for interspecies variations. Some of these parameters are already included in other databases (19–21,48,58).
Given the diversity in the parameters that can be optimized for each tool, it is difficult to produce an unbiased, fair comparison with the other tools that are able to predict TF activities, such as those based on in silico promoter analysis. In our hands, TFactS was able to predict TF regulations that, in a number of cases, could not be found using a few popular tools based on consensus motifs or matrices. We did not test more complex analysis, which were reported to improve results significantly (8–11,53). Obviously, TFactS is not suitable for the identification of novel target genes, by contrast to PWM-based tools. Our data suggest that TFactS is a viable, simple alternative to promoter analysis methods to study differential activity of known TFs when sufficient known targets of the TF are represented in the database.
Altogether, we show here that comparing groups of genes showing a response in microarray data with experimental target gene signatures is an efficient way to predict the regulation and the level of activity (activation or inhibition) of well-characterized trans-acting factors. As a proof of concept, we validated a simple tool (TFactS) that combines Fisher's test and a curated target catalogs, which do or do not take into account the sign of the regulations. We also suggest that TFactS may contribute to the functional analysis of cancer microarray data.
SUPPLEMENTARY DATA
Supplementary Data are available at NAR Online.
FUNDING
Région Wallonne de Belgique TransMaze project (415925 linked to 516207); ‘Bourse d'Excellence IN.WBI’ from Wallonie-Bruxelles International, Belgium. Funding for open access charge: internal university grant.
Conflict of interest statement. None declared.
Supplementary Material
ACKNOWLEDGEMENTS
We are grateful to Pr. Yves Deville (UCL, Belgium) and to the BioEdge (UCL, Belgium) and TransMaze (ULB, Belgium) team members for constant support.
REFERENCES
- 1.Subramanian A, Tamayo P, Mootha VK, Mukherjee S, Ebert BL, Gillette MA, Paulovich A, Pomeroy SL, Golub TR, Lander ES, et al. Gene set enrichment analysis: a knowledge-based approach for interpreting genome-wide expression profiles. Proc. Natl Acad. Sci. USA. 2005;102:15545–15550. doi: 10.1073/pnas.0506580102. [DOI] [PMC free article] [PubMed] [Google Scholar]
- 2.Defrance M, Touzet H. Predicting transcription factor binding sites using local over-representation and comparative genomics. BMC Bioinformatics. 2006;7:396. doi: 10.1186/1471-2105-7-396. [DOI] [PMC free article] [PubMed] [Google Scholar]
- 3.Hestand MS, van Galen M, Villerius MP, van Ommen GJ, den Dunnen JT, 't Hoen PA. CORE_TF: a user-friendly interface to identify evolutionary conserved transcription factor binding sites in sets of co-regulated genes. BMC Bioinformatics. 2008;9:384. doi: 10.1186/1471-2105-9-495. [DOI] [PMC free article] [PubMed] [Google Scholar]
- 4.Liu CC, Lin CC, Chen W.SE, Chen HY, Chang PC, Chen J.JW, Yang PC. CRSD: a comprehensive web server for composite regulatory signature discovery. Nucleic Acids Res. 2006;34:W571–W577. doi: 10.1093/nar/gkl279. [DOI] [PMC free article] [PubMed] [Google Scholar]
- 5.Ho Sui SJ, Mortimer JR, Arenillas DJ, Brumm J, Walsh CJ, Kennedy BP, Wasserman WW. oPOSSUM: identification of over-represented transcription factor binding sites in co-expressed genes. Nucleic Acids Res. 2005;33:3154–3164. doi: 10.1093/nar/gki624. [DOI] [PMC free article] [PubMed] [Google Scholar]
- 6.Sand O, Turatsinze JV, van Helden J. Modern Genome Annotation: the BioSapiens Network. Vienna, Austria: Springer; 2008. [Google Scholar]
- 7.Veerla S, Höglund M. Analysis of promoter regions of co-expressed genes identified by microarray analysis. BMC Bioinformatics. 2006;7 doi: 10.1186/1471-2105-7-384. [DOI] [PMC free article] [PubMed] [Google Scholar]
- 8.Werner T. Bioinformatics applications for pathway analysis of microarray data. Curr. Opin. Biotechnol. 2008;19:50–54. doi: 10.1016/j.copbio.2007.11.005. [DOI] [PubMed] [Google Scholar]
- 9.Elemento O, Slonim N, Tavazoie S. A universal framework for regulatory element discovery across all genomes and data types. Mol. Cell. 2007;28:337–350. doi: 10.1016/j.molcel.2007.09.027. [DOI] [PMC free article] [PubMed] [Google Scholar]
- 10.Sinha S, Adler AS, Field Y, Chang HY, Segal E. Systematic functional characterization of cis-regulatory motifs in human core promoters. Genome Res. 2008;18:477–488. doi: 10.1101/gr.6828808. [DOI] [PMC free article] [PubMed] [Google Scholar]
- 11.Linhart C, Halperin Y, Shamir R. Transcription factor and microRNA motif discovery: the Amadeus platform and a compendium of metazoan target sets. Genome Res. 2008;18:1180–1189. doi: 10.1101/gr.076117.108. [DOI] [PMC free article] [PubMed] [Google Scholar]
- 12.The FANTOM Consortium and Riken Omics Science Center. The transcriptional network that controls growth arrest and differentiation in a human myeloid leukemia cell line. Nat. Genet. 2009;41:553–562. doi: 10.1038/ng.375. [DOI] [PMC free article] [PubMed] [Google Scholar]
- 13.Demoulin JB, Ericsson J, Kallin A, Rorsman C, Rönnstrand L, Heldin CH. Platelet-derived growth factor stimulates membrane lipid synthesis through activation of phosphatidylinositol 3-kinase and sterol regulatory element-binding proteins. J. Biol. Chem. 2004;279:35392–35402. doi: 10.1074/jbc.M405924200. [DOI] [PubMed] [Google Scholar]
- 14.Kallin A, Johannessen LE, Cani PD, Marbehant CY, Essaghir A, Foufelle F, Ferré P, Heldin CH, Delzenne NM, Demoulin JB. SREBP-1 regulates the expression of heme oxygenase 1 and the phosphatidylinositol-3 kinase regulatory subunit p55 gamma. J. Lipid Res. 2007;48:1628–1636. doi: 10.1194/jlr.M700136-JLR200. [DOI] [PubMed] [Google Scholar]
- 15.Knoops L, Haas R, de Kemp S, Majoor D, Broeks A, Eldering E, de Boer JP, Verheij M, van Ostrom C, de Vries A, et al. In vivo p53 response and immune reaction underlie highly effective low-dose radiotherapy in follicular lymphoma. Blood. 2007;110:1116–1122. doi: 10.1182/blood-2007-01-067579. [DOI] [PubMed] [Google Scholar]
- 16.Grazul-Bilska AT, Johnson ML, Bilski JJ, Redmer DA, Reynolds LP, Abdullah A, Abdullah KM. Wound healing: the role of growth factors. Drugs Today (Barc) 2003;39:787–800. doi: 10.1358/dot.2003.39.10.799472. [DOI] [PubMed] [Google Scholar]
- 17.Demoulin JB, Enarsson M, Larsson J, Essaghir A, Heldin CH, Forsberg-Nilsson K. The gene expression profile of PDGF-treated neural stem cells corresponds to partially differentiated neurons and glia. Growth Factors. 2006;24:184–196. doi: 10.1080/08977190600696430. [DOI] [PubMed] [Google Scholar]
- 18.Fambrough D, McClure K, Kazlauskas A, Lander ES. Diverse signaling pathways activated by growth factor receptors induce broadly overlapping, rather than independent, sets of genes. Cell. 1999;97:727–741. doi: 10.1016/s0092-8674(00)80785-0. [DOI] [PubMed] [Google Scholar]
- 19.Zhao F, Xuan Z, Liu L, Zhang MQ. TRED: a Transcriptional Regulatory Element Database and a platform for in silico gene regulation studies. Nucleic Acids Res. 2007;35:137–140. doi: 10.1093/nar/gki004. [DOI] [PMC free article] [PubMed] [Google Scholar]
- 20.Kel' AE, Kolchanov NA, Kel' OV, Romashchenko AG, Anan'ko EA, Ignat'eva EV, Merkulova TI, Podkolodnaia OA, Stepanenko IL, Kochetov AV, et al. TRRD: a database of transcription regulatory regions in eukaryotic genes. Mol. Biol. (Mosk) 1997;31:626–636. [PubMed] [Google Scholar]
- 21.Portales-Casamar E, Kirov S, Lim J, Lithwick S, Swanson MI, Ticoll A, Snoddy J, Wasserman WW. PAZAR: a framework for collection and dissemination of cis-regulatory sequence annotation. Genome Biol. 2007;8:R207. doi: 10.1186/gb-2007-8-10-r207. [DOI] [PMC free article] [PubMed] [Google Scholar]
- 22.Storey JD, Tibshirani R. Statistical significance for genomewide studies. Proc. Natl Acad. Sci. USA. 2003;100:9440–9445. doi: 10.1073/pnas.1530509100. [DOI] [PMC free article] [PubMed] [Google Scholar]
- 23.Benjamini Y, Hochberg Y. Controlling the false discovery rate: a practical and powerful approach to multiple testing. J. Roy. Stat. Soc. 1995;57:289–300. [Google Scholar]
- 24.Shankavaram UT, Reinhold WC, Nishizuka S, Major S, Morita D, Chary KK, Reimers MA, Scherf U, Kahn A, Dolginow D, et al. Transcript and protein expression profiles of the NCI-60 cancer cell panel: an integromic microarray study. Mol. Cancer Ther. 2007;6:820–832. doi: 10.1158/1535-7163.MCT-06-0650. [DOI] [PubMed] [Google Scholar]
- 25.Essaghir A, Dif N, Marbehant CY, Coffer PJ, Demoulin JB. The transcription of FOXO genes is stimulated by FOXO3 and repressed by growth factors. J. Biol. Chem. 2009;284:10334–10342. doi: 10.1074/jbc.M808848200. [DOI] [PMC free article] [PubMed] [Google Scholar]
- 26.Leja J, Essaghir A, Essand M, Wester K, Oberg K, Totterman TH, Lloyd R, Vasmatzis G, Demoulin JB, Giandomenico V. Novel markers for enterochromaffin cells and gastrointestinal neuroendocrine carcinomas. Mod. Pathol. 2009;22:261–272. doi: 10.1038/modpathol.2008.174. [DOI] [PubMed] [Google Scholar]
- 27.Saeed AI, Sharov V, White J, Li J, Liang W, Bhagabati N, Braisted J, Klapa M, Currier T, Thiagarajan M, et al. TM4: a free, open-source system for microarray data management and analysis. Biotechniques. 2003;34:374–378. doi: 10.2144/03342mt01. [DOI] [PubMed] [Google Scholar]
- 28.Cools J, Quentmeier H, Huntly BJ, Marynen P, Griffin JD, Drexler HG, Gilliland DG. The EOL-1 cell line as an in vitro model for the study of FIP1L1-PDGFRA-positive chronic eosinophilic leukemia. Blood. 2004;103:2802–2805. doi: 10.1182/blood-2003-07-2479. [DOI] [PubMed] [Google Scholar]
- 29.Chiara F, Bishayee S, Heldin CH, Demoulin JB. Autoinhibition of the platelet-derived growth factor beta-receptor tyrosine kinase by its C-terminal tail. J. Biol. Chem. 2004;279:19732–19738. doi: 10.1074/jbc.M314070200. [DOI] [PubMed] [Google Scholar]
- 30.Demoulin JB, Seo JK, Ekman S, Grapengiesser E, Hellman U, Rönnstrand L, Heldin CH. Ligand-induced recruitment of Na+/H+-exchanger regulatory factor to the PDGF (platelet-derived growth factor) receptor regulates actin cytoskeleton reorganization by PDGF. Biochem. J. 2003;376(Pt 2):505–510. doi: 10.1042/BJ20030385. [DOI] [PMC free article] [PubMed] [Google Scholar]
- 31.Toffalini F, Kallin A, Vandenberghe P, Pierre P, Michaux L, Cools J, Demoulin JB. The fusion proteins TEL-PDGFRbeta and FIP1L1-PDGFRalpha escape ubiquitination and degradation. Haematologica. 2009;94:1085–1093. doi: 10.3324/haematol.2008.001149. [DOI] [PMC free article] [PubMed] [Google Scholar]
- 32.Terragni J, Graham JR, Adams KW, Schaffer ME, Tullai JW, Cooper GM. Phosphatidylinositol 3-kinase signaling in proliferating cells maintains an anti-apoptotic transcriptional program mediated by inhibition of FOXO and non-canonical activation of NF-κB transcription factors. BMC Cell Biol. 2008;9:6. doi: 10.1186/1471-2121-9-6. [DOI] [PMC free article] [PubMed] [Google Scholar]
- 33.Delpuech O, Griffiths B, East P, Essafi A, Lam E.WF, Burgering B, Downward J, Schulze A. Induction of Mxi1-SR by FOXO3a contributes to repression of Myc-dependent gene expression. Mol. Cell. Biol. 2007;27:4917–4930. doi: 10.1128/MCB.01789-06. [DOI] [PMC free article] [PubMed] [Google Scholar]
- 34.Coller HA, Grandori C, Tamayo P, Colbert T, Lander ES, Eisenman RN, Golub TR. Expression analysis with oligonucleotide microarrays reveals that MYC regulates genes involved in growth, cell cycle, signaling, and adhesion. Proc. Natl Acad. Sci. USA. 2000;97:3260–3265. doi: 10.1073/pnas.97.7.3260. [DOI] [PMC free article] [PubMed] [Google Scholar]
- 35.Der SD, Zhou A, Williams B.RG, Silverman RH. Identification of genes differentially regulated by interferon, or using oligonucleotide arrays. Proc. Natl Acad. Sci. USA. 2001;95:15623–15628. doi: 10.1073/pnas.95.26.15623. [DOI] [PMC free article] [PubMed] [Google Scholar]
- 36.Kannan K, Amariglio N, Rechavi G, Jakob-Hirsch J, Kela I, Kaminski N, Getz G, Domany E, Givol D. DNA microarrays identification of primary and secondary target genes regulated by p53. Oncogene. 2001;20:2225–2234. doi: 10.1038/sj.onc.1204319. [DOI] [PubMed] [Google Scholar]
- 37.Ma D, Nutt CL, Shanehsaz P, Peng X, Louis DN, Kaetzel DM. Autocrine PDGFa dependent gene expression in glioblastoma is mediated largely by activation of SREBP and is associated with altered genotype and patient survival in human brain tumors. Cancer Res. 2005;65:5523–5534. doi: 10.1158/0008-5472.CAN-04-2582. [DOI] [PubMed] [Google Scholar]
- 38.Theilgaard-Monch K, Knudsen S, Follin P, Borregaard N. The Transcriptional activation program of human neutrophils in skin lesions supports their important role in wound healing. J. Immunol. 2004;172:7684–7693. doi: 10.4049/jimmunol.172.12.7684. [DOI] [PubMed] [Google Scholar]
- 39.Basso K, Klein U, Niu H, Stolovitzky GA, Tu Y, Califano A, Cattoretti G, Dalla-Favera R. Tracking CD40 signaling during germinal center development. Blood. 2004;104:4088–4096. doi: 10.1182/blood-2003-12-4291. [DOI] [PubMed] [Google Scholar]
- 40.Peng T, Golub TR, Sabatini DM. The Immunosuppressant Rapamycin Mimics a starvation-like signal distinct from amino acid and glucose deprivation. Mol. Cell. Biol. 2002;22:5575–5584. doi: 10.1128/MCB.22.15.5575-5584.2002. [DOI] [PMC free article] [PubMed] [Google Scholar]
- 41.Doghman M, Karpova T, Rodrigues GA, Arhatte M, De Moura J, Cavalli LR, Virolle V, Barbry P, Zambetti GP, Figueiredo BC, et al. Increased steroidogenic factor-1 dosage triggers adrenocortical cell proliferation and cancer. Mol. Endocrinol. 2007;21:2968–2987. doi: 10.1210/me.2007-0120. [DOI] [PubMed] [Google Scholar]
- 42.Fu M, Zhu X, Zhang J, Liang J, Lin Y, Zhao L, Ehrengruber MU, Chen YE. Egr-1 target genes in human endothelial cells identified by microarray analysis. Gene. 2003;315:33–41. doi: 10.1016/s0378-1119(03)00730-3. [DOI] [PubMed] [Google Scholar]
- 43.Pohlers D, Beyer A, Koczan D, Wilhelm T, Thiesen HJ, Kinne RW. Constitutive upregulation of the transforming growth factor-beta pathway in rheumatoid arthritis synovial fibroblasts. Arthritis Res. Ther. 2007;9:R59. doi: 10.1186/ar2217. [DOI] [PMC free article] [PubMed] [Google Scholar]
- 44.van de Sluis B, Muller P, Duran K, Chen A, Groot AJ, Klomp LW, Liu PP, Wijmenga C. Increased activity of hypoxia-inducible factor 1 is associated with early embryonic lethality in Commd1 null mice. Mol. Cell. Biol. 2007;27:4142–4156. doi: 10.1128/MCB.01932-06. [DOI] [PMC free article] [PubMed] [Google Scholar]
- 45.Tatsukawa H, Fukaya Y, Frampton G, Martinez-Fuentes A, Suzuki K, Kuo TF, Nagatsuma K, Shimokado K, Okuno M, Wu J, et al. Role of transglutaminase 2 in liver injury via cross-linking and silencing of transcription factor Sp1. Gastroenterology. 2009;136:1783–1795. doi: 10.1053/j.gastro.2009.01.007. [DOI] [PMC free article] [PubMed] [Google Scholar]
- 46.Vernell R, Helin K, Müller H. Identification of target genes of the p16INK4A-pRB-E2F pathway. J. Biol. Chem. 2003;278:46124–46137. doi: 10.1074/jbc.M304930200. [DOI] [PubMed] [Google Scholar]
- 47.Zhang JY, Adams AE, Ridky TW, Tao S, Khavari PA. Tumor necrosis factor receptor 1/c-Jun-NH2-kinase signaling promotes human neoplasia. Cancer Res. 2007;67:3827–3834. doi: 10.1158/0008-5472.CAN-06-4017. [DOI] [PMC free article] [PubMed] [Google Scholar]
- 48.Wingender E. The TRANSFAC project as an example of framework technology that supports the analysis of genomic regulation. Brief Bioinform. 2008;9:326–332. doi: 10.1093/bib/bbn016. [DOI] [PubMed] [Google Scholar]
- 49.Sandelin A, Alkema W, Engström P, Wasserman WW, Lenhard B. JASPAR: an open-access database for eukaryotic transcription factor binding profiles. Nucleic Acids Res. 2004;32:D91–D94. doi: 10.1093/nar/gkh012. [DOI] [PMC free article] [PubMed] [Google Scholar]
- 50.Karin M. The regulation of AP-1 activity by mitogen-activated protein kinases. J. Biol. Chem. 1995;270:16483–16486. doi: 10.1074/jbc.270.28.16483. [DOI] [PubMed] [Google Scholar]
- 51.Molina DM, Grewal S, Bardwell L. Characterization of an ERK-binding domain in microphthalmia-associated transcription factor and differential inhibition of ERK2-mediated substrate phosphorylation. J. Biol. Chem. 2005;280:42051–42060. doi: 10.1074/jbc.M510590200. [DOI] [PMC free article] [PubMed] [Google Scholar]
- 52.Pan J, Quintàs-Cardama A, Manshouri T, Giles FJ, Lamb P, Tefferi A, Cortes J, Kantarjian H, Verstovsek S. The novel tyrosine kinase inhibitor EXEL-0862 induces apoptosis in human FIP1L1-PDGFR-alpha-expressing cells through caspase-3-mediated cleavage of Mcl-1. Leukemia. 2007;21:1395–1404. doi: 10.1038/sj.leu.2404714. [DOI] [PubMed] [Google Scholar]
- 53.Seifert M, Scherf M, Epple A, Werner T. Multievidence microarray mining. Trends Genet. 2005;21:553–558. doi: 10.1016/j.tig.2005.07.011. [DOI] [PubMed] [Google Scholar]
- 54.Bowman T, Broome MA, Sinibaldi D, Wharton W, Pledger WJ, Sedivy JM, Irby R, Yeatman T, Courtneidge SA, Jove R. Stat3-mediated Myc expression is required for Src transformation and PDGF-induced mitogenesis. Proc. Natl Acad. Sci. USA. 2001;98:7319–7324. doi: 10.1073/pnas.131568898. [DOI] [PMC free article] [PubMed] [Google Scholar]
- 55.Quesnelle KM, Boehm AL, Grandis JR. STAT-mediated EGFR signaling in cancer. J. Cell. Biochem. 2007;102:311–319. doi: 10.1002/jcb.21475. [DOI] [PubMed] [Google Scholar]
- 56.Himpe E, Kooijman R. Insulin-like growth factor-i receptor signal transduction and the janus kinase/signal transducer and activator of transcription (JAK-STAT) pathway. Biofactors. 2009;35:76–81. doi: 10.1002/biof.20. [DOI] [PubMed] [Google Scholar]
- 57.Yang X, Qiao D, Meyer K, Friedl A. Signal transducers and activators of transcription mediate fibroblast growth factor-induced vascular endothelial morphogenesis. Cancer Res. 2009;69:1668–1677. doi: 10.1158/0008-5472.CAN-07-6385. [DOI] [PMC free article] [PubMed] [Google Scholar]
- 58.Montgomery SB, Griffith OL, Sleumer MC, Bergman CM, Bilenky M, Pleasance ED, Prychyna Y, Zhang X, Jones SJ. ORegAnno: an open access database and curation system for literature-derived promoters, transcription factor binding sites and regulatory variation. Bioinformatics. 2006;22:637–640. doi: 10.1093/bioinformatics/btk027. [DOI] [PubMed] [Google Scholar]
Associated Data
This section collects any data citations, data availability statements, or supplementary materials included in this article.