Abstract
13C NMR of isotopically labeled methyl groups has the potential to combine spectroscopic simplicity with ease of labeling for protein NMR studies. However, in most high resolution separated local field experiments, such as polarization inversion spin exchange at the magic angle (PISEMA), that are used to measure 1H–13C hetero-nuclear dipolar couplings, the four-spin system of the methyl group presents complications. In this study, the properties of the 1H–13C hetero-nuclear dipolar interactions of 13C-labeled methyl groups are revealed through solid-state NMR experiments on a range of samples, including single crystals, stationary powders, and magic angle spinning of powders, of 13C3 labeled alanine alone and incorporated into a protein. The spectral simplifications resulting from proton detected local field (PDLF) experiments are shown to enhance resolution and simplify the interpretation of results on single crystals, magnetically aligned samples, and powders. The complementarity of stationary sample and magic angle spinning (MAS) measurements of dipolar couplings is demonstrated by applying polarization inversion spin exchange at the magic angle and magic angle spinning (PISEMAMAS) to unoriented samples.
Keywords: 13C NMR, PISEMA, PDLF, PISEMAMAS, Solid-state NMR, Methyl groups, Alanine
1. Introduction
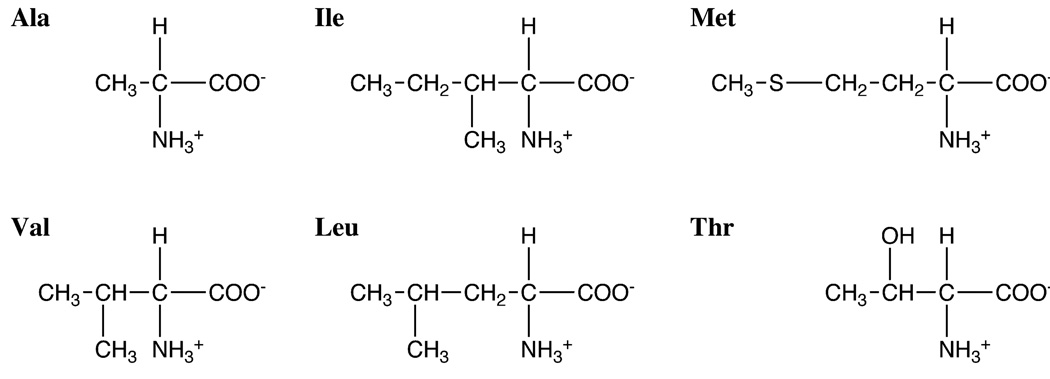
Determining the structures and describing the dynamics of proteins requires a thorough understanding of the spectroscopic properties of the methyl group. Six of the amino acids found in proteins have methyl groups in their side chains; however, they contribute 35–40% of the residues in proteins [1]. Since valine, leucine, and isoleucine each contain two methyl groups, there are typically 60 methyl groups present in every 100 residues of a protein. The structural formulae of the methyl-containing amino acids are shown in Fig. 1. Alanine has the simplest structure; with only a single bond between the Cβ methyl carbon and the Cα-carbon, its methyl group can serve as a direct monitor of the properties of the protein backbone. Valine, leucine, and isoleucine have branched side chains, sulfur-containing methionine has a linear side chain, and threonine contains a hydroxyl group.
Fig. 1.
Chemical structures of the methyl-containing amino acids.
Methyl groups of proteins obtained by expression in bacteria can be readily labeled biosynthetically through direct incorporation of specifically labeled amino acids or through metabolic precursors labeled with 13C and/or 2H in various combinations [2], and this has facilitated both solution NMR and solid-state NMR studies. Many of the earlier solid-state NMR studies utilized 2H NMR of deuterium-labeled methyl groups in unoriented samples to describe protein dynamics [3–6]; and some of the earliest aligned sample solid-state NMR studies of proteins involved the observation of resonances from labeled methyl sites [6].
The methyl group is unique among the side chains moieties in proteins in that it undergoes rapid reorientation about the Cβ–Cα bond axis through three-site hops among equivalent positions under physiological conditions [7], even though the activation energy for methyl-group reorientation in crystalline alanine has been shown to be relatively high at 22.6 kJ/mol [3] due to the close packing of the molecules, which is also likely to be responsible for the absence of axial symmetry in the 13C chemical shift powder pattern unlike most other methyl groups in organic molecules [8–12].
We have recently described our initial solid-state NMR studies of 13C-labeled methyl groups in peptides and proteins that are focused on the anisotropic 13C chemical shift interaction [13]. Here we describe extensions of the spectroscopy to the 1H–13C dipole–dipole interactions of the methyl groups. The goal of this research is to advance the implementation of 1H/13C/15N triple-resonance solid-state NMR experiments on stationary samples beyond that described in our earlier publications [13–24] and that of others [25]. The chemical shift and hetero-nuclear dipolar couplings associated with 13C-labeled methyl groups can contribute to the determination of the complete three-dimensional structures of proteins, including all backbone and side chain sites, that are immobilized in supramolecular assemblies such as virus particles and membranes. In this article, experimental and simulated spectra from single crystal, uniaxially aligned, and unoriented samples in stationary and magic angle spinning (MAS) NMR experiments are integrated to provide a fuller picture of the spectroscopic manifestations of the 1H–13C dipolar couplings in methyl groups. By labeling only the single methyl group in each alanine residue, homonuclear 13C–13C dipolar couplings are minimized, enabling the focus to be on the 1H–13C hetero-nuclear dipolar couplings of interest. The presence of homonuclear 13C/13C dipolar couplings interferes with the experiments on stationary samples, and this may preclude the use of valine, leucine, and isoleucine labeled in both methyl groups in some cases. However, the use of tailored labeling, for example random fractional labeling with 25% 13C [19], provides sufficient isotopic dilution so that each methyl group behaves like an isolated system.
The dipole–dipole couplings between two-spin systems are manifested as doublets in solid-state NMR spectra when they are isolated chemically or through decoupling procedures [27] from surrounding spins. The resulting high spectral resolution and direct structural information available from the splitting between the doublets have led to many studies of 1H–15N and 1H–13C spin systems. The spectral complexities associated with 1H–13C dipolar couplings in the three- and four-spin systems of 13CH2 and 13CH3 groups were observed in some of the earliest separated local field (SLF) experiments [27,28], and have been subsequently analyzed [29] and observed in studies of liquid crystals where natural abundance 13C NMR experiments are feasible [30–32]. This occurs when the magnetization affected by the hetero-nuclear dipolar couplings is on the 13C nucleus, in contrast to experiments where the magnetization is on the 1H nuclei during the critical evolution period. The latter class of experiments is commonly referred to as proton detected local field (PDLF) spectroscopy [33], and we utilize this nomenclature for consistency, even though it is recognized that these are 13C-detection experiments with the feature that the evolution of the 1H–13C dipolar couplings is ‘carried’ by the 1H magnetization during the t1 interval where they are measured in two-dimensional spectra.
2. Results
Alanine is an effective model system for the methyl-containing amino acids in peptides and proteins. As shown in Fig. 1, with only a single methyl group, it has the simplest carbon-containing side chain of an amino acid. The experimental results presented in this section utilize samples of the amino acid alone and incorporated into a protein, and are focused on the 1H–13C hetero-nuclear dipole–dipole interactions of the 13C-labeled methyl groups (13C3-) by relying on resolution of resonances based on anisotropic or isotropic chemical shift differences.
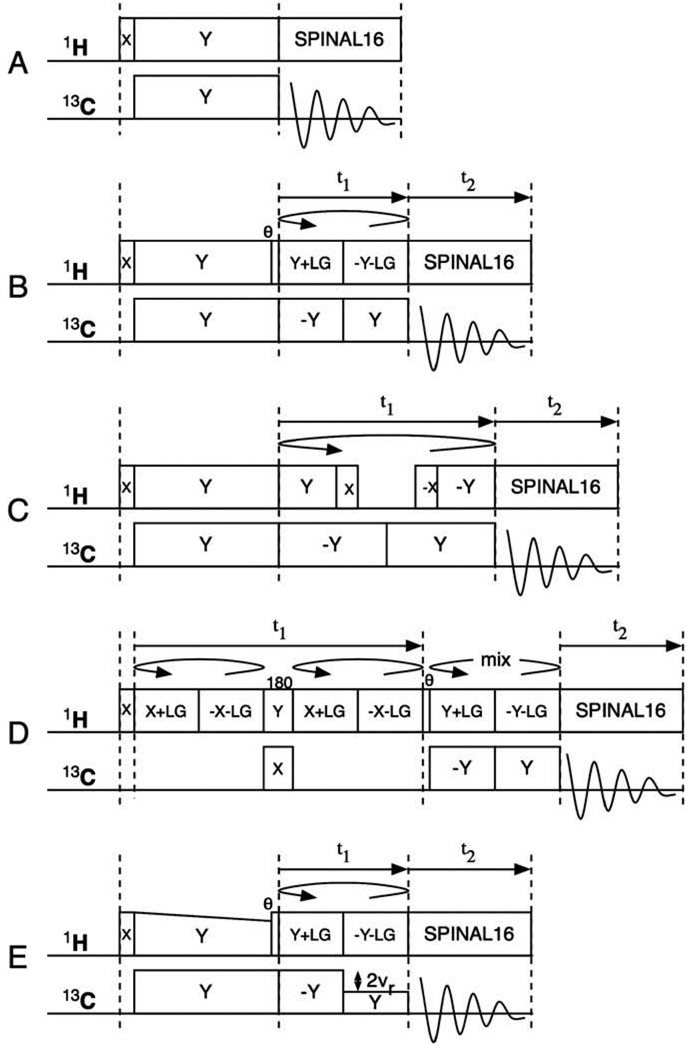
The pulse sequences diagrammed in Fig. 2 can be used to characterize the 13C chemical shift and 1H–13C hetero-nuclear dipole–dipole interactions in 13CH3 groups in stationary samples (Fig. 2A–D), including single crystals, polycrystalline powders, and uniaxially aligned samples, as well as those in samples undergoing magic angle spinning (Fig. 2E).
Fig. 2.
Timing diagrams for the pulse sequences used to obtain 1H/13C solid-state NMR spectra. (A) One-dimensional single-contact spin-lock cross-polarization with SPINAL16 hetero-nuclear decoupling during data acquisition. (B) Two-dimensional PISEMA. (C) Two-dimensional SAMPI4. (D) Two-dimensional PDLF. (E) Two-dimensional PISEMAMAS.
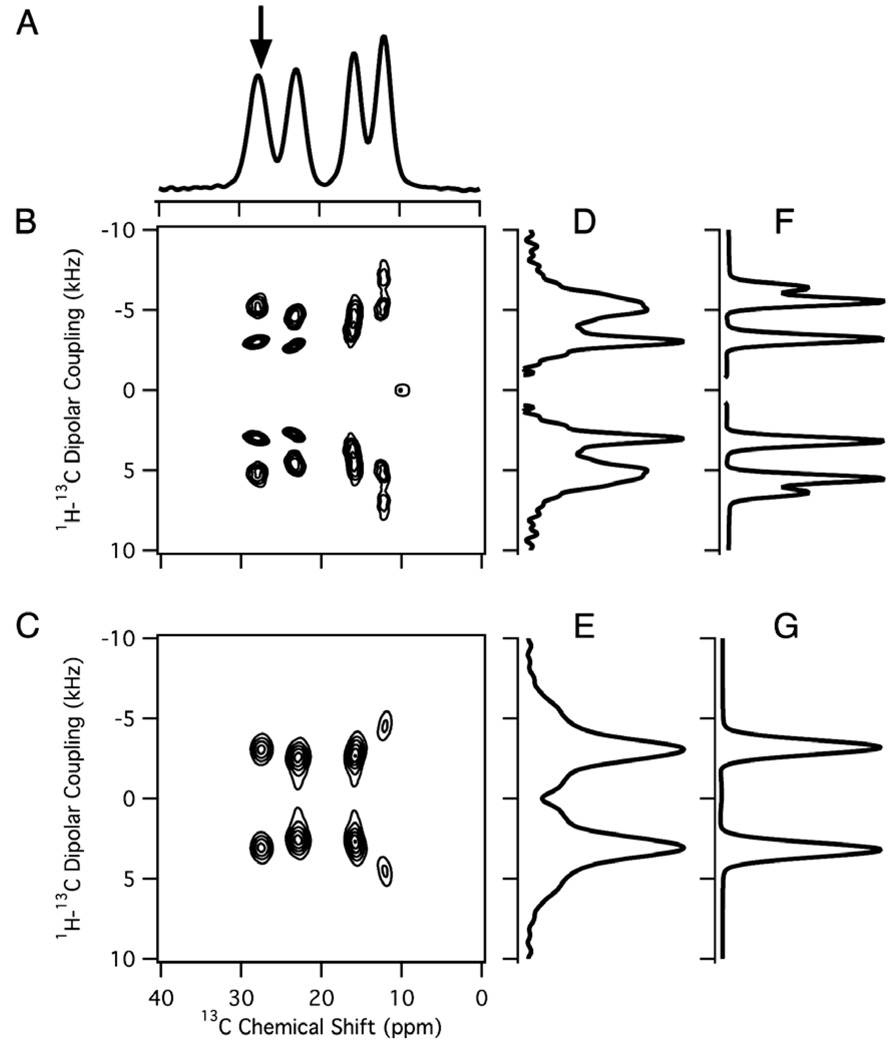
The pulse sequence in Fig. 2A is for a conventional single-contact spin-lock cross-polarization experiment [34]. SPINAL16 modulation is applied to the 1H irradiation during 13C data acquisition in order to have the larger bandwidth of hetero-nuclear decoupling required in high fields [35]. The resulting one-dimensional 13C NMR spectra consist of single-line resonances from each unique 13C3 methyl site in single crystal or uniaxially aligned samples or a powder pattern from unoriented samples. The spectra in Fig. 3 were obtained from a single crystal of 13C3-labeled alanine. The spectrum in Fig. 3A has four single-line resonances associated with the four unique molecules in the unit cell. The chemical shift frequencies are spread over nearly the full range possible, since a polycrystalline sample yields a non-axially symmetric powder pattern with a span of 22 ppm (Fig. 5A).
Fig. 3.
1H/13C solid-state NMR spectra of a stationary sample of a single crystal of 13C3-labeled l-alanine at an arbitrary orientation relative to the direction of the magnetic field. (A) One-dimensional 1H decoupled 13C NMR spectrum obtained using the pulse sequence in Fig. 2A. (B) Two-dimensional 1H–13C PISEMA spectrum obtained using the pulse sequence in Fig. 2B. (C) Two-dimensional 1H–13C PDLF spectrum obtained using the pulse sequence in Fig. 2D. (D,E) One-dimensional spectral slices along the 1H–13C dipolar coupling frequency dimension at the 13C chemical shift frequency marked with an arrow in the one-dimensional spectrum in (A). (F,G) The corresponding simulated spectra with a dipolar coupling of 3.2 kHz.
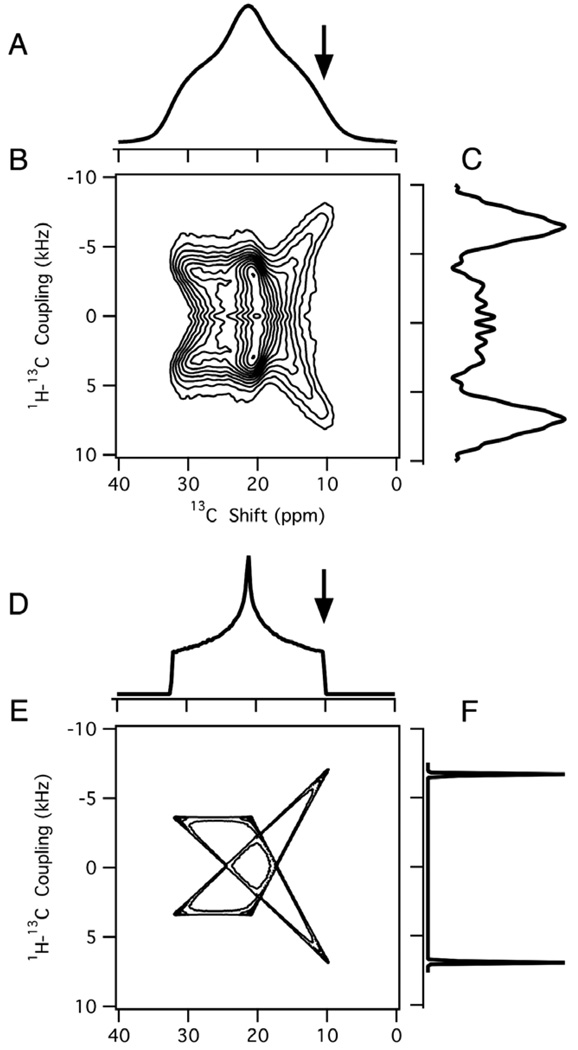
Fig. 5.
1H/13C solid-state NMR spectra of a stationary unoriented (powder) sample of polycrystalline sample of 13C3 labeled alanine. (A–C) Experimental spectra. (D–F) Simulated spectra. (A,D) One-dimensional 1H decoupled 13C NMR spectra. (B,E) Two-dimensional 1H–13C PDLF spectra. (C,F) One-dimensional spectral slices along the 1H–13C dipolar coupling frequency dimension at the 13C chemical shift frequency marked with arrows in (A,D). D//, which corresponds to the dipolar coupling with the three-site jump axis of the 13CH3 group parallel to the external magnetic field measured from the experimental spectrum in (C) is 6.95 kHz.
Separated local field experiments enable the hetero-nuclear dipole–dipole couplings associated with sites with different chemical shifts to be observed [26]. The most commonly used experiments are polarization inversion spin exchange at the magic angle (PISEMA) (Fig. 2B) [36] and SAMPI4 (Fig. 2C) [37] because they provide high resolution in both the chemical shift and dipolar coupling frequency dimensions. The majority of applications of these experiments to proteins have focused on 1H–15N amide and 1H–13Cα sites in the backbone of proteins where the hetero-nuclear dipolar couplings of these two-spin systems are observed as doublets in two- and three-dimensional spectra. However, the situation is more complex for the hetero-nuclear dipolar couplings in 13CH3 groups; as shown in the two-dimensional spectrum in Fig. 3B, multiple peaks in the dipolar coupling frequency dimension are associated with each 13C chemical shift frequency. Experimental and simulated spectral slices through one of the 13C chemical shift frequencies (arrow) are aligned along the 1H–13C dipolar coupling axis in Fig. 3D and F. Although of spectroscopic interest, the complex line shapes are a considerable hindrance to the design and execution of experiments on proteins with multiple 13C labeled methyl groups.
An alternative approach to the observation of 1H–13C dipolar couplings is with PDLF [33] (Fig. 2D). In this experiment, the 1H magnetization (not the 13C magnetization) evolves during the t1 period under the influence of 1H–13C dipolar couplings; at the end of t1, the 1H magnetization is selectively transferred to the directly bonded 13C. Frequency switched Lee Goldburg irradiation (FSLG) [38,39] is utilized during both the t1 period and the transfer to ensure selectivity. Finally, the 1H decoupled 13C magnetization is directly detected during the t2 period. In Fig. 2D, the π pulse on the 1H channel refocuses the 1H chemical shift evolution and the π pulse on the 13C channel recouples the 1H–13C dipolar coupling during the t1 period. The phases of the FSLG irradiation during evolution in t1 are orthogonal to the initial 1H magnetization, while the phase during the mix period are such that the 1H magnetization is aligned along the FSLG axis. This necessitates phase shifting the FSLG irradiation and inserting a 35.3° pulse during the interval between the t1 interval and the mix period.
Essential features of the 1H–13C dipole–dipole interactions in a methyl group are illustrated by the spectra in Fig. 3. The four distinct 13C resonances with chemical shifts of 27.6, 23.0, 15.7, and 11.9 ppm indicate that there are four unique molecules in the unit cell of the crystal. Fig. 3D and F are spectral slices along the 1H–13C dipolar coupling dimension for the peak at 27.6 ppm. These spectra are more complex than the corresponding ones from two-spin 1H–13C systems. Not only are the resonances in Fig. 3B multiplets rather than doublets in this four-spin system, but also the rapid three-site jump motion about the Cα–Cβ bond axis averages the 1H–13C dipolar coupling to approximately one-third of its rigid lattice value. The three 1H–13C dipolar couplings in the spin system are identical (Davg) and are related to the three-site jump axis by the equation:
θ′ is the angle between the 1H–13C bond and the three-site jump axis; for alanine this is the bond between Cα and Cβ. D is the dipolar coupling if no three-site jump motion exists and can be calculated using:
θ is the angle between the external magnetic field and the C–H bond or the three-site jump axis in the presence of motion, and D// is the dipolar coupling when the bond axis is parallel to the magnetic field and can be calculated directly from the C–H bond length.
Fig. 3F and G are simulated spectra for a four-spin spin system with three identical 1H–13C dipolar couplings (Davg). Lorentzian line broadening of 730 Hz in Fig. 3F and 1050 Hz in Fig. 3G are applied to the simulated spectra in order to approximately match the line widths and appearance of the experimental spectra in Fig. 3D and E. Simulation of the results of a PISEMA experiment (Fig. 3F) results in a triplet with peaks at Davg, 1.7Davg, and 2Davg. The signals at 1.7Davg and 2Davg are not resolved in the experimental spectrum (Fig. 3D) and appear as a single broadened peak.
The comparison between the one- and two-dimensional spectra in Fig. 3A, D, and F resulting from PISEMA and those in Fig. 3C, E, and G from PDLF demonstrate the spectral simplifications that result from evolution of the dipolar couplings through modulation of the 1H magnetization. The two-dimensional PDLF spectrum in Fig. 3D has a four sets of resolved doublets; each provides unique 13C chemical shift and 1H–13C dipolar coupling frequencies for the methyl group of an alanine molecule in the unit cell of the crystal. The simulated and experimental PDLF spectral slices shown in Fig. 3G and F, respectively, consist of a simple doublet, characterized by Davg.
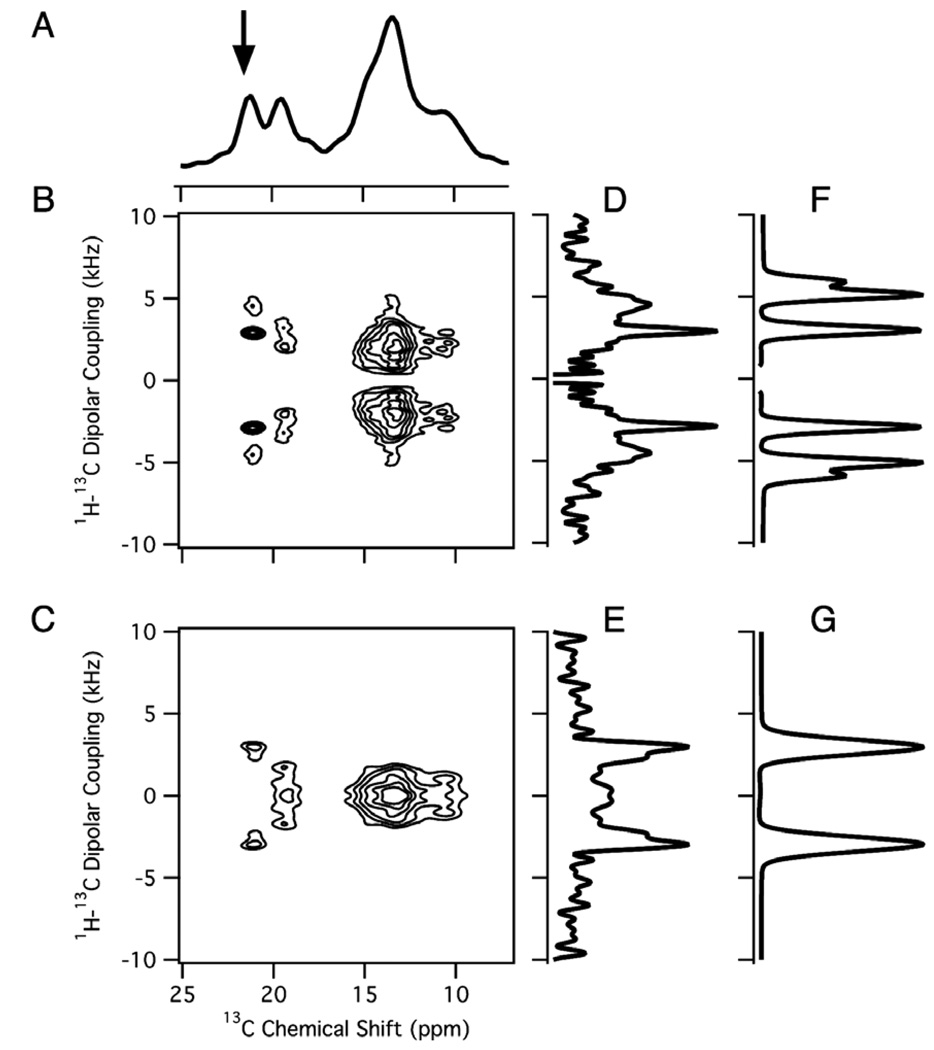
In Fig. 4, the same spectroscopic features observed for a single crystal of alanine are found in the spectra of the 13C3-alanine labeled coat protein subunits of the filamentous bacteriophage Pf1 aligned by the magnetic field. The seven alanines in the 46-residue protein are distributed throughout the sequence at positions 7, 11, 22, 29, 34, 36 and 46. Approximately five distinct signals or features can be observed in the one-dimensional 13C NMR spectrum in Fig. 4A with apparent 13C chemical shifts of 21.1, 19.4, 14.6, 13.4, and 10.5 ppm. Based on intensity comparisons and line shapes the peak marked with an arrow at 21.1 ppm is from a single methyl group, and this frequency is selected for the display and analysis of spectral slices in Fig. 4F and G. The spectrum in Fig. 4B was obtained with the SAMPI4 pulse sequence and that in Fig. 4C was obtained with the PDLF sequence.
Fig. 4.
1H/13C solid-state NMR spectra of a stationary sample of 13C3-alanine-labeled Pf1 bacteriophage aligned in the magnetic field. There are seven labeled alanine residues in the coat protein. (A) One-dimensional 1H decoupled 13C NMR spectrum. (B) Two-dimensional 1H–13C SAMPI4 spectrum. (C) Two-dimensional 1H–13C PDLF spectrum. (D,E) One-dimensional spectral slices along the 1H–13C dipolar coupling frequency dimension at the 13C chemical shift frequency marked with an arrow in the one-dimensional spectrum in (A). (F,G) The corresponding simulated spectra with a dipolar coupling of 3.0 kHz.
The one-dimensional 13C chemical shift powder pattern in Fig. 5A was obtained from a polycrystalline sample of 13C3 labeled alanine. The principal values of the chemical shift tensor, σ11, σ22, and σ33, have measured values of 10, 21, and 32 ppm, respectively, from these experimental data. The two-dimensional 1H–13C hetero-nuclear dipolar coupling/13C chemical shift powder pattern in Fig. 5B was obtained using PDLF. The best-fit simulations of the one- and two-dimensional powder patterns are shown in Fig. 5D and E. In these simulations, the 13CH3 group is treated as a pseudo 13C–H group due to the three-site jump motion; D//,avg, the averaged dipolar coupling with the three-site jump axis parallel to the external magnetic field, is 6.95 kHz as measured from the splitting in Fig. 5C. The simulation in Fig. 5E places the three-site jump axis (Cα–Cβ) along the chemical shift principal axis σ11. The scaling of the dipolar couplings due to the three-site jump is determined by the angle between the 1H–13C bonds and the three-site jump axis. We find the scaling of the dipolar coupling to be 0.298 based on the methyl C–H bond length of 1.096 Å [40] which yields D// of 23.30 kHz. This result is consistent with the scaling of 0.303 found in an earlier study based on the quadrupolar splitting of deuterium labeled alanine [3]. For tetrahedral geometry the scaling would be 0.333. The discrepancy between this and the measured values has been attributed to the methyl group departing slightly from tetrahedral geometry.
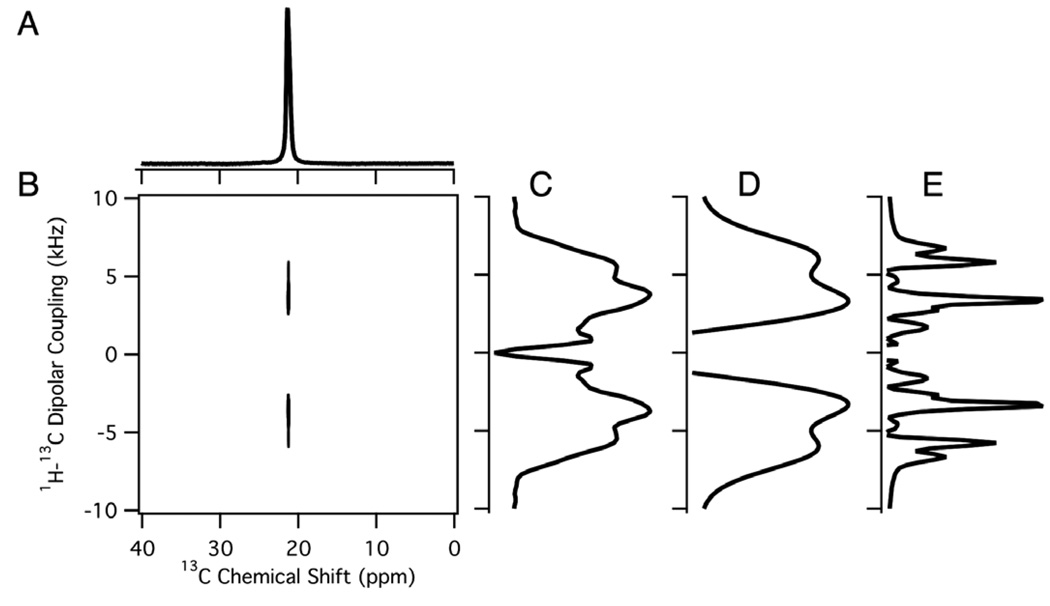
Magic angle spinning experiments are complementary to those performed on stationary samples. They enable hetero-nuclear dipolar coupling measurements to be performed on powder samples with resolution among sites based on isotropic chemical shift differences [41]. For example, the two-dimensional spectrum shown in Fig. 6B correlates the recoupled dipolar coupling and the isotropic chemical shift for the 13C labeled methyl group in polycrystalline alanine. The one-dimensional 1H–13C dipolar spectrum obtained from the two-dimensional data is shown in Fig. 6C. Because of limited spectral resolution, only four out of the six singularities present in the simulated PISEMA spectrum (Fig. 6E) are observed. This is apparent when line broadening is added to the simulated spectrum in Fig. 6D. The magnitude of the dipolar coupling measured as the frequency difference between the inner peaks was used to analyze the experimental data. The 1H–13C dipolar coupling was found to be approximately 7 kHz in this MAS experiment using a theoretical scaling factor of 0.57, which is comparable to that found on this and other proteins using similar MAS experimental methods [42–45,47]. This is consistent with the value measured in the stationary experiments, which have higher precision due to the relatively narrower line widths in the dipolar coupling dimension.
Fig. 6.
Magic angle spinning spectra of 13C3 labeled polycrystalline alanine. (A) One-dimensional isotropic chemical shift spectrum. (B) Two-dimensional 1H–13C PISEMAMAS spectrum. (C) Dipolar slice extracted from the two-dimensional spectrum. (D,E) Simulated dipolar spectra for a dipolar coupling of 7 kHz for each 13C-1H pair in a three proton and one carbon spin-system. (D) Simulated dipolar spectrum with added line broadening corresponding to 2.5 kHz for comparison with the experimental spectrum. (E) Simulated dipolar spectrum with added line broadening of 0.4 kHz to indicate fine structure.
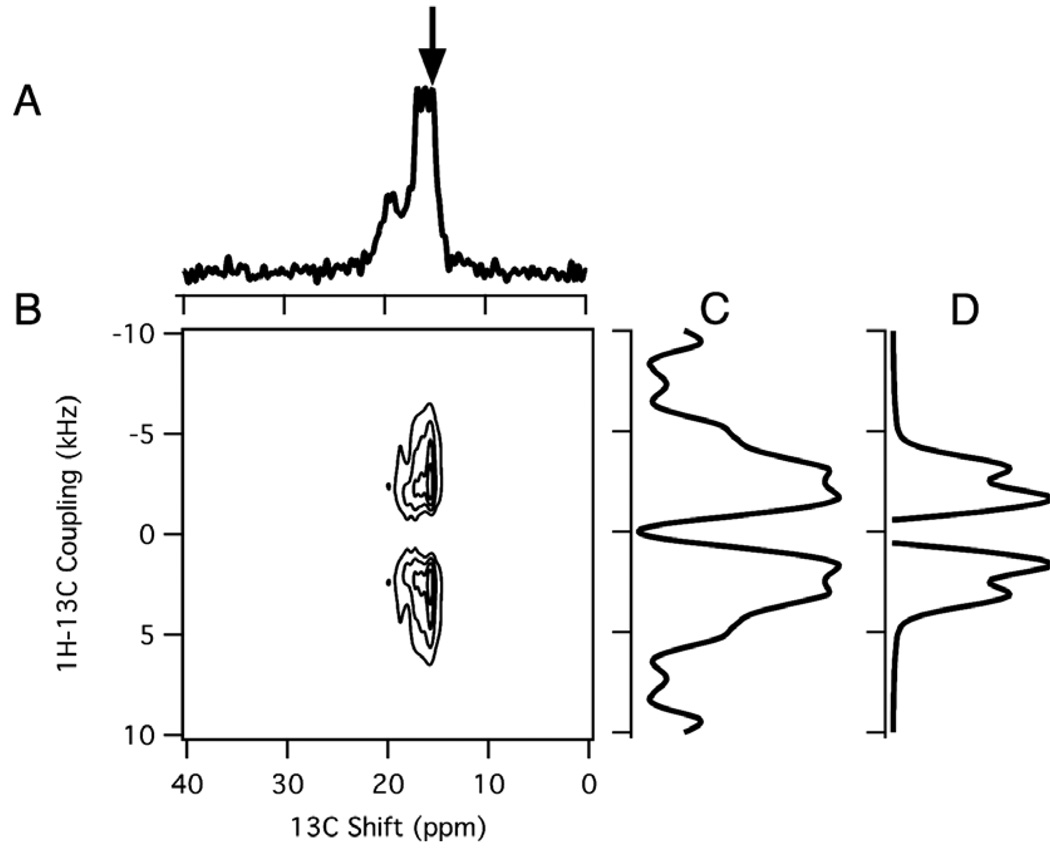
The magic angle spinning experiments were also applied to an unoriented sample of the 13C3 alanine labeled coat protein of Pf1 bacteriophage. This filamentous bacteriophage consists of ~7300 subunits of the small 46-residue coat protein in a helical array around an extended, circular single-stranded DNA molecule of 7349 nt [42,46]. We have previously determined the three-dimensional structure of the coat protein in bacteriophage particles using aligned sample solid-state NMR spectroscopy [46]. McDermott and coworkers [45,47] have described complementary studies of the same bacteriophage in unoriented samples by MAS solid-state NMR. A two-dimensional spectrum of the protein is shown in Fig. 7B. The seven partially resolved resonances are dispersed between 15.35 ppm and 21 ppm in the isotropic chemical shift spectrum (Fig. 7A). The dipolar slice taken at the chemical shift of 15.35 ppm (arrow) is shown in Fig. 7C. For comparison, a simulated dipolar spectrum is shown in Fig. 7D. Five chemical shift frequencies can be discerned in the spectrum, enabling dipolar couplings to be measured, which range from 2.7 kHz for the resonance at 18 ppm to 3.3 kHz for that at 15.35 ppm.
Fig. 7.
Magic angle spinning spectra of 13C3 alanine labeled Pf1 bacteriophage. (A) One-dimensional isotropic chemical shift spectrum. (B) Two-dimensional 1H–13C PISEMAMAS spectrum. (B) Two-dimensional PISEMAMAS spectrum. (C) Dipolar slice at the 15.35 ppm frequency marked by the arrow in the one-dimensional spectrum. (D) Simulated dipolar spectrum for a 1H–13C dipolar coupling of 3.3 kHz with added linebroadening corresponding to 1.1 kHz for comparison with the experimental spectrum.
3. Discussion
Two-dimensional separated local field spectra provide two orientationally dependent frequencies for each atomic site. Not only are these frequencies valuable constraints for structure calculations, but also they provide high spectral resolution. Most applications to proteins have involved two-spin systems either 1H–15N amide or 1H–13Cα for polypeptide backbone sites. In extending the approach to all backbone and side chain sites in 13C and 15N labeled proteins, the spectral complexities of three and four-spin systems must be dealt with. Here we describe initial studies of the dipolar couplings of 13C labeled methyl groups in the amino acid alanine alone and incorporated biosynthetically into a protein.
The comparison of the experimental and simulated spectra in Fig. 3 (alanine) and Fig. 4 (Pf1 coat protein) show that the PDLF experiment enables high-resolution spectra to be obtained with simple doublets for the methyl dipolar couplings. As demonstrated with the data in Fig. 5, the PDLF experiment also allows the direct analysis of two-dimensional powder patterns, which would otherwise be extremely complex and overlapped.
Proteins in supramolecular structures are challenging systems to study by NMR, and as much flexibility as possible is needed in the preparation of samples in order to ensure that they retain their native structures and full activities during the course of the experiments. In some cases it is undesirable or impossible to prepare aligned samples, in which case unoriented or powder samples must be utilized. Since the dipolar couplings can be recoupled in magic angle spinning experiments, it is possible to extend the analysis to unoriented samples where the individual atomic sites are resolved on the basis of their isotropic chemical shift differences. The comparison of the data in Figs. 3, 5 and 7 demonstrate the ability of these experiments to be applied to 13C methyl groups in stationary single crystal and powder samples and spinning powder samples. Similarly, the comparison between the data in Figs. 4 and 7 demonstrate that it is possible to measure the dipolar couplings for individual methyl groups in both aligned and unoriented samples. The 22 ppm span of the 13C methyl chemical shift tensor is fairly small, thus the simplified dipolar splittings will play an important role in resolving among the resonances from the methyl sites in larger or more highly labeled proteins.
These results demonstrate that the four-spin system of 13C labeled methyl groups present in many of the amino acids in proteins can be studied by solid-state NMR with both aligned sample and magic angle spinning approaches. This contributes to the development of a general approach to structure determination of proteins that includes all backbone and side chain sites through 1H/13C/15N triple resonance experiments.
4. Methods
The stationary experiments were performed on a Bruker Avance spectrometer interfaced to a Magnex magnet operating at a field strength corresponding to 1H and 13C resonance frequencies of 801.6 MHz and 201.6 MHz. A home-built 1H/13C double resonance probe that incorporates a strip-shield to reduce RF heating with high conductivity biological samples was utilized [48]. The 13C chemical shift frequencies are referenced to external tetramethylsilane (TMS) at 0 ppm by assigning the chemical shift of the 13CH2 resonance of adamantane (25 °C) a value of 38.47 ppm. The spectra in Fig. 3 were obtained on a 21 mg 13C-methyl labeled alanine crystal placed at an arbitrary orientation in the sample coil. 13C3-labeled l-alanine was obtained from Cambridge Isotope Laboratories (www.isotope.com). The B1 field strengths for both the 1H and 13C channels were matched at 48 kHz. The cycle time for each FSLG increment was 34.0 µs and the jump frequency was ±33961.8 Hz. The PISEMA spectrum was acquired with 4 scans and 96 t1 points using a 5 s recycle delay. The scaling factor for the PISEMA spectrum is assumed to be the theoretical value of 0.82. The PDLF spectrum was acquired with 8 scans and 32 t1 points. The scaling factor for the FSLG multiple pulse sequence in the PDLF experiment was determined experimentally to be 0.52 from a series of HETCOR experiments performed as a function of 1H carrier frequency offset. The simulations in Fig. 3F and G were carried out using the program SIMPSON [49]. A four-spin system (one 13C, and three 1H) was constructed with three identical C–H dipolar couplings at 3.2 kHz. All nuclei are assumed to be irradiated on-resonance.
The spectra in Fig. 4 were obtained on a 13C3-alanine labeled sample of Pf1 bacteriophage. The concentration of the Pf1 sample was approximately 30 mg/mL and the pH was 8, which are compatible with alignment of the filamentous particles by the magnetic field. The B1 field strengths for both channels were matched at 53.7 kHz. The cycle time for each FSLG increment was 30.4 µs and the jump frequency was ±37983.6 Hz. The spectra were acquired with a 5 s recycle delay. The PDLF spectrum was acquired with 192 scans and 48 t1 points. The SAMPI4 spectrum is acquired with 192 scans and 48 t1 points. The simulations in Fig. 4F and G are similar to the simulation in Fig. 3 except that the 13C–1H dipolar coupling is 3.0 kHz.
The experimental spectra in Fig. 5 were obtained on a polycrystalline sample of 13C3 labeled alanine. The B1 field strengths for both channels were matched at 52.7 kHz. The cycle time for each FSLG increment was 31.0 µs and the jump frequency was ±37248.4 Hz. The spectra were acquired with a 5 s recycle delay. The PDLF spectrum was acquired with 4 scans and 48 t1 points. The chemical shift frequencies used in the simulations in Fig. 5D and E were obtained from the spectrum in Fig. 5A. Two angles are needed to define the relative orientation of the dipolar coupling vector and the chemical shift tensor. In the simulations, the external magnetic field orientations were generated randomly using 106 iterations for each two-dimensional spectrum. The best-fit simulation is presented in Fig. 5E. The magic angle spinning experiments were performed on a Bruker Avance spectrometer interfaced to a Magnex magnet operating at a field strength corresponding to 1H and 13C resonance frequencies of 749.277 MHz and 188.414 MHz. A Bruker 4 mm 1H/13C/15N triple resonance MAS probe was used for these experiments. The data in Fig. 6 were obtained on a polycrystalline sample of 13C3 labeled alanine. The two-dimensional spectrum in Fig. 6B was obtained by recoupling the dipolar coupling [50,51] using the pulse sequence diagrammed in Fig. 2E. The spinning speed was maintained to 11,111 Hz. The field strength of the B1 fields was 50 kHz during cross polarization, as well as for homonuclear and hetero-nuclear decoupling irradiations. During the hetero-nuclear dipolar recoupling periods, the Hartmann–Hahn matching conditions were met by varying the amplitude of the irradiation on the 13C channel in order to match the first order spinning side bands. The Hartmann–Hahn matching conditions were met for the +1 and −1 spinning sidebands with synchronized phase switching, which results in a scaling factor of 0.57. Homonuclear dipolar decoupling among protons is accomplished with the FSLG irradiation. Continuous wave irradiation with field strength of 50 kHz and correspondingly 35 kHz proton offset were used to achieve Lee–Goldburg decoupling for protons. An effective nutation frequency of 61 kHz was calculated for the 1H channel, and accordingly the 13C irradiation amplitudes were varied from to kHz during the +LG and −LG blocks, respectively. The simulated dipolar spectra were calculated using SIMPSON using 7 kHz dipolar coupling for each of the 13C–1H spin pairs in the four-spin system. The two-dimensional spectrum was acquired with 4 scans, 62 t1 increments, and a 5 s recycle delay. A dwell time of 32.66 µs for FSLG period was set for each t1 increment. The final data matrix with 4096 × 256 points was Fourier transformed after a sine bell window function was applied in the f1 dimension for data processing.
The spectra shown in Fig. 7 were obtained from a concentrated solution containing Pf1 bacteriophage. The two-dimensional spectrum was obtained using the modified PISEMA pulse scheme and experimental conditions similar to those described above for the polycrystalline alanine sample. The sample temperature was maintained at 30 °C. The pH of the sample was 8 and the high 80 mg/ml sample concentration ensured that the sample was not aligned by the magnetic field. Fifty microliters of sample was confined to the middle of the 4 mm rotor by utilizing spacers. Chemical shifts were referenced to external TMS as described above. A total of 32 transients with 6 s recycle delay and 16 t1 increments were used to acquire the two-dimensional PISEMAMAS data. The final matrix with 2048 × 256 points was Fourier transformed with no window functions applied.
Acknowledgments
We thank Fabio Casagrande for preparing the alanine crystal. This research was supported by grants from the National Institutes of Health, and it utilized the Biomedical Technology Resource for NMR Molecular Imaging of Proteins at the University of California San Diego, which is supported by grant P41EB002031.
References
- 1.Gerstein M. A structural census of genomes: comparing bacterial, eukaryotic, and archaeal genomes in terms of protein structure. J. Mol. Biol. 1997;274:562–576. doi: 10.1006/jmbi.1997.1412. [DOI] [PubMed] [Google Scholar]
- 2.Tugarinov V, Kanelis V, Kay LE. Isotope labeling strategies for the study of high-molecular-weight proteins by solution NMR spectroscopy. Nat. Protocols. 2006;1:749–754. doi: 10.1038/nprot.2006.101. [DOI] [PubMed] [Google Scholar]
- 3.Batchelder LS, Niu CH, Torchia DA. Methyl reorientation in polycrystalline amino acids and peptides: a deuteron NMR spin–lattice relaxation study. J. Am. Chem. Soc. 1983;105:2228–2231. [Google Scholar]
- 4.Colnago LA, Valentine KG, Opella SJ. Dynamics of fd coat protein in the bacteriophage. Biochemistry. 1987;26:847–854. doi: 10.1021/bi00377a028. [DOI] [PubMed] [Google Scholar]
- 5.Leo GC, Colnago LA, Valentine KG, Opella SJ. Dynamics of fd coat protein in lipid bilayers. Biochemistry. 1987;26:854–862. doi: 10.1021/bi00377a029. [DOI] [PubMed] [Google Scholar]
- 6.Keniry MA, Kintanar A, Smith RL, Gutowsky HS, Oldfield E. Nuclear magnetic resonance studies of amino acids and proteins. Deuterium nuclear magnetic resonance relaxation of deuteriomethyl-labeled amino acids in crystals and in Halobacterium halobium and Escherichia coli cell membranes. Biochemistry. 2002;23:288–298. doi: 10.1021/bi00297a018. [DOI] [PubMed] [Google Scholar]
- 7.Andrew ER, Green TJ, Hoch MJR. Solid-state proton relaxation of biomolecular components. J. Magn. Reson. 1978;29(1969):331–339. [Google Scholar]
- 8.Pines A, Gibby MG, Waugh JS. Proton-enhanced NMR of dilute spins in solids. J. Chem. Phys. 1973;59:569–590. [Google Scholar]
- 9.Ye C, Fu R, Hu J, Hou L, Ding S. Carbon-13 chemical shift anisotropies of solid amino acids. Magn. Reson. Chem. 1993;31:699–704. [Google Scholar]
- 10.Chan JCC, Tycko R. Recoupling of chemical shift anisotropies in solid-state NMR under high-speed magic-angle spinning and in uniformly 13C-labeled systems. J. Chem. Phys. 2003;118:8369–8378. [Google Scholar]
- 11.Veeman WS. C-13 Chemical-shift tensors in organic single-crystals. Philos. Trans. Roy. Soc. Lond. Ser. A—Math. Phys. Eng. Sci. 1981;299:629–641. [Google Scholar]
- 12.Duma L, Hediger S, Lesage A, Sakellariou D, Emsley L. Carbon-13 lineshapes in solid-state NMR of labeled compounds. Effects of coherent CSA-dipolar cross-correlation. J. Magn. Reson. B. 2003;162:90–101. doi: 10.1016/s1090-7807(02)00174-x. [DOI] [PubMed] [Google Scholar]
- 13.Wu CH, Das B, Opella SJ. Manifestations of the anisotropic 13C chemical shift of methyl groups in solid-state NMR spectra of peptides and proteins. In: Khetrapal CL, editor. Future Directions of Magnetic Resonance. Springer Verlag; in press. [Google Scholar]
- 14.Schneider DM, Tycko R, Opella SJ. High-resolution solid-state triple nuclear magnetic resonance measurement of 13C–15N dipole–dipole couplings. J. Magn. Reson. 1969;73:568–573. (1987) [Google Scholar]
- 15.Gu Z, Opella SJ. Three-dimensional 13C shift/1H–15N coupling/15N shift solid-state NMR correlation spectroscopy. J. Magn. Reson. 1999;138:193–198. doi: 10.1006/jmre.1999.1709. [DOI] [PubMed] [Google Scholar]
- 16.Gu ZT, Opella SJ. Two- and three-dimensional 1H/13C PISEMA experiments and their application to backbone and side chain sites of amino acids and peptides. J. Magn. Reson. 1999;140:340–346. doi: 10.1006/jmre.1999.1825. [DOI] [PubMed] [Google Scholar]
- 17.Sinha N, Grant CV, Rotondi KS, Feduik-Rotondi L, Gierasch LM, Opella SJ. Peptides and the development of double- and triple-resonance solid-state NMR of aligned samples. J. Pept. Res. 2005;65:605–620. doi: 10.1111/j.1399-3011.2005.00262.x. [DOI] [PubMed] [Google Scholar]
- 18.Sinha N, Filipp FV, Jairam L, Park SH, Bradley J, Opella SJ. Tailoring 13C labeling for triple-resonance solid-state NMR experiments on aligned samples of proteins. Magn. Reson. Chem. 2007;45:s107–s115. doi: 10.1002/mrc.2121. [DOI] [PMC free article] [PubMed] [Google Scholar]
- 19.Sinha N, Grant CV, Park SH, Brown JM, Opella SJ. Triple resonance experiments for aligned sample solid-state NMR of 13C and 15N labeled proteins. J. Magn. Reson. 2007;186:51–64. doi: 10.1016/j.jmr.2007.01.014. [DOI] [PMC free article] [PubMed] [Google Scholar]
- 20.Wu CH, Opella SJ. Shiftless nuclear magnetic resonance spectroscopy. J. Chem. Phys. 2008;128:052312–052315. doi: 10.1063/1.2816786. [DOI] [PMC free article] [PubMed] [Google Scholar]
- 21.Wu CH, Opella SJ. Proton-detected separated local field spectroscopy. J. Magn. Reson. 2008;190:165–170. doi: 10.1016/j.jmr.2007.10.002. [DOI] [PMC free article] [PubMed] [Google Scholar]
- 22.Ramanathan KV, Opella SJ. High-resolution solid-state 13C–14N and 13C–15N heteronuclear correlation spectroscopy. J. Magn. Reson. 1990;86(1969):227–235. [Google Scholar]
- 23.Tan WM, Gu Z, Zeri AC, Opella SJ. Solid-state NMR triple-resonance backbone assignments in a protein. J. Biomol. NMR. 1999;13:337–342. doi: 10.1023/a:1008379105545. [DOI] [PubMed] [Google Scholar]
- 24.Fillip FV, Sinha N, Jairam L, Bradley J, Opella SJ. Labeling strategies for 13C-detected aligned-sample solid-state NMR of proteins. J. Magn. Reson. doi: 10.1016/j.jmr.2009.08.012. doi: 10.1016/j.jmr.2009.08.012. [DOI] [PMC free article] [PubMed] [Google Scholar]
- 25.Ishii Y, Tycko R. Multidimensional heteronuclear correlation spectroscopy of a uniformly 15N- and 13C-labeled peptide crystal: toward spectral resolution, assignment, and structure determination of oriented molecules in solid-state NMR. J. Am. Chem. Soc. 2000;122:1443–1455. [Google Scholar]
- 26.Waugh JS. Uncoupling of local field spectra in nuclear magnetic resonance. Determination of atomic position in solids. Proc. Natl. Acad. Sci. USA. 1976;73:1394–1397. doi: 10.1073/pnas.73.5.1394. [DOI] [PMC free article] [PubMed] [Google Scholar]
- 27.Opella SJ, Waugh JS. Two-dimensional 13C NMR of highly oriented polyethylene. J. Chem. Phys. 1977;66:4919–4924. [Google Scholar]
- 28.Rybaczewski EF, Neff BL, Waugh JS, Sherfinski JS. High resolution 13C NMR in solids: 13C local fields of CH, CH2, and CH3. J. Chem. Phys. 1977;67:1231–1236. [Google Scholar]
- 29.Gan ZH. Spin dynamics of polarization inversion spin exchange at the magic angle in multiple spin systems. J. Magn. Reson. 2000;143:136–143. doi: 10.1006/jmre.1999.1971. [DOI] [PubMed] [Google Scholar]
- 30.Hong M, Pines A, Caldarelli S. Measurement and assignment of long-range C–H dipolar couplings in liquid crystals by two-dimensional NMR spectroscopy. J. Phys. Chem. 1996;100:14815–14822. [Google Scholar]
- 31.Dvinskikh SV, Yamamoto K, Ramamoorthy A. Heteronuclear isotropic mixing separated local field NMR spectroscopy. J. Chem. Phys. 2006;125 doi: 10.1063/1.2212939. 034507. [DOI] [PubMed] [Google Scholar]
- 32.Dvinskikh SV, Sandstr̂m D, Zimmermann H, Maliniak A. Carbon-13 NMR spectroscopy applied to columnar liquid crystals. Prog. Nuclear Magn. Reson. Spectrosc. 2006;48:85–107. [Google Scholar]
- 33.Schmidt-Rohr K, Nanz D, Emsley L, Pines A. NMR measurement of resolved heteronuclear dipole couplings in liquid crystals and lipids. J. Phys. Chem. 1994;98:6668–6670. [Google Scholar]
- 34.Pines A, Waugh JS, Gibby MG. Proton-enhanced nuclear induction spectroscopy—method for high-resolution NMR of dilute spins in solids. J. Chem. Phys. 1972;56:1776–1777. [Google Scholar]
- 35.Sinha N, Grant CV, Wu CH, De Angelis AA, Howell SC, Opella SJ. SPINAL modulated decoupling in high field double- and triple-resonance solid-state NMR experiments on stationary samples. J. Magn. Reson. 2005;177:197–202. doi: 10.1016/j.jmr.2005.07.008. [DOI] [PubMed] [Google Scholar]
- 36.Wu CH, Ramamoorthy A, Opella SJ. High-resolution heteronuclear dipolar solid-state NMR spectroscopy. J. Magn. Reson. A. 1994;109:270–272. [Google Scholar]
- 37.Nevzorov AA, Opella SJ. Selective averaging for high-resolution solid-state NMR spectroscopy of aligned samples. J. Magn. Reson. 2007;185:59–70. doi: 10.1016/j.jmr.2006.09.006. [DOI] [PubMed] [Google Scholar]
- 38.Goldburg WI, Lee M. Nuclear magnetic resonance line narrowing by a rotating RF field. Phys. Rev.Lett. 1963;11:255–258. [Google Scholar]
- 39.Bielecki A, Kolbert AC, Levitt MH. Frequency-switched pulse sequences: homonuclear decoupling and dilute spin NMR in solids. Chem. Phys. Lett. 1989;155:341–346. [Google Scholar]
- 40.Lehmann MS, Koetzle TF, Hamilton WC. Precision neutron-diffraction structure determination of protein and nuclei-acid components. 1. Crystal and molecular structure of amino acid l-alanine. J. Am. Chem. Soc. 1972;94:2657–2660. doi: 10.1021/ja00763a016. [DOI] [PubMed] [Google Scholar]
- 41.Ramamoorthy A, Opella SJ. Two-dimensional chemical shift/heteronuclear dipolar coupling spectra obtained with polarization inversion spin exchange at the magic angle and magic-angle sample spinning (PISEMAMAS) Sol. State Nuclear Magn. Reson. 1995;4:387–392. doi: 10.1016/0926-2040(95)00054-t. [DOI] [PubMed] [Google Scholar]
- 42.Lorieau J, McDermott AE. Order parameters based on (CH)–C-13–H-1, (CH2)–C-13–H-1 and (CH3)–C-13–H-1 heteronuclear dipolar powder patterns: a comparison of MAS-based solid-state NMR sequences. Magn. Reson. Chem. 2006;44:334–347. doi: 10.1002/mrc.1773. [DOI] [PubMed] [Google Scholar]
- 43.Lorieau JL, McDermott AE. Conformational flexibility of a microcrystalline globular protein: order parameters by solid-state NMR spectroscopy. J. Am. Chem. Soc. 2006;128:11505–11512. doi: 10.1021/ja062443u. [DOI] [PubMed] [Google Scholar]
- 44.Chevelkov V, Fink U, Reif B. Accurate determination of order parameters from 1H, 15N dipolar couplings in MAS solid-state NMR experiments. J. Am. Chem. Soc. 2009;131:14018–14022. doi: 10.1021/ja902649u. [DOI] [PubMed] [Google Scholar]
- 45.Lorieau JL, Day LA, McDermott AE. Conformational dynamics of an intact virus: order parameters for the coat protein of Pf1 bacteriophage. PNAS. 2008;105:10366–10371. doi: 10.1073/pnas.0800405105. [DOI] [PMC free article] [PubMed] [Google Scholar]
- 46.Thiriot DS, Nevzorov AA, Zagyanskiy L, Wu CH, Opella SJ. Structure of the coat protein in Pf1 bacteriophage determined by solid-state NMR spectroscopy. J. Mol. Biol. 2004;341:869–879. doi: 10.1016/j.jmb.2004.06.038. [DOI] [PubMed] [Google Scholar]
- 47.Goldbourt A, Gross BJ, Day LA, McDermott AE. Filamentous phage studied by magic-angle spinning NMR: resonance assignment and secondary structure of the coat protein in Pf1. J. Am. Chem. Soc. 2007;129:2338–2344. doi: 10.1021/ja066928u. [DOI] [PubMed] [Google Scholar]
- 48.Wu CH, Grant CV, Cook GA, Park SH, Opella SJ. A strip-shield improves the efficiency of a solenoid coil in probes for high-field solid-state NMR of lossy biological samples. J. Magn. Reson. 2009;200:74–80. doi: 10.1016/j.jmr.2009.06.004. [DOI] [PMC free article] [PubMed] [Google Scholar]
- 49.Bak M, Rasmussen JT, Nielsen NC. SIMPSON: a general simulation program for solid-state NMR spectroscopy. J. Magn. Reson. 2000;147:296–330. doi: 10.1006/jmre.2000.2179. [DOI] [PubMed] [Google Scholar]
- 50.Dvinskikh SV, Zimmermann H, Maliniak A, Sandstrom D. Heteronuclear dipolar recoupling in liquid crystals and solids by PISEMA-type pulse sequences. J. Magn. Reson. 2003;164:165–170. doi: 10.1016/s1090-7807(03)00180-0. [DOI] [PubMed] [Google Scholar]
- 51.Dvinskikh SV, Zimmermann H, Maliniak A, Sandstrom D. Heteronuclear dipolar recoupling in solid-state nuclear magnetic resonance by amplitude-, phase-, and frequency-modulated Lee–Goldburg cross-polarization. J. Chem. Phys. 2005;122 doi: 10.1063/1.1834569. 044512. [DOI] [PubMed] [Google Scholar]


