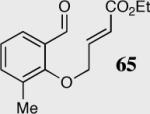
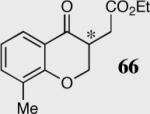
Table 1.
Comparison of two different catalyst scaffolds. 
| Entry | Substrate | Product | Catalyst | Yield % | ee% |
|---|---|---|---|---|---|

|

|
33 | 80 | 90 (R) | |
| 1 | 34 | 94 | 94 (R) | ||
| 2 | 40 | 94 | 90 (S) | ||
| 41 | 95 | 92 (S) | |||
| 3 |

|

|
34 | 90 | 84 (R) |
| 4 | 40 | 94 | 80 (S) | ||
| 5 |

|

|
34 | 50 | 81 (R) |
| 6 | 40 | 85 | 68 (S) | ||
| 7 |

|

|
34 | 35 | 94 (S) |
| 8 | 40 | 90 | 92 (R) | ||
| 9 |

|

|
34 | 80 | 81 (S) |
| 10 | 40 | 81 | 95 (R) |
