

Abstract
Objective
This study investigates change in IQ scores among 290 children born to teenage mothers and identifies social, economic, and environmental variables that may be associated with change in intelligence test performance.
Methods
The children of 290 teenage mothers (72% African American and 28% European American) were assessed with the Stanford-Binet Intelligence Scale-4th Edition (SBIS) at ages 6 and 10.
Results
The mean composite score at age 6 was 84.8 and was 91.2 at age 10, an improvement of 6.4 points. Significant cross-sectional predictors at both ages 6 and 10 of higher SBIS scores were maternal cognitive ability, school grade, Caucasian ethnicity, and caregiver education. Having more children in the household significantly predicted lower SBIS scores at age 6. Higher satisfaction with maternal social support predicted higher SBIS scores at age 10. Change in IQ scores was not related to maternal socioeconomic status, social support, home environment, ethnicity, or family interactions. Custodial stability was associated with an improvement in IQ scores, while increase in caregiver depression was related to decline in IQ scores.
Conclusions
Our findings suggest that improvement in IQ scores of offspring of teenage mothers may be related to stability of maternal custody. More research is needed to determine the impact of the maturation of adolescent mothers' parenting and the role of early education on improvement in cognitive abilities.
Keywords: IQ changes, teenage mothers, Stanford-Binet Intelligence Scale
Teenage pregnancy and the subsequent birth of babies to adolescent mothers is a continuing public health problem in the United States. The number of births to adolescent mothers in the U.S. is significantly higher than in other developed countries.1-2 In fact, the birth rate for American teenagers rose by 3 percent between 2005 and 2006 according to the National Center for Health Statistics.3 This recent increase was greatest among African-American teenagers, whose birth rate rose 5 percent between 2005 and 2006, reaching 63.7 per 1,000 teenagers.3
Offspring of teenage mothers may be at higher risk for developmental deficits. Their infants vocalize less often than infants of adult mothers, perhaps due to less maternal verbal stimulation.4 Lower intelligence scores have also been reported in both the preschool5 and childhood years.6-7 Camp8 suggested that the prevalence of authoritarian childrearing attitudes among adolescent mothers was negatively associated with child IQ scores, and teenage mothers' childrearing attitudes did not change over time. Sommer et al.5 showed a significant relation between younger maternal age at birth and lower Stanford-Binet Intelligence Scale (SBIS) scores among three-year-old offspring. They did not, however, follow the children to investigate if there was a long-term cognitive deficit. Lawlor et al.7 also found a significant relation between lower maternal age at birth and lower intelligence scores among 7- to 11-year-old children. Cornelius and colleagues6 reported significantly lower SBIS test scores among the six-year old children born to adolescent mothers in the current study sample as compared to six-year-old offspring of adult mothers with similar socioeconomic status (SES).
There is no biological evidence for increased risk of intellectual disability among children of teenaged mothers.9 However, children born to teenage mothers are at risk for adverse cognitive development due to a multitude of psychosocial risk factors. Low levels of educational attainment and income are related to early pregnancy.10 Other correlates of adolescent pregnancy that have an impact on offspring cognitive development include home environment and social support. Moore et al.11 found that children of younger mothers were less likely to have nurturing home environments and less cognitive stimulation, even when SES was controlled. Some research controlling for these risk factors did not find a significant association between maternal age and cognitive ability in offspring12-13, but findings from other studies suggest consideration of these risk factors may attenuate but not completely eliminate the effects of teenage pregnancy on cognitive development.14 Jaffee and colleagues15 tested hypotheses about the effects of social selection and social influence on offspring, and found support for both hypotheses in the Dunedin cohort, suggesting that it is important to control for both maternal and environmental factors. Thus, the cognitive development of children born to adolescent mothers needs to be evaluated within the framework of these characteristics.
Reports about trajectories of intellectual development in the children of adolescent mothers are scarce. In the Notre Dame Adolescent Parenting Project (NDAPP), the intelligence test scores of children from age 3 to 10 years were found to improve over time.16 This study used the SBIS to measure children's intelligence at younger ages and the Wechsler Intelligence Scales at later phases. The maternal characteristics included in the study were maternal intelligence, cognitive readiness to parent, and maternal depression. To our knowledge, no other longitudinal studies of teenage mothers have explored the effect of additional explanatory variables on children's IQ scores.
Data for this report were collected at 6 and 10 years of age and were used to examine the intellectual development of children born to teenage mothers. This unique study includes a full scale intelligence test on the same cohort at two time points, and considers a large number of developmental risk factors. We investigated whether there was a change in children's intelligence test performance over time, then explored whether any observed change was related to maternal SES, intelligence, psychosocial characteristics, attitude towards child rearing, child's home environment, gender, and ethnicity.
METHOD
Sample
The data were drawn from a longitudinal study of adolescents and their offspring.17 Pregnant adolescents (mean age = 16 years; range = 12-18) were recruited at their fourth or fifth month prenatal visit at a large urban obstetric hospital. All pregnant adolescents who attended the prenatal clinic from 1990 through 1994 were eligible for the study and less than 1% refused to participate at the recruitment phase. The only exclusion criterion was adolescents whose gestation was greater than five months. Mothers and their offspring were interviewed again at 6 and 10 years postpartum at University offices. The Institutional Review Boards of the obstetric hospital and the University approved each phase of the study protocol.
The children in these phases were, on average, 6.3 (SD=0.6) and 10.3 (SD=0.5) years of age. The majority of them (72%) were African American; the remaining children were European American. At the 6-year phase, 93% were in maternal custody, and at the 10-year phase, 87% were in maternal custody. At 6 years, 81% of the mothers were either single head of households (39%) or living with a boyfriend or husband (42%). At the 6- and 10-year phases, 345 and 305 children completed the SBIS tests, respectively. A total of 294 subjects were assessed at both phases. The average 6-year SBIS composite score of children who were assessed at both phases was not significantly different from the average composite score of children who did not participate in the 10-year phase (84.5 vs. 83.6, respectively, p= 0.6). Four children diagnosed with mental retardation, hearing deficit, and low level of functioning (defined as SBIS composite score less than 50) were excluded from the analyses resulting in a sample size of 290 for the current analyses.
Measurement
Intelligence
The children's cognitive development was assessed using the Fourth Edition of the Stanford-Binet Intelligence Scale (SBIS)18. The SBIS consists of four area subtests (verbal reasoning, quantitative reasoning, abstract/visual reasoning, and short-term memory) and a composite score. The composite score and the subscales are age-adjusted. The mean composite score of the standardization sample is 100. The internal consistency reliability of the composite scores at 6 and 10 years is .96 and .98, and the standard error of measurement (SEM) is 3.2 and 2.3, respectively.18 At both the 6- and 10-year phases, the SBIS was administered by trained examiners under similar conditions. Examiners were trained and supervised by a developmental psychologist. Period reliability checks were conducted to ensure continued adherence to the standardized administration protocol. The examiners were blind to IQ scores obtained at the earlier phase.
After the IQ assessment
the SBIS examiners rated the child's behavior during testing.19 The examiners' ratings are divided into two scales. The activity/attention scale represents attention span, restlessness, and attempts to distract the tester. The compliance/affect scale represents task involvement, persistence, sociability, affect, and compliance during testing. Lower scores indicate poorer behavior during SBIS administration. The reliability coefficients for activity/attention and compliance/affect were .88 and .92, respectively.19
Covariates
Maternal Cognitive Ability
Maternal cognitive ability was measured during the 6-year assessment by the Vocabulary and Block Design (V-BD) subtests of the Wechsler Adult Intelligence Scale-Revised (WAIS-R).20 This two-subtest short form has been shown to be the best two subtest version of the WAIS-R, considering both the validity and reliability of the measurement.21
Parent Attitude Scale
Questions from the Parent Attitude Scale (PAS)22 were used to assess maternal attitudes towards child rearing at the 6-year phase. The questions are in a 5-point Likert format, with higher scores reflecting pro-child attitudes. The PAS questions are factored into three subscales representing mother-child interaction, attachment quality, and child disruptiveness. Cronbach's alpha coefficients for the total score and the interaction subscale in our sample were 0.72 and 0.68, respectively. The attachment and disruptiveness subscales were excluded from the analyses due to low reliability.
Caregiver Psychosocial Characteristics
Caregiver depression was measured at 6 and 10 years by the Center for Epidemiological Studies-Depression Scale (CES-D).23 The number of major life events over the past year was also collected as a measure of potential stressors.24 Social support was assessed with three questions: the number of close friends and relatives (1 to 10), the number of people from whom they can borrow money (1 to 10), and their satisfaction with help from friends/relatives (very dissatisfied=1 to very satisfied=4). These questions were adapted from the Human Population Laboratory studies.25
Environment
Several variables were used to assess the quality of the home environment at 6 and 10 years. Loss of maternal custody of the child was indicated by a dichotomized variable (yes=1, no=0). In cases of lost custody, the current primary caregiver was interviewed. The Home Observation for Measurement of the Environment - Short Form (HOME-SF)26 was used to assess cognitive stimulation and emotional support at home. The Family Environment Scale (FES)27 was used to measure family cohesion, expressiveness, and conflict. The reliability coefficients for the 3 scales ranged from .75 to .78. Caregiver use of illicit drugs (any use = 1, no use = 0,) such as marijuana, cocaine, and tranquilizers, were assessed using the questionnaire developed by the Maternal Health Practices and Child Development Project.28
Demographics
At 6 and 10 years, socioeconomic status was assessed by average monthly family income, number of children in the household, caregivers' level of education, marital status (married=1, not married=0), and work status (works outside of the home=1, does not work=0). Other characteristics of the children that were considered included gender, ethnicity, and grade in school.
Statistical Analyses
A matched t-test was first used to test whether there was a significant and meaningful change in children's IQ scores from 6 to 10 years. Next, the bivariate association between a number of potential correlates of cognitive development identified in the literature and the SBIS composite score were examined. Cross-sectional regression analyses were then applied to obtain the most parsimonious set of correlates of intelligence test performance at each phase, while taking into account the inter-relation between SES, psychosocial characteristics, and home environment. The variance inflation factors for the predictors were screened to avoid multicollinearity and guarantee stable estimates of the regression slopes. Residual diagnostics were used to examine the regression assumptions and to identify influential and outlier cases.
Longitudinal analyses were subsequently conducted using two different repeated measures models. In repeated measures models, each individual is matched to oneself, the correlations between the repeated measures are taken into account, and the statistical power for detecting the effects of regressors is increased. In the first model, the entire cohort was considered as a single group, with IQ test scores at ages 6 and 10 as the outcome variables. Both fixed and random effects models were considered. The random effects model is more flexible but requires estimation of additional parameters. Akaike information criteria (AIC)29, which takes into account both the likelihood and the number of estimated parameters, was used to compare these models. The results were consistent between the two models, although AIC indicated that the fixed effects model fitted the data slightly better than the random effects model.
The significant predictors identified in the cross-sectional regression analyses and variables that were significantly correlated with change score after controlling for baseline IQ were considered as potential correlates of change in IQ. The interaction terms between these variables and time were used to test the effects of these variables on change in children's intelligence scores. Each interaction was tested separately to avoid spurious results. The significance levels of the interaction terms were estimated using F-test for the dichotomous variables and Wald test for the continuous variables. The model parameters were estimated using restricted maximum likelihood (REML). In this model, change in IQ is defined as any change.30
In the second model, the cohort was categorized into 3 groups: those whose SBIS composite scores changed by more than twice the standard error of measurement (SEM) or 6.4 points (1 group improved by at least 6.4 points; 1 group declined by at least 6.4 points; and one group did not change or was within 6.4 points). According to psychometric theory, the SBIS scores at the second phase should fall within 9 points (2 * √2 * SEM at age 6) of the baseline score for 95% of the individuals and within 6.4 points for 84% of the individuals. We chose the lower cut point to allow a sufficient number of subjects in each group for comparison. Repeated measures of variables that vary over time were used to test whether the rate of change in these variables differed between the three groups. The dependent variables for this analysis included socioeconomic status, home environment, and caregiver psychosocial characteristics. Change in IQ score was used as the grouping factor with the no change group as the control group, and we tested for group by time interaction. For continuous outcome variables, group by time interaction was tested using repeated measures analysis of variance. For binary outcome variables, a marginal logit model was fitted to the data and the parameters were estimated using generalized estimating equations (GEE) method.31
RESULTS
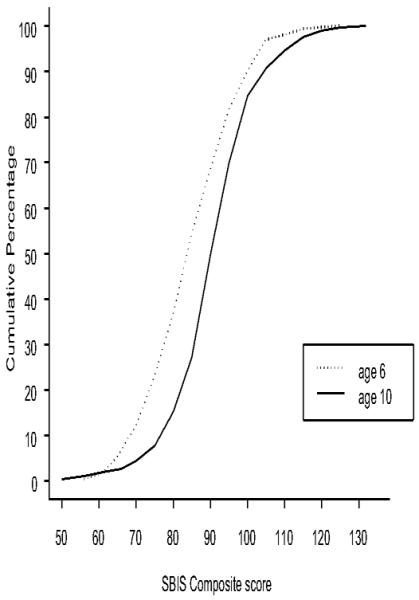
At age 6, the children's average SBIS composite score was 84.8 (SD=12, range=61-125) (Table 1). This average is one standard deviation below the average score in the general population18 and is lower than the average score of children of low-income families born to older women in the same hospital.6 By age 10, the average composite score increased to 91.2 (SD=11, range=56-132), a statistically significant change (matched t-test=10.6, p < 0.001) that is illustrated in Figure 1. For example, 51% of the children scored 84 points or less on the SBIS composite score at age 6 compared to 24% at age 10. Change in composite scores from 6 to 10 years ranged from −39 to +34 points, with an improvement greater than the standard error of measurement (3.2) observed among 58% of the children. A change greater than 9 points is significantly beyond expected fluctuation by error. In this sample, the SBIS composite score of 37.2% of children improved by more than 9 points compared to 5.2% of children that declined as much (χ2 = 9.4, p < 0.005). This clinically significant change is also significantly higher than expected in the general population (37.2% vs. 2.5%, p < 0.001). For example, in a similar low-SES population of children of adult mothers, scores did not increase from age 6 years (91.6) to age 10 years (91.5)32,33.
Table 1.
Mean Stanford-Binet Intelligence Scale Scores at 6 and 10 years & Cross-sectional Regression Analysis at 6 and 10 years
| Age 6 | Age 10 | |
|---|---|---|
| SBIS composite and area score:a | ||
| Composite score | 84.8 | 91.2*** |
| Quantitative reasoning | 84.7 | 92.9*** |
| Verbal reasoning | 94.0 | 94.1 |
| Abstract/Visual reasoning | 83.5 | 91.0*** |
| Short-term memory | 87.0 | 91.2*** |
|
| ||
| Examiners' ratings: | ||
| Activity/attention | 14.0 | 17.0*** |
| Compliance/affect | 24.9 | 26.3*** |
| Summary score | 38.9 | 43.3*** |
| Dependent variable | Significant predictors | Coefficientb | R2 |
|---|---|---|---|
| SBIS | |||
| Composite score at 6 years |
Maternal cognitive ability | 0.21*** | 0.11 |
| School grade | 2.89*** | 0.04 | |
| Ethnicityc | 5.55*** | 0.03 | |
| # children in the household | −1.74** | 0.03 | |
| Caregiver education | 1.00* | 0.01 | |
|
| |||
| SBIS | |||
| Composite score at 10 years |
Maternal cognitive ability | 0.22*** | 0.13 |
| Ethnicity | 6.00*** | 0.06 | |
| School grade | 1.97*** | 0.03 | |
| Caregiver education Satisfaction with help |
1.13** | 0.02 | |
| from friends/relatives | 2.12* | 0.01 | |
p < .05
p < .01
p < .001
Comparison of means based on matched t-test.
Regression coefficient represents the magnitude of effect per unit change.
Caucasian =1, African-American = 0
Quantitative reasoning was the subscale that changed the most from 6 to 10 years, and verbal reasoning was the only subscale that, on average, did not change over time (Table 1). On average, the quantitative, abstract/visual, and short-term memory subscales increased by 8.2 (p < 0.001), 7.5 (p < 0.001), and 4.2 (p < 0.001) points, respectively. The observed improvement was not restricted to test performance, but was also demonstrated by the examiners' ratings. The ratings showed significant improvement in children's behavior during the SBIS testing from 6 to 10 years. The children were more attentive and focused on their tasks, more cooperative, more persistent in solving difficult tasks, less restless, and out of their seats fewer times.
Table 2 shows the means and standard deviations of the covariates that were considered in the analysis as well as the correlations between the variables and the SBIS. Half of the children are male and half female, 72% are African-American, and their average grade in school at the 10-year phase was fourth grade. The two most significant correlates of the SBIS composite score were maternal cognitive ability and ethnicity (Table 2), with correlations of 0.37 and 0.35, respectively.
Table 2.
Potential correlates of cognitive development
| Variables measured at birth | Average (SD) | Correlation with SBIS |
|---|---|---|
| Gender (% male) | 50 | N.S. |
|
| ||
| Ethnicity (% African-American) | 72 | 0.35 |
|
| ||
| Variables measured at 6 years | ||
|
| ||
| Caregiver education (years) | 12.2 (1) | 0.16 |
| Marital status (% married) | 18.3 | 0.10 |
| Work status (% work) | 55.5 | 0.16 |
| Monthly family income ($) | 1276.0 (1055) | 0.18 |
| # of children in the household | 2.2 (1) | −0.23 |
| Depression (CES-D) | 38.1 (9) | N.S. a |
| Life events | 5.5 (3) | −0.10 |
| # Close friends & relatives | 5.8 (3) | 0.12 |
| Satisfaction with help | 3.7 (.6) | 0.14 |
| % Lost custody | 7.2 | N.S. |
| Illicit drugs (% use) | 30.3 | N.S. |
| HOME-SF | 11.6 (3) | 0.10 |
| FESb expressiveness | 2.4 (.9) | 0.18 |
| cohesion | 3.4 (.8) | N.S. |
| conflict | 1.4 (1) | N.S. |
| PASc total score | 59.5 (6.5) | 0.12 |
| interaction | 22.5 (4) | 0.15 |
| Maternal cognitive ability | 81.8 (11) | 0.37 |
| Child school graded | 0.35 (.7) | 0.21 |
|
| ||
| Variables measured at 10 years | ||
|
| ||
| Caregiver education (years) | 12.5 (1) | 0.20 |
| Marital status (% married) | 22.1 | N.S. |
| Work status (% work) | 66.6 | 0.12 |
| Monthly family income ($) | 1726.0 (1412) | 0.25 |
| # of children in the household | 2.7 (1) | −0.12 |
| Depression (CES-D) | 39.4 (10) | N.S. |
| Life events | 5.0 (3) | N.S. |
| # Close friends & relatives | 2.9 (2) | 0.14 |
| Satisfaction with help | 3.6 (.6) | 0.19 |
| % Lost custody | 13.1 | N.S. |
| Illicit drugs (% use) | 25.9 | −0.12 |
| HOME-SF | 12.2 (3) | 0.18 |
| FES expressiveness | 2.5 (.9) | 0.12 |
| Cohesion | 3.4 (.8) | N.S. |
| Conflict | 1.4 (1) | N.S. |
| Child school grade | 4.3 (.8) | 0.20 |
Not significantly different than zero at α = .05.
Family Environment Scale (Moos & Moos, 1981)
Parent Attitude Scale (Silvestro & Fosson, 1982)
Preschool coded as −1, kindergarten as 0, 1st grade as 1, etc.
In the cross-sectional regression analyses, maternal cognitive ability, education, ethnicity, and child's grade in school were consistent predictors of the SBIS composite score at both 6 and 10 years (Table 1). Number of children in the household was significantly and negatively associated with children's IQ scores at age 6, and caregiver social support was significantly positively associated with children's IQ scores at age 10.
The above analyses were repeated excluding children whose SBIS composite scores were below 67 points (defined as mental retardation according to SBIS Examiner's Handbook34). The change in IQ scores and significant predictors remained consistent as those reported above.
The correlates of change in IQ were tested using time by factor interactions within a repeated measures model with SBIS composite scores as the repeated measures. However, there was no significant difference between the magnitude of change in IQ from age 6 to 10 years as a function of ethnicity or gender. There was a 6.9 point increase in the SBIS composite score of European American children as compared to 6.1 points among African American children (F1,288 =0.3, p= 0.6). On average, the SBIS composite scores of girls increased by 7.3 points compared to 5.4 points among boys (F1,288 =2.7, p= 0.10).
Among significant predictors of IQ in the cross-sectional analyses, time by number of children in the household was the only interaction that reached statistical significance (χ2 =4.2, p= 0.04), reflecting the diminishing association between this variable and child intelligence at age 10. The interactions between time and maternal cognitive ability, social support, education, and income were not statistically significant. We also evaluated education (greater than 12 years) and income (upper quartile) as dichotomized variables to examine whether improvement in SBIS score was related to higher SES. Improvement in SBIS composite scores was parallel between children whose caregivers had more than 12 years of education and those with lower education (5.9 versus 6.7 points, respectively, F1,288 = 0.5, p=0.5). The magnitude of improvement in IQ was also similar between children with higher income and the remaining subjects in the sample (6.3 versus 6.4 points, F1,288 = 0, p=1.0).
Examining the correlation between the remaining variables and change score controlling for baseline IQ, caregiver illicit drug use at age 10 was the only variable that was marginally related to change in IQ score. There was a 7 point increase in the SBIS composite score of children whose caregivers did not use illicit drugs at the 10 year phase compared to 4.5 points among offspring of illicit drug users (F1,288 =3.2, p= 0.07). For variables that can change over time, we also examined the correlation between change in IQ and change in these variables (lag terms) controlling for baseline IQ and predictors of IQ. There was no association between the lag terms and change in IQ.
Next, we examined the frequency of change in intelligence test scores by at least two times the standard error of measurement (6.4 points). Improvement by more than 6.4 points in the SBIS composite score from age 6 to 10 was observed among 138 (47.6%) of the children (Improved group). One hundred twenty-eight (44.1%) children scored within a 6.4 point range (No Change group), and a decrease of more than 6.4 points was observed among 24 children (8.3%) (Declined Group) (Table 3).
Table 3.
Comparison of the Improveda, No Change, Declined Groups
| Improved N = 138 |
No Change N = 128 |
Declined N = 24 |
|
|---|---|---|---|
| Change in socioeconomic status (from 6 to 10) | |||
| Caregiver education (years) | 0.3 | 0.4 | 0.2 |
| Marital status (% married) | 2.0 | 5.0 | 8.0 |
| Work status (% work) | 15.0 | 8.0 | 9.0 |
| Monthly income ($) | 469.0 | 502.0 | 73.0 |
| # Children in the household | 0.6 | 0.4 | 0.7 |
| Change in maternal psychosocial characteristics (from 6 to 10) | |||
| Depression (CES-D) | 1.2 | 0.4 | 6.4b |
| # Life events | −0.4 | −0.7 | −0.7 |
| # Close friends & relatives | −2.8 | −2.8 | −3.8 |
| Satisfaction with help | −0.1 | −0.1 | −0.3 |
| Change in child's environment (from 6 to 10) | |||
| % Non-maternal custody | 2.2c | 9.4 | 8.4 |
| HOME-SF | 0.3 | 0.8 | 0.4 |
| Illicit drugs (% use) | −4.3 | −3.9 | −8.3 |
| FES expressiveness | 0.0 | 0.1 | 0.5 |
| Cohesion | 0.0 | 0.0 | 0.0 |
| Conflict | 0.0 | 0.0 | −0.3 |
Improved – increase of more than 6.4 points on SBIS composite score from age 6 to 10; No Change – change of ≤ 6.4 points from age 6 to 10; Declined – decrease of more than 6.4 points from age 6 to 10.
Significantly different based on Wald test.
Significantly different Based on Marginal logit model and Generalized Estimating Equations.
Cross-sectionally, at both 6 and 10 years, there were no differences in maternal demographic and psychosocial characteristics, ethnicity, cognitive ability, home environment, or maternal attitudes towards childrearing among the three groups. There were no differences in family interactions between the groups except for family expressiveness at the 10-year phase. The Declined group reported higher expressiveness in the family than the No Change and the Improved groups (3.0, 2.5, 2.5, respectively, Brown-Forsythe F2,221= 3.9, p < .03). The percentage of boys in the Improved group was significantly lower than in the No Change group (43.5% versus 58.6%, p < 0.05), but did not differ from the declined group (45.8%).
Longitudinally, the No Change group was compared to the Improved and Declined groups using repeated measures models with time-varying variables as the dependent variables. Group by time interaction was used to test whether a change in these variables was related to the IQ grouping factor. The change in socioeconomic status, maternal psychosocial characteristics, and child's home environment from age 6 to 10 for each IQ group is shown in Table 3. Among continuous dependent variables, change in caregiver depression from 6 to 10 years significantly differed among the three groups (χ2= 8.0, p < 0.02). Depression increased by 6.4 points in the Declined group compared to 0.4 and 1.2 points in the No Change and Improved groups, respectively. Marginal logit models were applied to dichotomous variables such as marital status, work status, illicit drug use, and custody of the child, where an inconsistent rate of change from age 6 to 10 within each group was suspected (Table 3). The only variable for which a significant time by group interaction was found was custody of the child. Among the Improved group, the percentage of maternal loss of custody remained stable from 6 to 10 years (9.4% to 11.6%, or a 2.2% change), while the percentage of children not under maternal custody nearly tripled (5.3% to 14.7%, or a 9.4% change) in the No Change group (z=−2.2, p < 0.03) and doubled in the Declined group (8.3% to 16.7% or an 8.4% change). Thus, custodial stability was significantly related to improvement in IQ. No significant interactions were identified for the other variables.
DISCUSSION
The 6-year-old children of teenage mothers had IQ scores below the average for their age group, consistent with the literature on cognitive deficits and language delays in the offspring of teenage mothers.5,8,35-37 However, when measured four years later, at age 10, their SBIS composite scores had improved on average by 6.4 points and became more comparable to SBIS scores of another low SES sample of children of adults.33 These results mirror the improvement in IQ scores from 3 to 10 years seen in the offspring of adolescent mothers from the NDAPP study,16 but are in contrast to findings by Krohn and Lamp38 who found no change in composite SBIS scores from ages 4 to 9 in a small sample of low income children where maternal age was not reported. Our findings are also in contrast to findings by Breslau et al.39 who found a decline in IQ among inner-city children from ages 6 to 11 years where maternal age was not reported. However, like our study, they found that maternal IQ, education, and marital status were not related to IQ change. Our findings suggest that the early negative outcomes seen in the offspring of teenage mothers may be attenuated over time.
Although scores improved in the group as a whole from ages 6 to 10, the risk factors for lower IQ essentially remained the same (e.g., lower maternal cognitive ability and educational attainment, African American ethnicity, and lower school grade attained by the child). Further, the average SBIS found at age 10 in this sample was still lower than the average SBIS composite score in the general population.18 These results highlight the need to continue providing parenting and educational support for pregnant and mothering teenagers. Young children of teenage mothers could also be targeted for enhanced preschool education, improving school-readiness in this high-risk group of children.
The home environment, income, and attitudes towards child rearing were not significant predictors of IQ or of change in IQ over time. This finding is different from other studies that have found a significant association between these variables and child IQ in studies of children of adult mothers.6,12,14 It is possible that home environment is more variable across families with adult-aged parents than among those headed by a teenage mother. These results highlight the importance of studying the children of teenage mothers because the effects of the home environment and maternal psychosocial factors on school-age IQ seen in the offspring of children with adult mothers may not generalize to this vulnerable population.
The number of children in the household significantly interacted with IQ change over time. The number of children in the household was a more important predictor of IQ at age 6 than it was at age 10. This finding, together with the overall improvement in IQ from ages 6 to 10, highlights the importance of the family environment for preschool cognitive development. After children enter the school system, they receive professional intellectual stimulation that may diminish the importance of the family environment over time. Although African American children were at greater risk of lower scores than European American children, children from both groups were equally likely to have improved scores at the second testing point. This result supports our suggestion that the impact of the early child environment may be attenuated by exposure to the school system. School may help redress some of the imbalances experienced by families exposed to multiple disadvantages.
Our data are consistent with Bronfenbrenner and Ceci's hypothesis40 that exposure to external resources has the greatest impact on children living in scarce environments. Coming in contact with skilled teachers and experiences not available in their homes may enhance cognitive development. This potential schooling effect on IQ has been demonstrated in other populations41-43 and its effect is separate from the effects of increased age.38 Improvement in examiner ratings of child behavior may also result from schooling effects where compliance and attention are required of students; this improved behavior may influence IQ test scores19. It is also noteworthy that quantitative reasoning, the subscale possibly most influenced by schooling, was the area that improved the most in our sample.
In addition to the schooling effect, an alternative explanation for improvement in intelligence among children of teenage mothers is that parenting skills may have improved over time. Several studies have emphasized the significant effects of cognitive readiness to parent33 and of parent-child interaction15 on the cognitive development of children of adolescent mothers. By the 10-year follow-up, the average age of the caregivers in our sample was 26 years. However, in our cohort, parenting information was limited to attitudes towards child rearing collected at the 6-year phase. Therefore, we were not able to test whether the positive change in child IQ scores could be attributed to maturity in parenting.
When comparing the group of children from this study who significantly improved in IQ over time (Improved Group) to those who remained the same (No Change) or showed a decrease in IQ (Declined Group), we found no relation to change in maternal socioeconomic status, social support, family interactions, or home environment. Moffitt and colleagues,44 who studied different trajectories of IQ of children from ages 7 to 13, also reported no relation between different profiles of IQ and change in SES or family relations. However, in the current study, caregiver depression increased significantly more among the Declined group compared to the No Change or Improved groups. Our results also showed a negative relation between maternal illicit drug use and children IQ scores. The effects of caregiver depression and illicit drug use point to additional effects of a negative home environment on cognitive ability in young children45.
Child custody was also significantly more likely to remain stable in the Improved Group compared to the No Change Group. This finding is consistent with Jaffee and colleagues15 assertion that family characteristics, including a decrease in residence changes, can act as a protective function for child development. It is not possible to tease apart the direction of this effect with the data in the current study. In other words, being in a stable home may help improve IQ scores, or unmeasured variables associated with maternal custody may be associated with better cognitive development.
There were several strengths to this study. Recruitment took place at a large obstetric clinic and hence the large sample was representative of the population of teenage mothers in the area. The teenage mothers were recruited during their pregnancy and seen with their offspring at several points after the pregnancy, including school entry (age 6) and middle childhood (age 10). Consistent and standardized measures were available for both time points, making longitudinal data analysis possible. We were able to consider a large number of correlates of IQ, including demographic factors, maternal cognitive status, and home environment.
There were limitations to these analyses. We adjusted for many important factors related to cognition; however, there are additional variables that we could not consider including paternal IQ, measures of parental attachment, and parenting skills. Each of these is known to be important in predicting cognitive development. Although we controlled for the home environment and parenting in the multivariate analyses, there may be some other aspect of the home environment that we did not capture during our assessments. In addition, the cohort was of low socioeconomic status and was predominantly African American. The results may not represent the association between maternal age and child development among mother-child dyads of higher socioeconomic status or of other ethnic groups.
Although studies indicate that the cognitive abilities of younger offspring of teenage mothers are lower than those of adult-aged mothers, our findings indicate that this gap may diminish by middle childhood. It is likely that the educational system contributes to the increase in IQ scores, particularly in areas of quantitative abilities.
ACKNOWLEDGEMENTS
This study was supported by grants from the National Institute of Drug Abuse (DA09275 PI: M Cornelius) and the National Institute on Alcohol Abuse and Alcoholism (AA08284; PI: M Cornelius). The authors thank the young women and children who made this study possible by contributing their time and sharing their experiences with our interviewers and field staff.
Sources of support: NIH (NIDA DA09275; NIAAA AA08284)
Footnotes
This is a PDF file of an unedited manuscript that has been accepted for publication. As a service to our customers we are providing this early version of the manuscript. The manuscript will undergo copyediting, typesetting, and review of the resulting proof before it is published in its final citable form. Please note that during the production process errors may be discovered which could affect the content, and all legal disclaimers that apply to the journal pertain.
Contributor Information
Marie D. Cornelius, Department of Psychiatry, School of Medicine, University of Pittsburgh, Pittsburgh, PA.
Lidush Goldschmidt, University of Pittsburgh Medical Center, Pittsburgh, PA.
Natacha M. De Genna, Department of Psychiatry, School of Medicine, University of Pittsburgh, Pittsburgh, PA.
Gale A. Richardson, Department of Psychiatry, School of Medicine, University of Pittsburgh, Pittsburgh, PA.
Sharon L. Leech, University of Pittsburgh Medical Center, Pittsburgh, PA.
Richard Day, Department of Biostatistics, Graduate School of Public Health, University of Pittsburgh, Pittsburgh, PA.
References
- 1.Centers for Disease Control and Prevention . Sexually Transmitted Disease Surveillance, 2004. Atlanta, GA: 2005. [Google Scholar]
- 2.Panchaud C, Singh S, Feivelson D, et al. Sexually transmitted diseases among adolescents in developed countries. Int Fam Plan Perspect. 2003;32:24–32. [PubMed] [Google Scholar]
- 3.Hamilton B, Martin J, Ventura S. National Vital Statistics Reports. 56(No. 7) Available at: http://www.cdc.gov. Accessed September 1, 2008.
- 4.Culp MA, Osofsky JD, O'Brien M. Language patterns of adolescent and older mothers and their one-year-old children: A comparison study. First Language. 1996;16:61–75. [Google Scholar]
- 5.Sommer KS, Whitman TL, Borkowski JG, et al. Prenatal maternal predictors of cognitive and emotional delays in children of adolescent mothers. J Adolesc. 2000;35:87–112. [PubMed] [Google Scholar]
- 6.Cornelius MD, Goldschmidt L, Day NL, et al. Body size and intelligence in 6-year-olds: Are offspring of teenage mothers at risk? Matern Child Health J. 2009;13:847–856. doi: 10.1007/s10995-008-0399-0. [DOI] [PMC free article] [PubMed] [Google Scholar]
- 7.Lawlor DA, Batty GD, Morton SMB, et al. Early life predictors of childhood intelligence: Evidence from the Aberdeen children of the 1950s study. J Epidemiol Community Health. 2005;59:656–663. doi: 10.1136/jech.2004.030205. [DOI] [PMC free article] [PubMed] [Google Scholar]
- 8.Camp BW. Adolescent mothers and their children: Changes in maternal characteristics and child developmental and behavioral outcome at school age. J Dev Behav Pediatr. 1996;17:162–169. [PubMed] [Google Scholar]
- 9.Williams LO, Decouflé P. Is maternal age a risk factor for mental retardation among children? Am J Epidemiol. 1999;149:814–823. doi: 10.1093/oxfordjournals.aje.a009897. [DOI] [PubMed] [Google Scholar]
- 10.Furstenberg F, Brooks-Gunn J, Chase-Lansdale L. Teenage pregnancy and childbearing. Am Psychol. 1989;44:313–320. [PubMed] [Google Scholar]
- 11.Moore K, Morrison D, Greene A. Effects on the children born to adolescent mothers. In: Maynard RA, editor. Kids having kids: Economic costs and social consequences of teen pregnancy. The Urban Institute Press; Washington DC: 1997. pp. 145–180. [Google Scholar]
- 12.Gueorguieva RV, Carter RL, Ariet M, et al. Effect of teenage pregnancy on educational disabilities in kindergarten. Am J Epidemiol. 2001;154:212–220. doi: 10.1093/aje/154.3.212. [DOI] [PubMed] [Google Scholar]
- 13.Turley RNL. Are children of young mothers disadvantaged because of their mother's age or family background? Child Dev. 2003;74:465–474. doi: 10.1111/1467-8624.7402010. [DOI] [PubMed] [Google Scholar]
- 14.Fergusson DM, Woodward LJ. Maternal age and educational and psychosocial outcomes in early adulthood. J Child Psychol Psychiat. 1999;43:479–489. [PubMed] [Google Scholar]
- 15.Jaffee S, Caspi A, Moffitt T, et al. Why are children born to teen mothers at risk for adverse outcomes in young adulthood? Results from a 20-year longitudinal study. Dev Psychopathol. 2001;13:377–397. doi: 10.1017/s0954579401002103. [DOI] [PubMed] [Google Scholar]
- 16.Lefever JB, Nicholson J, Willard NC. Uncertain futures: Children of adolescent mothers. In: Borkowski JG, Whitman T, Farris J, et al., editors. Risk and resilience: Adolescent mothers and their children grow up. Erlbaum; Mahwah, NJ: 2007. pp. 69–99. [Google Scholar]
- 17.Cornelius M, Goldschmidt L, Day N, et al. Alcohol, tobacco and marijuana use among pregnant teenagers: 6-year follow-up of offspring growth effects. Neurotoxicol Teratol. 2002;24:703–710. doi: 10.1016/s0892-0362(02)00271-4. [DOI] [PubMed] [Google Scholar]
- 18.Thorndike R, Hagen E, Sattler J. The Stanford-Binet Intelligence Scale. 4th ed. Riverside Publishing; Chicago: 1986. [Google Scholar]
- 19.Campbell SB, Pierce EW, March CL, et al. Hard-to-manage preschool boys: Systematic behavior across contexts and time. Child Dev. 1994;65:836–851. [PubMed] [Google Scholar]
- 20.Brooker BH, Cyr JJ. Tables for clinicians to use to convert WAIS-R short forms. J Clin Psychol. 1986;42:982–986. [Google Scholar]
- 21.Cyr JJ, Brooker BH. Use of appropriate formulas for selecting WAIS-R short forms. J Consult Clin Psychol. 1984;52:903–905. [Google Scholar]
- 22.Silvestro JR, Fosson AR. Attitudes of postpartum mothers concerning children and child rearing. South Med J. 1982;75:1171–1176. doi: 10.1097/00007611-198210000-00005. [DOI] [PubMed] [Google Scholar]
- 23.Radloff L. The CES-D scale: A self-report depression scale for research in the general population. Appl Psychol Meas. 1997;1:385–401. [Google Scholar]
- 24.Dohrenwend BS, Krasnoff K, Askenasy AR, et al. Exemplification of a method for scaling life events: The PERI life events. J Health Soc Behav. 1978;19:205–229. [PubMed] [Google Scholar]
- 25.Berkman L, Syme L. Social networks, host resistance, and mortality: A nine year follow-up study of Alameda County residents. Am J Epidemiol. 1979;109:186–204. doi: 10.1093/oxfordjournals.aje.a112674. [DOI] [PubMed] [Google Scholar]
- 26.Baker PC, Keck CK, Mott FL, et al. National Longitudinal Study of Youth Child Handbook. Ohio State University Center for Human Resource Research; Columbus, OH: 1993. Revised ed. [Google Scholar]
- 27.Moos RH, Moos BS. Manual for the Family Environment Scale. Consulting Psychologists Press; Palo Alto, CA: 1981. [Google Scholar]
- 28.Day N, Robles N. Methodological issues in the measurement of substance use. In: Hutchings D, editor. Prenatal Abuse of Licit and Illicit Drugs. Vol. 562. Annual New York Academy of Sciences; 1989. pp. 8–13. [DOI] [PubMed] [Google Scholar]
- 29.Akaike H. A new look at the statistical model identification. Institute of Electrical and Electronics Engineers Transactions on Automatic Control. 1974;19:716–723. [Google Scholar]
- 30.Allison P. Change scores as dependent variables in regression analysis. Sociol Methodol. 1990;20:93–114. [Google Scholar]
- 31.Agresti A. Categorical data analysis. 2nd ed. Wiley & Sons; New York: 2002. [Google Scholar]
- 32.Goldschmidt L, Richardson G, Willford J, Day N. Prenatal marijuana exposure and intelligence test performance at age 6. J Am Acad Child Adolesc Psychiatry. 2008;47:254–263. doi: 10.1097/CHI.0b013e318160b3f0. [DOI] [PubMed] [Google Scholar]
- 33.Willford J, Leech S, Day N. Moderate prenatal alcohol exposure and cognitive status of children at age 10. Alcohol Clin Exp Res. 2006;30:1051–1059. doi: 10.1111/j.1530-0277.2006.00119.x. [DOI] [PubMed] [Google Scholar]
- 34.Delaney E, Hopkins T. Examiner's handbook: An Expanded Guide for Fourth Edition Users. The Riverside Publishing Company; Chicago: 1987. [Google Scholar]
- 35.Coley RL, Chase-Lansdale PL. Adolescent pregnancy and parenthood: Recent evidence and future directions. Am Psychol. 1998;53:152–166. doi: 10.1037//0003-066x.53.2.152. [DOI] [PubMed] [Google Scholar]
- 36.Corcoran J. Consequences of adolescent pregnancy/parenting: A review of the literature. Soc Work Health Care. 1998;27:49–67. doi: 10.1300/J010v27n02_03. [DOI] [PubMed] [Google Scholar]
- 37.Miller CL, Miceli PJ, Whitman TL, et al. Cognitive readiness to parent and intellectual-emotional development in children of adolescent mothers. Dev Psychol. 1996;32:533–541. [Google Scholar]
- 38.Krohn E, Lamp RE. Stability of the SG:FE and K-ABC for young children from low-income families: A 5-year longitudinal study. J School Psychol. 1999;37:315–332. [Google Scholar]
- 39.Breslau N, Chilcoat H, Susser E, Matte T, Liang K, Peterson E. Stability and change in children's intelligence quotient scores: A comparison of two socioeconomically disparate communities. Am J Epid. 2001;154:711–17. doi: 10.1093/aje/154.8.711. [DOI] [PubMed] [Google Scholar]
- 40.Bronfenbrenner U, Ceci SJ. Nature-Nurture reconceptualized in developmental perspective: A bioecological model. Psychol Rev. 1994;101:568–586. doi: 10.1037/0033-295x.101.4.568. [DOI] [PubMed] [Google Scholar]
- 41.Ceci SJ. How much does schooling influence general intelligence and its cognitive components? A reassessment of the evidence. Dev Psychol. 1991;27:703–722. [Google Scholar]
- 42.Crone DA, Whitehurst GJ. Age and schooling effects on emergent literacy and early reading skills. J Ed Psycho. 1999;91:604–614. [Google Scholar]
- 43.Cliffordson C, Gustafsson J. Effects of age and schooling on intellectual performance: Estimates obtained from analysis of continuous variations in age and length of schooling. Intelligence. 2008;36:143–152. [Google Scholar]
- 44.Moffit TE, Caspi A, Harkness AR, Silva PA. The natural history of change in intellectual performance: Who changes? How much? Is it meaningful? J Child Psychiat. 1993;34:455–506. doi: 10.1111/j.1469-7610.1993.tb01031.x. [DOI] [PubMed] [Google Scholar]
- 45.Petterson S, Albers A. Effects of poverty and maternal depression on early child development. Child Devel. 2001;72:1794–1813. doi: 10.1111/1467-8624.00379. [DOI] [PubMed] [Google Scholar]