

Abstract
Objective
To determine whether macrophages, a cell type implicated in the pathogenesis of ankylosing spondylitis (AS), exhibit a characteristic gene expression pattern.
Methods
Macrophages were derived from the peripheral blood of 8 AS patients (median disease duration 13 yrs, range 1-43 yrs) and 9 healthy controls over 7 days with GM-CSF. Cells were stimulated with IFN-γ (100 U/ml) for 24 hours, or left untreated, or treated with LPS (10 ng/ml) for 3 hours. RNA was isolated and analyzed by microarray and real time PCR.
Results
Microarray analysis revealed 198 probe sets detecting differential expression of 141 unique genes in untreated macrophages from AS subjects compared to healthy controls. Clustering and Principle Components Analysis clearly distinguished AS patients and controls. Seventy-eight (55%) of the differentially expressed genes are IFN-regulated, and their relative expression indicates a ‘reverse’ IFN signature in AS patient macrophages, where IFN-γ-upregulated genes are underexpressed and downregulated genes are overexpressed. Treatment of macrophages with exogenous IFN-γ normalized expression of these genes between patients and controls. In addition, the mRNA encoded by the IFN-γ gene was ∼2-fold lower in AS patient macrophages at baseline (p=0.004), and was poorly responsive to LPS (p=0.018) compared to healthy controls.
Conclusions
This study reveals consistent gene expression differences in macrophages from AS subjects, with evidence for a striking ‘reverse’ IFN signature. Together with poor expression and responsiveness of the IFN-γ gene, these results suggest there may be a relative defect in IFN-γ gene regulation with autocrine consequences, and implications for disease pathogenesis.
Ankylosing spondylitis (AS) is a complex genetic disease characterized by axial skeletal inflammation that includes entheses and the sacroiliac joints, with variable peripheral joint, ocular, gastrointestinal, cardiac, and pulmonary involvement. Significant morbidity as a consequence of increased bone formation and ankylosis at sites of inflammation occurs in a large proportion of patients. Although environmental triggers may exist, it has been estimated that over 90% of susceptibility is inherited (1). Up to 40% of the genetic risk is attributable to the MHC-encoded class I allele, HLA-B27 (2). Two additional susceptibility genes (IL23R and ARTS1) were recently identified in a genome-wide association study (3). Together with HLA-B27, these three genes may account for close to 70% of the overall genetic risk for AS. Despite recent improvements in treatment with TNF inhibitors, cessation of therapy results in recurrence of symptoms in the majority of patients studied to date, and it remains unclear as to whether continued treatment alters long-term outcomes including ankylosis (4). The response to TNF inhibitors is best when initiated early in the course of the disease (5). However, there is often a substantial delay in diagnosis, averaging 7-8 years from the onset of symptoms (6). A clearer understanding of the underlying abnormalities that contribute to disease pathogenesis may lead to more prompt diagnosis and improved treatment.
Several studies support an important role for macrophages in spondyloarthritis (SpA) pathogenesis. For example, affected tissues from patients with AS or undifferentiated SpA exhibit abundant macrophages (7-10). In involved sacroiliac tissue numerous CD68+ activated macrophages and osteoclasts, as well as abundant CD3+ T cells have been reported (9). Qualitatively similar observations have been made in entheses and synovial tissue from patients with undifferentiated spondyloarthritis (7, 10). While macrophages are also common in other forms of inflammatory arthritis, there appears to be a preferential increase in macrophages expressing the CD163 scavenger receptor in both synovium and colonic mucosa from patients with SpA, with the colonic changes being present even in the absence of overt gastrointestinal disease (11, 12). While macrophages are common in inflammatory lesions from SpA patients and exhibit gene expression differences, it remains unclear the extent to which these differences reflect in vivo exposures vs. fundamental properties related directly to genotype.
The ability to measure expression of the majority of genes simultaneously has revealed patterns in complex biological samples that are reflective of certain disease processes. For example, peripheral blood mononuclear cells (PBMCs) from patients with systemic lupus erythematosus exhibit an interferon (IFN) signature reflecting increased levels of circulating type I IFNs (13). Similarly, PBMC from spondyloarthritis, juvenile rheumatoid arthritis, and psoriatic and rheumatoid arthritis patients differ from healthy subjects (14-17). In these examples the gene expression patterns reflect a large number of downstream events in multiple cell types and may even be secondary to changes in the cellular composition of complex samples. In most cases disease specificity of gene expression differences across closely related rheumatic diseases remains to be established. Gene expression profiling methods have also been applied to isolated cell types removed from in vivo influences such as immunomodulatory cytokines and drug therapy, to establish ‘gene expression phenotypes’ that, in the case of an inherited disease, are expected to be related to underlying genetic differences between patients and healthy controls (18). To date, this latter approach has not been widely applied to rheumatic conditions.
In this study, we investigated whether macrophages derived ex vivo from the peripheral blood of AS patients exhibit gene expression differences compared to healthy controls. Unexpectedly, we found that multiple IFN-γ-responsive genes were dysregulated (underexpressed or overexpressed) in AS macrophages relative to healthy subjects. These differences were eliminated when macrophages were treated with exogenous IFN-γ. Furthermore, the relative expression of the IFN-γ gene was significantly lower in cells from AS patients, and could not be induced by LPS, in striking contrast to healthy controls. Taken together, these results suggest that macrophages from AS patients exhibit a ‘reverse’ IFN-γ signature due to an intrinsic defect in IFN-γ expression and its autocrine consequences. The ability to reproducibly distinguish AS patient macrophages from healthy controls on the basis of gene expression differences raises the possibility that this approach could be used to facilitate early diagnosis. In addition, reduced IFN-γ expression has several implications for pathogenesis.
Materials and Methods
Study subjects
Six patients classified as having ankylosing spondylitis by modified New York criteria, and two meeting European Spondyloarthritis Study Group (ESSG) and Amor Criteria for Undifferentiated Spondyloarthritis were studied (Table 1) (19-21). Both subjects with Undifferentiated Spondyloarthritis, met clinical criteria for AS, had extensive family histories of HLA-B27-associated disease, and had sacroiliitis by report, but radiographic documentation was unavailable. None of the subjects were related to one another. The nine healthy controls had no personal or family history of inflammatory arthritis, and also were unrelated to one another or to the patients. Other subject characteristics are shown in Table 1. Controls had a similar age and sex distribution to the patients. Peripheral blood from all healthy controls and five patients was obtained through Cincinnati Children's Hospital Medical Center (CCHMC) while three patients were enrolled and peripheral blood obtained by Dr. Robert Inman (Toronto Western Hospital, Toronto, Canada). All subjects provided informed consent per IRB-approved protocol.
Table 1.
Characteristics of subjects with ankylosing spondylitis and healthy controls
| Patients | Controls | |
|---|---|---|
| Age (yrs)* | 30.5 (17-61) | 35 (28-48) |
| Sex (Male/Total) | 7/8 | 6/9 |
| Family History AS | 6/8 | 0 |
| Dis. Duration (yrs) | 13 (<1-43) | NA |
| Medications: | ||
| NSAIDs only | 4/8 | 0/9 |
| TNF inhibitor | 4/8 | 0/9 |
| Methotrexate | 1/8 | 0/9 |
Median (range);
NA, not applicable
Macrophage derivation and stimulation
Peripheral blood (∼40 ml) was obtained by venipuncture directly into ACD (Acid Citrate Dextrose) tubes (BD Biosciences, San Jose, CA) and transported to the research laboratory at CCHMC. Samples were diluted with phosphate-buffered Saline (PBS) then under-laid with Ficoll-Paque Plus (Amersham Biosciences, Piscataway, NJ) and centrifuged under standard conditions to separate mononuclear cells. PBMC were removed and plated in non-supplemented Cellgro RPMI (Mediatech, Herndon, VA) at 37°C for 2 hours. Following removal of non-adherent cells and media, attached cells were cultured in RPMI supplemented with 10% fetal bovine serum (HyClone, Logan, UT), HEPES (Sigma, St. Louis, MO), penicillin/streptomycin (Gibco), L-glutamine (Fisher Scientific, Pittsburgh, PA) (R-10) and recombinant human GM-CSF (100 units/ml) (PeproTech, Rocky Hill, NJ) (Day 0). Every other day, 75% of the media was removed and fresh R-10 supplemented with GM-CSF was added. For IFN-γ treatment, recombinant human IFN-γ (R&D Systems, Minneapolis, MN) was added (100 units/ml) on Day 6 for 24 hours. For LPS treatment, samples were stimulated with LPS (Salmonella typhimurium, Sigma-Aldrich, St. Louis, MO) (10 ng/mL) for 3 hours on Day 7. For RNA isolation macrophages harvested at day 7 were washed twice with PBS, then re-suspended in TRIzol (Invitrogen, Carlsbad, CA) and processed according to the manufacturer's instructions. Macrophage images were captured at 20× on a Zeiss Axiovert 200M inverted microscope and visualized using Axiovision 3.1 software (Carl Zeiss Vision). Intracellular CD68 staining was performed after incubation of washed cells in ice cold PBS plus 0.5 mM EDTA (Sigma) for 10 minutes. Cells were collected by scraping, fixed in 0.8% Formalin, and incubated with human IgG (gift of Claire Chougnet) followed by permeabilization with 0.1% Saponin prior to staining with isotype control or anti-CD68PE (BD PharMingen, BD Biosciences). FACS data were collected on a FACSCalibur (BD Biosciences) and analyzed using CellQuest software (BD Biosciences).
Measuring gene expression differences
RNA quality was verified using an Agilent Bioanalyzer 2100, then reverse transcribed, converted to biotinylated cRNA using standard Affymetrix protocols, and hybridized to Affymetrix microarrays (HG-U133 Plus 2.0) according to protocols used by the Cincinnati Children's Research Foundation Affymetrix GeneChip core. The HG-U133 Plus 2.0 microarray uses 54,120 probe sets to interrogate 47,401 UniGene subclusters (ESTs) representing 38,572 UniGene clusters (genes) and 841 additional potential full length clusters (http://www.affymetrix.com/support/technical/technotes/hgu133_p2_technote.pdf). To confirm relative gene expression levels by real time PCR, DNase (Invitrogen, Carlsbad, CA) treated RNA was reverse transcribed using SuperScript II (Invitrogen, Carlsbad, CA), and then quantified using the iCycler iQ™ Real Time PCR Detection System (Bio-Rad, Hercules, CA). Primers were designed using Beacon Designer 4.0 software, and purchased from Premier Biosoft (Palo Alto, CA). Primer sequences are available upon request.
Data analysis and statistics
Raw Affymetrix data (.cel files) from 33 arrays (-/+ IFN-γ for 17 subjects with one missing IFN-γ treated sample) were loaded into GeneSpring 7.3 and transformed using the RMA algorithm (Robust Multi-Array Average) (22). All expression values were normalized to the median of untreated samples. To determine whether cells at the end of the 7-day GM-CSF culture period expressed macrophage genes, untreated control samples were compared to three universal standard samples derived from PBMC (unpublished observations). Known genes with a minimum 30-fold difference in expression were further investigated in PubMed for function and cell-specific expression.
ANOVA was used to determine differential gene expression among AS patient and healthy subject samples without (baseline; no treatment) and with, 24 hours of IFN-γ treatment. A false-discovery rate of 5% was used to control for multiple testing, followed by Tukey post-hoc testing to identify specific differences between groups. IFN responsive genes were determined by analyzing the subset of probe sets showing statistically significant differences between IFN-γ-treated controls and untreated controls in the ANOVA. A fold-change cutoff filter (patient/control ratios greater than 1.25 or less than 0.75) was used to limit the analysis to more biologically significant gene expression differences. To obtain the genes listed in Table 2 additional filters were used, including a p value of 0.01 (two-tailed Student's t test comparing untreated patient and control samples) and an expression level of at least 100 in 16/33 samples. Clustering was performed using Pearson correlation and average linkage for both gene clusters and distance correlation with complete linkage for condition clusters. Principal component analysis was performed using GeneSpring 7.0 centering. Subsequent analyses shown in Figures 3 and 4 comparing expression of individual genes utilized a two-tailed Student's t test to determine statistical significance.
Table 2.
Differentially expressed IFN-responsive genes.
| Gene Description | Common Name | Probe Set | Pt/Ctrl (-IFNγ) |
Pt/Ctrl (+IFNγ) |
Pt Induction (+/-IFNγ) |
Ctrl Induction (+/-IFNγ) |
Pt/Ctrl Induction (with IFNγ) |
|---|---|---|---|---|---|---|---|
| Guanylate binding protein 5 | GBP5 | 238581_at | 0.31 | 0.83 | 68.73 | 30.21 | 2.28* |
| Guanylate binding protein 1 | GBP1 | 231577_s_at | 0.38 | 0.86 | 18.51 | 9.52 | 1.95* |
| Chemokine CXC motif ligand 9 (MIG) | CXCL9 | 203915_at | 0.44 | 0.56 | 25.72 | 18.36 | 1.4 |
| Epithelial stromal interaction 1 | EPSTI1 | 227609_at | 0.44 | 0.93 | 20.26 | 10.5 | 1.93* |
| GTP cyclohydrolase 1 | GCH1 | 204224_s_at | 0.47 | 1.01 | 24.61 | 12.65 | 1.95* |
| Interleukin 32 | IL-32 | 203828_s_at | 0.47 | 0.47 | 2.16 | 2.09 | 1.03 |
| Complement component 1 inhibitor | SERPING1 | 200986_at | 0.52 | 1.07 | 28.78 | 14.51 | 1.98* |
| Retinoic acid receptor responder (RIG1) | RARRES3 | 204070_at | 0.53 | 1.28 | 49.73 | 21.38 | 2.33* |
| Signal transducer and activator of transcript | STAT1 | 209969_s_at | 0.55 | 1.01 | 7.59 | 4.35 | 1.75* |
| Rad. S-adenosyl met. dom. containing | RSAD2 | 242625_at | 0.55 | 1.15 | 103.71 | 55.91 | 1.85* |
| GTPase, very large interferon inducible 1 | GVIN1 | 220577_at | 0.56 | 0.68 | 3.45 | 2.84 | 1.21 |
| TNF alpha induced 3 (A20) | TNFAIP3 | 202643_s_at | 0.57 | 0.65 | 2.25 | 2.01 | 1.12 |
| Interleukin 15 | IL15 | 217371_s_at | 0.57 | 1.04 | 103.71 | 55.91 | 1.85* |
| MHC class II DO alpha | HLA-DOA | 226878_at | 0.66 | 0.83 | 4.51 | 3.57 | 1.26 |
| Apolipoprotein 3 | APOL3 | 221087_s_at | 0.67 | 1.09 | 12.03 | 7.59 | 1.59 |
| Interleukin 15 receptor alpha | IL15RA | 207375_s_at | 0.71 | 1.17 | 7.93 | 4.89 | 1.62* |
| PR domain containing 1 (BLIMP1) | PRDM1 | 228964_at | 0.74 | 0.90 | 2.19 | 1.8 | 1.22* |
| SMAD specific E3 ubiquitin protein ligase | SMURF2 | 205596_s_at | 0.74 | 0.92 | 2.29 | 1.91 | 1.2 |
| Proteasome activator subunit 2 | PSME2 | 201762_s_at | 0.75 | 1.03 | 3.57 | 2.66 | 1.34* |
| Isocitrate dehydrogenase 2 | IDH2 | 210045_at | 1.30 | 1.21 | 0.72 | 0.76 | 0.94 |
| Chaperone ABC1 act. of bc1 complex | CABC1 | 218168_s_at | 1.32 | 1.20 | 0.68 | 0.74 | 0.93 |
| Phospholipase; phosphatidylcholine | PLD1 | 205203_at | 1.33 | 1.24 | 0.64 | 0.67 | 0.95 |
| Phosphatidyl inositol 4-kinase | PI4KII | 215134_at | 1.33 | 1.18 | 0.65 | 0.72 | 0.90 |
| Vasohibin | VASH1 | 203940_s_at | 1.35 | 1.20 | 0.59 | 0.67 | 0.87 |
| Phytanoyl-CoA2-hydroxylase | PHYH | 203335_at | 1.36 | 1.36 | 0.65 | 0.66 | 0.98 |
| Complement regulatory protein | CD59 | 212463_at | 1.40 | 1.43 | 0.69 | 0.67 | 1.03 |
| Inositol polyphos.-5-phosphatase | INPP5A | 203006_at | 1.42 | 1.22 | 0.53 | 0.63 | 0.85 |
| TBC1 domain family member 7 | TBC1D7 | 223461_at | 1.49 | 1.48 | 0.47 | 0.47 | 0.99 |
| Cat eye syndrome, candidate 6 | CECR6 | 224393_s_at | 1.53 | 1.42 | 0.66 | 0.67 | 0.99 |
| Dexamethasone induced protein | DEXI | 203733_at | 1.54 | 1.14 | 0.24 | 0.32 | 0.73 |
Criteria for inclusion of genes listed here are in Materials and Methods.
p < 0.01
Pt/Ctrl (-IFN-γ); Average expression value for gene in untreated patient cells, divided by average expression value for gene in untreated control cells.
Pt/Ctrl (+IFN-γ); Same as above for IFN-γ-treated cells.
Pt (+/-IFN-γ); Average expression value for gene in IFN-γ-treated patient cells, divided by average expression value for gene in untreated patient cells (i.e. Induction with IFN-γ).
Ctrl (+/-IFN-γ); Same as above for control cells.
Pt/Ctrl; Induction with IFN-γ for patients divided by induction with IFN-γ for controls.
Figure 3. Comparison of relative gene expression determined by microarray and quantitative PCR.
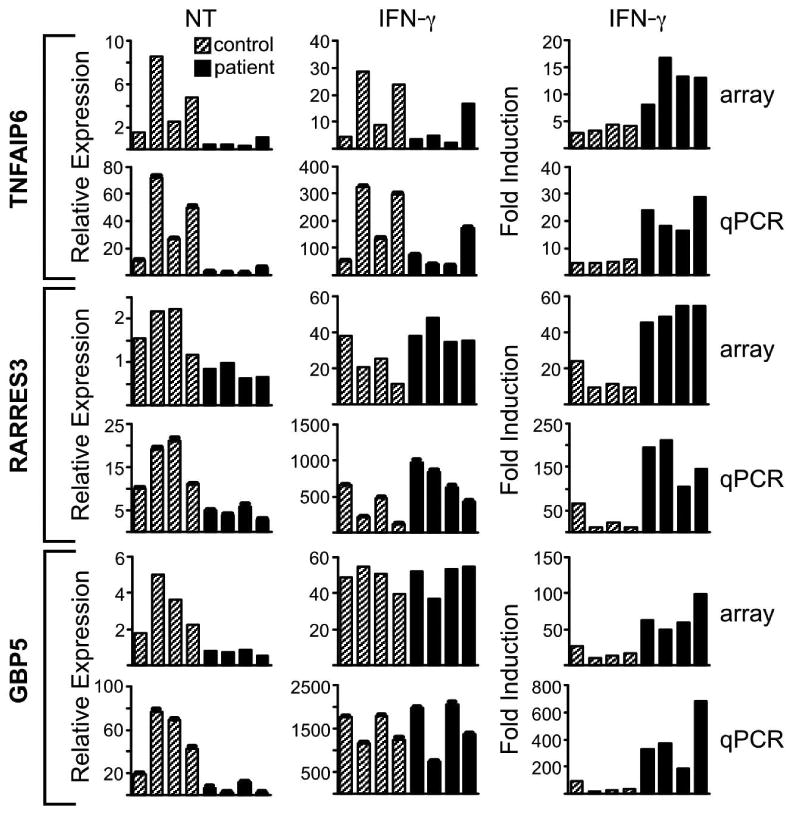
Relative expression and IFN-γ-mediated induction of three genes, (A) TNFAIP6, (B) RARRES3, and (C) GBP5 was assessed in 4 healthy controls (gray bars) and 4 AS patients (black bars) by microarray (array) and quantitative PCR (qPCR), with the latter normalized to GAPDH. The left column depicts relative expression in untreated cells (NT); the middle column relative expression after IFN-γ treatment (IFN-γ); and the right column shows relative induction after IFN-γ treatment compared to untreated (IFN-γ/NT). For left (NT) and right (IFN-γ induction) column graphs, p values comparing the average of patient samples and control samples are less than 0.05. In the middle column (IFN-γ), all p values are greater than 0.05 for similar comparisons.
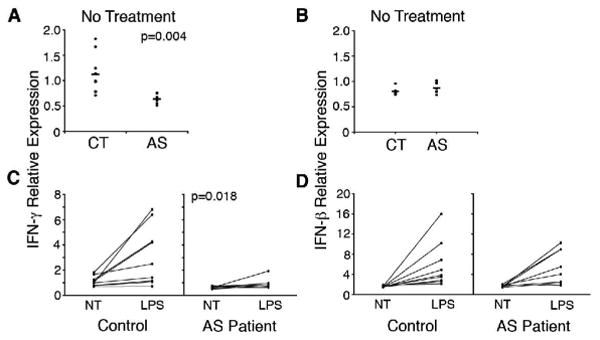
Figure 4. IFN mRNA expression in AS and healthy control subjects.
Comparison of IFN-γ (A) and IFN-β (B) mRNA expression levels from microarray data in untreated macrophages from healthy controls (CT), and AS patients (AS). Comparison of IFN-γ (C) and IFN-β (D) mRNA expression levels in untreated and LPS stimulated (10 ng/ml, 3 h) macrophages from healthy controls (Control), and AS patients.
Results
Macrophages derived from AS patients and healthy subjects
The patients exhibited a broad range of disease duration (from less than one year to >43 yrs) and current medications (Table 1). To obtain macrophages, adherent PBMC were cultured in GM-CSF for 7 days with media changes every other day. The resulting cell population was morphologically homogeneous and macrophage-like in appearance, based on size and the presence of numerous adhering processes (Figure 1). Analysis of marker expression by FACS showed that these cells were >98% CD68 positive (Figure 1). About 1.5% of cells were positive for CD90 (fibroblasts), while there was no significant CD3 (T-cell), CD56 (NK cell), CD19 (B cell) or CD45-CD105+ (endothelial) staining (data not shown).
Figure 1. Macrophage characteristics.
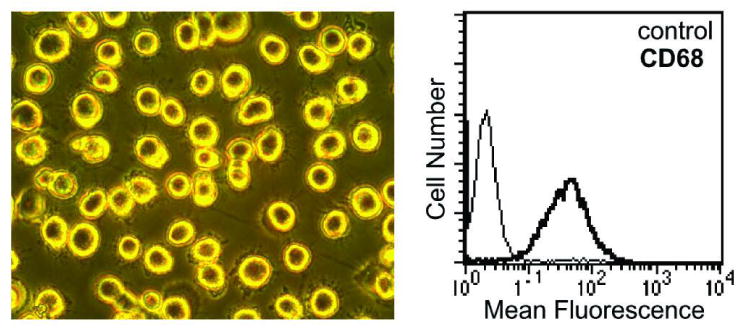
Representative PBMC-derived macrophages (20×) at day 7 (left), with FACS analysis (right) showing isotype control (thin line) and anti-CD68 antibody staining (bold line).
Comparing gene expression profiles from the ex vivo-derived macrophages with a ‘universal standard’ composed of PBMC RNA revealed 61 genes that were dramatically (30 fold or more) overexpressed in macrophages. Twenty-seven of these genes, including carboxypeptidase M, CD71 transferrin receptor, and chitotriosidase (CHIT1), have been reported to be expressed selectively in macrophages. Thus, by appearance, FACS staining, and gene expression profiles, the cells derived from peripheral blood and examined in this study were macrophages.
Differential macrophage gene expression distinguishes AS patients from healthy subjects
Expression data for macrophages derived from AS and healthy subjects, either untreated or treated with IFN-γ for 24 hours (four groups), were compared to identify differentially expressed genes. Using ANOVA and accounting for a 5% false-discovery rate followed by Tukey analysis, gene expression differences were identified. Between untreated (no IFN-γ added) AS patients and healthy subjects, there were 357 expression differences, with 198 probe sets detecting greater than 25% expression difference. The 198 probe sets measure relative expression of 141 unique genes. Using these 198 probe sets, patients and controls segregated by clustering (Figure 2A) and principal component analysis (PCA; Figure 2B). Note that for IFN-γ-treated cells, one patient clustered with the controls (Figure 2A; green in purple bar). Other features of this analysis that are worth noting include the high degree of homogeneity in the AS patient samples, as evidenced by the clustering in PCA (orange dots; Figure 2B), and also apparent in the expression patterns (orange bar; Figure 2A). This is despite variable age, disease duration, and current medications (Table 1). Together, these findings show consistent macrophage gene expression differences between healthy controls and AS patients.
Figure 2. Clustering of subjects by gene expression and Principle Components Analysis.
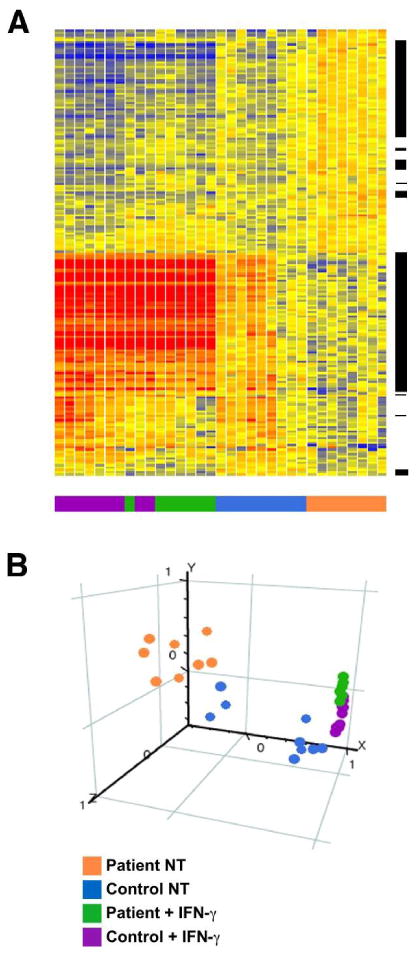
PBMC-derived macrophages were incubated without or with IFN-γ (100 U/ml for 24 h), and then RNA was isolated and subjected to microarray analysis with expression differences identified as described in Materials and Methods. (A) Heat Map showing the relative expression of 198 differentially expressed genes (ANOVA p<0.05). Each row indicates relative expression for one probe set, and each column represents a microarray from a subject sample. AS and healthy control subject samples are color coded (bottom of figure) with the key indicated at the right. Clustering was performed using Pearson correlation. Heat map colors indicate high (red) or low (blue) expression after normalization to the median of all untreated samples. The range of expression is 0.33 (dark blue) to 3 (dark red). Black bars to the right of the gene tree reveal the location of the IFN-γ-responsive subset of 115 probe sets representing 78 genes. (B) Principal Components Analysis (PCA) segregates AS patient (orange) and healthy control (blue) samples based on gene expression differences. Following IFN-γ treatment, samples cluster more closely together (green and purple), reflecting the elimination of differences between IFN-responsive genes.
Reverse IFN signature in AS macrophages
Further consideration of the 141 differentially expressed genes revealed that many have been reported to be IFN-responsive (e.g. guanylate binding proteins (GBPs), STAT1, IRF1). Indeed, since our experiments included IFN-γ treatment of cells, we were able to conclude that of the 141 genes, 78 (represented by 115 probe sets) were IFN-responsive (55% of the total). This subset is marked by the black bars to the right of the gene tree in Figure 2A. The known genes within the IFN subset with an expression level of at least 100 in half of the samples identified by ANOVA and a p value of less than or equal to 0.01 are shown in Table 2. IFN-γ-responsive genes that were upregulated by IFN-γ treatment in our experiments were expressed at lower levels in AS patient macrophages compared to healthy controls. Conversely, IFN-γ-responsive genes that were downregulated by IFN-γ were more highly expressed in untreated AS patient macrophages. Thus, it appeared that AS patient macrophages exhibited a ‘reverse’ IFN-γ signature prior to treatment.
RT-PCR Validation
To confirm and validate quantitative expression differences, three IFN-regulated genes (GBP5, RARRES3, and TNFAIP6) were measured by quantitative real time PCR (qPCR). GBP-5 is a member of the guanylate binding protein family that act as anti-viral and anti-angiogenic factors (23). TNFAIP6 (also known as TSG6) is also regulated by TNF-α, and protects against arthritis in mice, since targeted deletion exacerbates proteoglycan-induced disease (24), and transgenic overexpression ameliorates collagen-induced arthritis (25). RARRES3 (also known as RIG1) is a retinoid-induced gene with decreased expression reported in psoriasis patients (26). Quantitative RT-PCR results without (NT) and with (IFN-γ) treatment reveal the same relationship between patients and control subjects seen with microarray analysis (Figure 3). There is lower expression of these genes in AS macrophages relative to healthy controls (NT), and the differences are eliminated with IFN-γ treatment (IFN-γ) as shown by similar maximum gene expression levels (p >0.05 comparing expression levels between AS patients and healthy controls). Thus, addition of exogenous IFN-γ normalized expression levels, indicating that responsiveness to IFN-γ is not impaired in AS patient-derived macrophages.
Decreased IFN-γ expression in AS patient macrophages
To determine whether decreased expression of IFNs in AS patient-derived macrophages was a plausible explanation for our results, relative mRNA expression was examined from the microarray data (Figure 4A). AS patients expressed less IFN-γ mRNA compared to controls (average 0.6 patient vs. 1.1 control, p=0.004) whereas there was no difference in IFN-β mRNA (Figure 4B). When cells were stimulated with LPS, AS patients exhibited virtually no induction of IFN-γ (Figure 4C; average 1.5 vs. 2.7, p=0.018), whereas IFN-β induction was intact (Figure 4D) and no different than healthy controls. These data suggest that there is an intrinsic defect in the production of IFN-γ by AS patient macrophages, and support the concept that this is responsible for the ‘reverse’ IFN-γ signature.
Discussion
In this study we examined gene expression patterns in macrophages derived over one week in culture, rather than complex mixtures of cells examined immediately after removal from the individual. We found that macrophages derived from subjects with AS exhibit a ‘reverse’ IFN signature where genes typically upregulated by IFN are underexpressed, and genes downregulated by IFN are overexpressed, relative to healthy controls. This reverse IFN signature correlates with reduced expression of the IFN-γ gene, suggesting that an autocrine effect may be involved. These results provide insight into gene expression differences that may be inherent to individuals with AS, a disease that is largely genetically determined (1), and thus may be informative for upstream mechanisms contributing to pathogenesis.
We derived macrophages over several days ex vivo in order to eliminate gene expression differences that might be the result of in vivo effects of serum and tissue factors. Thus, finding differences in the relative expression of IFN-regulated genes was initially surprising. However, autocrine effects of type I (IFN-α/β) and type II IFNs (IFN-γ) produced by macrophages have been well documented (27, 28), suggesting two plausible explanations for this result. The first is that macrophages from patients produce less IFN (type I or type II) than cells from healthy controls, resulting in lower expression of genes positively regulated by IFN, and higher expression of IFN-repressed genes. A second possibility is that IFN production is similar, but that AS patient macrophages are less responsive. The normalization of expression of IFN-responsive genes across patients and controls when cells were treated with exogenous IFN-γ indicates that there is no inherent defect in responsiveness to this cytokine. However, since cells were maximally stimulated (100 U/ml for 24 h), we cannot rule out subtle differences that might occur with lower concentrations for brief periods. In support of the first mechanism, we found significantly lower expression of the IFN-γ gene in macrophages from AS patients. This was specific for IFN-γ, as IFN-β mRNA levels were no different between patients and controls. Further support for a defect in expression of IFN-γ comes from the LPS stimulation experiment, where there is little to no induction of IFN-γ in AS patients. Our results are consistent with a mechanism whereby low levels of IFN-γ produced by cultured macrophages maintain the expression levels of IFN-responsive genes. Lower expression of IFN-γ by macrophages from AS patients would lead to down regulation of IFN-induced genes and upregulation of IFN repressed genes, relative to healthy controls. We were unable to measure immunoreactive IFN-γ protein in culture supernatants from healthy controls or AS patients, consistent with the notion that these are autocrine effects of low levels of the cytokine (unpublished observations). Since there is a large overlap in genes responsive to IFN-γ and IFN-β (29), we cannot rule out autocrine effects of IFN-β. However, this seems unlikely since there is no difference in expression of the IFN-β gene or its responsiveness to LPS.
We considered other possible sources of IFN-γ in the macrophage cultures. NK cells and T cells are quantitatively important producers of IFN-γ during innate and adaptive immune responses, respectively. Indeed, it has been shown that even small numbers of these cells persisting in cultures of bone marrow-derived macrophages or dendritic cells (DCs), can be important producers of IFN-γ (particularly when cells were stimulated with IL-12), that had previously been attributed to the macrophages or DCs (30). This is unlikely to account for our results for several reasons. First, to the extent that this occurs with peripheral blood derived macrophages as it does with bone marrow preparations, we would expect patient and healthy control cultures to be affected similarly. Second, T cell carryover is more likely to be a problem with IL-12 stimulation, since it is a potent inducer of IFN-γ production by NK and T cells. Finally, the LPS stimulation results, where we used low concentrations (10 ng/ml) for a brief period (3 h), are most consistent with an abnormality in macrophage IFN-γ expression, since T cells and most NK cells are not readily responsive to this Toll-like receptor agonist.
Previous studies of cytokine expression in spondyloarthritis and AS support the idea that IFN-γ expression may be dysregulated. Gut biopsy samples show a reduced Th1 profile in lymphocytes from spondyloarthritis patients (31). IFN-γ was also lower in synovial tissue from spondyloarthritis patients compared to individuals with rheumatoid arthritis (32), and lower in synovial fluid from HLA-B27 positive patients with Chlamydia-induced reactive arthritis compared to HLA-B27 negative patients (33). A lower frequency of IFN-γ positive T cells has also been reported in AS patients (34), consistent with previous observations showing that in vitro stimulation of whole blood with Mycoplasma arthritidis superantigen, or mitogens (PHA and ConA) resulted in less IFN-γ production (35). The nature of these differences, and whether they are primary or secondary, remains to be determined. However, our results raise the possibility that T cell and/or NK cell expression of IFN-γ may be altered similar to macrophages, particularly if the defect is genetic in origin.
Abnormal cytokine responses to arthritogenic bacteria have been implicated in pathogen persistence (36, 37). Along these lines it is worth noting that macrophage-derived IFN-γ is important for controlling infection with certain intracellular gram-negative bacteria (38). In these studies, infection of macrophages with Chlamydia pneumonia led to an increase in IFN-γ production. In IFN-γ receptor-deficient macrophages, bacterial load was significantly higher, implicating an autocrine/paracrine mechanism whereby IFN-γ signaling helps to limit intracellular bacterial growth. In addition, there is evidence to suggest that autocrine macrophage-derived IFN-γ plays a role in the pathogenesis of glomerulonephritis in a mouse model (27). Thus, decreased IFN-γ production by macrophages could impair the host's ability to clear certain organisms, which in turn could contribute to the pathogenesis of spondyloarthritis. This has experimental support from recent studies of Chlamydia-induced arthritis in rats, in which susceptibility and resistance between strains corresponds to the synovial decreased or enhanced IFN-γ expression, respectively (39).
In addition to IFN-γ dysregulation hindering pathogen clearance, reduced expression can contribute to activation of the IL-23/IL-17 axis. For example, induction of arthritis with collagen immunization in IFN-γ-deficient mice results in greater expansion of IL-17-expressing CD4 T cells and increased IL-17 production (40). There is increasing evidence for the involvement of this axis in AS and spondyloarthritis pathogenesis. We have recently found overexpression of IL-23 and IL-17, along with expansion of IL-17-expressing CD4 T cells, in the colon of HLA-B27 transgenic rats with spondyloarthritis-like disease (41) (manuscript in preparation). In humans, IL-17 is overexpressed in synovial fluid of patients with undifferentiated spondyloarthritis (42), and IL23R (IL-23 receptor gene) polymorphisms have been associated with AS susceptibility (3). The IL-23 receptor is expressed on developing T cells that become Th17 committed. This enables them to respond to IL-23, which in turn drives T cell survival and expression of IL-17 (43). Thus, our results reported here raise the possibility that low IFN-γ expression could contribute to Th17 development in patients with AS.
Several studies have demonstrated that the HLA-B27 heavy chain has a tendency to misfold during synthesis and assembly into complexes with β2-microglobulin (β2m) and peptide in the endoplasmic reticulum (ER) (44). Protein misfolding in the ER can lead to a stress response known as the unfolded protein response (UPR) resulting in increased transcription of many UPR target genes (45). We have found that bone marrow derived macrophages from HLA-B27/human β2m transgenic rats exhibit UPR activation when transgene expression is upregulated (46, 47), particularly when cells are exposed to combinations of IFN (type II or type I) and agents that activate NF-κB (e.g. TNF-α) (47). Importantly, the UPR was not seen in bone marrow macrophages from HLA-B7/human β2m transgenic rats despite comparable expression of heavy chain and human β2m (46), consistent with biochemical evidence that HLA-B7 does not misfold (48, 49). We did not observe evidence for UPR activation in the human peripheral blood derived macrophages studied here. However, despite 24 h of exposure to IFN-γ we also did not see significant upregulation of HLA-B mRNA transcripts (data not shown). Further studies on protein expression and/or qPCR quantitation were not possible due to limitations in material. Increased expression of the UPR target gene, BiP/Hspa5, has been reported in synovial fluid mononuclear cells from spondyloarthritis patients compared to rheumatoid arthritis controls (50). Since these cells had been exposed to a highly inflammatory milieu, which contains numerous cytokines, it may be necessary to stimulate peripheral blood-derived human macrophages from AS/spondyloarthritis patients to additional stimuli that provide robust HLA class I upregulation in order to definitively determine whether UPR activation occurs.
It will be important to confirm and extend these results by comparing additional AS patients with other disease controls, examining T and NK cells for their capacity to produce IFN-γ, and determining whether this low IFN-γ production contributes to Th17 development and IL-17 overexpression. Such studies will help to determine the specificity and consequences of IFN-γ gene dysregulation for the pathogenesis of spondyloarthritis.
Acknowledgments
Supported by the National Institutes of Health (NIAMS) grants AR046177 and AR043872 (RAC), a Translational Research Award from CCHMC (RAC), and the Arthritis Foundation (JAS).
References
- 1.Reveille JD. The genetic basis of ankylosing spondylitis. Curr Opin Rheumatol. 2006;18(4):332–41. doi: 10.1097/01.bor.0000231899.81677.04. [DOI] [PubMed] [Google Scholar]
- 2.Brown MA. Non-major-histocompatibility-complex genetics of ankylosing spondylitis. Best Pract Res Clin Rheumatol. 2006;20(3):611–21. doi: 10.1016/j.berh.2006.03.005. [DOI] [PubMed] [Google Scholar]
- 3.Burton PR, Clayton DG, Cardon LR, Craddock N, Deloukas P, Duncanson A, et al. Association scan of 14,500 nonsynonymous SNPs in four diseases identifies autoimmunity variants. Nat Genet. 2007;39(11):1329–1337. doi: 10.1038/ng.2007.17. [DOI] [PMC free article] [PubMed] [Google Scholar]
- 4.Brandt J, Marzo-Ortega H, Emery P. Ankylosing spondylitis: new treatment modalities. Best Pract Res Clin Rheumatol. 2006;20(3):559–70. doi: 10.1016/j.berh.2006.03.009. [DOI] [PubMed] [Google Scholar]
- 5.Rudwaleit M, Listing J, Brandt J, Braun J, Sieper J. Prediction of a major clinical response (BASDAI 50) to tumour necrosis factor alpha blockers in ankylosing spondylitis. Ann Rheum Dis. 2004;63(6):665–70. doi: 10.1136/ard.2003.016386. [DOI] [PMC free article] [PubMed] [Google Scholar]
- 6.Feldtkeller E, Khan MA, van der Heijde D, van der Linden S, Braun J. Age at disease onset and diagnosis delay in HLA-B27 negative vs. positive patients with ankylosing spondylitis. Rheumatol Int. 2003;23(2):61–6. doi: 10.1007/s00296-002-0237-4. [DOI] [PubMed] [Google Scholar]
- 7.Baeten D, De Keyser F. The histopathology of spondyloarthropathy. Curr Mol Med. 2004;4(1):1–12. doi: 10.2174/1566524043479310. [DOI] [PubMed] [Google Scholar]
- 8.Bollow M, Fischer T, Reisshauer H, Backhaus M, Sieper J, Hamm B, et al. Quantitative analyses of sacroiliac biopsies in spondyloarthropathies: T cells and macrophages predominate in early and active sacroiliitis-cellularity correlates with the degree of enhancement detected by magnetic resonance imaging. Ann Rheum Dis. 2000;59:135–140. doi: 10.1136/ard.59.2.135. [DOI] [PMC free article] [PubMed] [Google Scholar]
- 9.Braun J, Bollow M, Neure L, Seipelt E, Seyrekbasan F, Herbst H, et al. Use of immunohistologic and in situ hybridization techniques in the examination of sacroiliac joint biopsy specimens from patients with ankylosing spondylitis. Arthritis Rheum. 1995;38:499–505. doi: 10.1002/art.1780380407. [DOI] [PubMed] [Google Scholar]
- 10.McGonagle D, Marzo-Ortega H, O'Connor P, Gibbon W, Hawkey P, Henshaw K, et al. Histological assessment of the early enthesitis lesion in spondyloarthropathy. Ann Rheum Dis. 2002;61(6):534–7. doi: 10.1136/ard.61.6.534. [DOI] [PMC free article] [PubMed] [Google Scholar]
- 11.Baeten D, Demetter P, Cuvelier CA, Kruithof E, Van Damme N, De Vos M, et al. Macrophages expressing the scavenger receptor CD163: a link between immune alterations of the gut and synovial inflammation in spondyloarthropathy. J Pathol. 2002;196:343–350. doi: 10.1002/path.1044. [DOI] [PubMed] [Google Scholar]
- 12.Demetter P, De Vos M, Van Huysse JA, Baeten D, Ferdinande L, Peeters H, et al. Colon mucosa of both spondyloarthritis and Crohn's disease patients is enriched with macrophages expressing the scavenger receptor CD163. Ann Rheum Dis. 2005;64:321–324. doi: 10.1136/ard.2003.018382. [DOI] [PMC free article] [PubMed] [Google Scholar]
- 13.Bennett L, Palucka AK, Arce E, Cantrell V, Borvak J, Banchereau J, et al. Interferon and granulopoiesis signatures in systemic lupus erythematosus blood. J Exp Med. 2003;197(6):711–23. doi: 10.1084/jem.20021553. [DOI] [PMC free article] [PubMed] [Google Scholar]
- 14.Barnes MG, Aronow BJ, Luyrink LK, Moroldo MB, Pavlidis P, Passo MH, et al. Gene expression in juvenile arthritis and spondyloarthropathy: pro-angiogenic ELR+ chemokine genes relate to course of arthritis. Rheumatology (Oxford) 2004;43(8):973–9. doi: 10.1093/rheumatology/keh224. [DOI] [PubMed] [Google Scholar]
- 15.Batliwalla FM, Li W, Ritchlin CT, Xiao X, Brenner M, Laragione T, et al. Microarray analyses of peripheral blood cells identifies unique gene expression signature in psoriatic arthritis. Mol Med. 2005;11(1-12):21–9. doi: 10.2119/2006-00003.Gulko. [DOI] [PMC free article] [PubMed] [Google Scholar]
- 16.Gu J, Marker-Hermann E, Baeten D, Tsai WC, Gladman D, Xiong M, et al. A 588-gene microarray analysis of the peripheral blood mononuclear cells of spondyloarthropathy patients. Rheumatology. 2002;41:759–766. doi: 10.1093/rheumatology/41.7.759. [DOI] [PubMed] [Google Scholar]
- 17.Koczan D, Guthke R, Thiesen HJ, Ibrahim SM, Kundt G, Krentz H, et al. Gene expression profiling of peripheral blood mononuclear leukocytes from psoriasis patients identifies new immune regulatory molecules. Eur J Dermatol. 2005;15(4):251–7. [PubMed] [Google Scholar]
- 18.Watts JA, Morley M, Burdick JT, Fiori JL, Ewens WJ, Spielman RS, et al. Gene expression phenotype in heterozygous carriers of ataxia telangiectasia. Am J Hum Genet. 2002;71(4):791–800. doi: 10.1086/342974. [DOI] [PMC free article] [PubMed] [Google Scholar]
- 19.Dougados M, van der Linden S, Juhlin R, Huitfeldt B, Amor B, Calin A, et al. The European Spondyloarthropathy Study Group preliminary criteria for the classification of spondyloarthropathy. Arthritis Rheum. 1991;34:1218–1227. doi: 10.1002/art.1780341003. [DOI] [PubMed] [Google Scholar]
- 20.van der Linden S, Valkenburg HA, Cats A. Evaluation of diagnostic criteria for ankylosing spondylitis. Arthritis Rheum. 1984;27:361–368. doi: 10.1002/art.1780270401. [DOI] [PubMed] [Google Scholar]
- 21.Amor B. Usefulness of criteria for spondyloarthropathies. Joint Bone Spine. 2000;67(6):502–3. doi: 10.1016/s1297-319x(00)00202-5. [DOI] [PubMed] [Google Scholar]
- 22.Irizarry RA, Bolstad BM, Collin F, Cope LM, Hobbs B, Speed TP. Summaries of Affymetrix GeneChip probe level data. Nucleic Acids Res. 2003;31(4):e15. doi: 10.1093/nar/gng015. [DOI] [PMC free article] [PubMed] [Google Scholar]
- 23.Nguyen TT, Hu Y, Widney DP, Mar RA, Smith JB. Murine GBP-5, a new member of the murine guanylate-binding protein family, is coordinately regulated with other GBPs in vivo and in vitro. J Interferon Cytokine Res. 2002;22(8):899–909. doi: 10.1089/107999002760274926. [DOI] [PubMed] [Google Scholar]
- 24.Szanto S, Bardos T, Gal I, Glant TT, Mikecz K. Enhanced neutrophil extravasation and rapid progression of proteoglycan-induced arthritis in TSG-6-knockout mice. Arthritis Rheum. 2004;50(9):3012–22. doi: 10.1002/art.20655. [DOI] [PubMed] [Google Scholar]
- 25.Mindrescu C, Dias AA, Olszewski RJ, Klein MJ, Reis LF, Wisniewski HG. Reduced susceptibility to collagen-induced arthritis in DBA/1J mice expressing the TSG-6 transgene. Arthritis Rheum. 2002;46(9):2453–64. doi: 10.1002/art.10503. [DOI] [PubMed] [Google Scholar]
- 26.Duvic M, Helekar B, Schulz C, Cho M, DiSepio D, Hager C, et al. Expression of a retinoid-inducible tumor suppressor, Tazarotene-inducible gene-3, is decreased in psoriasis and skin cancer. Clin Cancer Res. 2000;6(8):3249–59. [PubMed] [Google Scholar]
- 27.Carvalho-Pinto CE, Garcia MI, Mellado M, Rodriguez-Frade JM, Martin-Caballero J, Flores J, et al. Autocrine production of IFN-gamma by macrophages controls their recruitment to kidney and the development of glomerulonephritis in MRL/lpr mice. J Immunol. 2002;169(2):1058–67. doi: 10.4049/jimmunol.169.2.1058. [DOI] [PubMed] [Google Scholar]
- 28.Gautier G, Humbert M, Deauvieau F, Scuiller M, Hiscott J, Bates EE, et al. A type I interferon autocrine-paracrine loop is involved in Toll-like receptor-induced interleukin-12p70 secretion by dendritic cells. J Exp Med. 2005;201(9):1435–46. doi: 10.1084/jem.20041964. [DOI] [PMC free article] [PubMed] [Google Scholar]
- 29.Der SD, Zhou A, Williams BR, Silverman RH. Identification of genes differentially regulated by interferon alpha, beta, or gamma using oligonucleotide microarrays. Proc Natl Acad Sci USA. 1998;95:15623–15628. doi: 10.1073/pnas.95.26.15623. [DOI] [PMC free article] [PubMed] [Google Scholar]
- 30.Bogdan C, Schleicher U. Production of interferon-gamma by myeloid cells--fact or fancy? Trends Immunol. 2006;27(6):282–90. doi: 10.1016/j.it.2006.04.004. [DOI] [PubMed] [Google Scholar]
- 31.Van Damme N, De Vos M, Baeten D, Demetter P, Mielants H, Verbruggen G, et al. Flow cytometric analysis of gut mucosal lymphocytes supports an impaired Th1 cytokine profile in spondyloarthropathy. Ann Rheum Dis. 2001;60:495–499. doi: 10.1136/ard.60.5.495. [DOI] [PMC free article] [PubMed] [Google Scholar]
- 32.Canete JD, Martinez SE, Farres J, Sanmarti R, Blay M, Gomez A, et al. Differential Th1/Th2 cytokine patterns in chronic arthritis: interferon gamma is highly expressed in synovium of rheumatoid arthritis compared with seronegative spondyloarthropathies. Ann Rheum Dis. 2000;59(4):263–8. doi: 10.1136/ard.59.4.263. [DOI] [PMC free article] [PubMed] [Google Scholar]
- 33.Cuchacovich R, Espinoza LR. Lower level of synovial fluid interferon-gamma in HLA-B27-positive than in HLA-B27-negative patients with Chlamydia trachomatis reactive arthritis. Rheumatology (Oxford) 2004;43(2):249–50. doi: 10.1093/rheumatology/keg440. author reply 250-1. [DOI] [PubMed] [Google Scholar]
- 34.Rudwaleit M, Siegert S, Yin Z, Eick J, Thiel A, Radbruch A, et al. Low T cell production of TNFα and IFN γ in ankylosing spondylitis: its relation to HLA-B27 and influence of the TNF-308 gene polymorphism. Ann Rheum Dis. 2001;60:36–42. doi: 10.1136/ard.60.1.36. [DOI] [PMC free article] [PubMed] [Google Scholar]
- 35.Brand JM, Neustock P, Kruse A, Alvarez-Ossorio L, Schnabel A, Kirchner H. Stimulation of whole blood cultures in patients with ankylosing spondylitis by a mitogen derived from Mycoplasma arthritidis (MAS) and other mitogens. Rheumatol Int. 1997;16(5):207–11. doi: 10.1007/BF01330297. [DOI] [PubMed] [Google Scholar]
- 36.Ekman P, Saarinen M, He Q, Gripenberg-Lerche C, Grönberg A, Arvilommi H, et al. HLA-B27-transfected (Salmonella permissive) and HLA-A2 transfected (Salmonella non-permissive) human monocytic U937 cells differ in their production of cytokines. Infect Immun. 2002;70:1609–1614. doi: 10.1128/IAI.70.3.1609-1614.2002. [DOI] [PMC free article] [PubMed] [Google Scholar]
- 37.Inman RD, Payne U. Determinants of synoviocyte clearance of arthritogenic bacteria. J Rheumatol. 2003;30(6):1291–7. [PubMed] [Google Scholar]
- 38.Rothfuchs AG, Gigliotti D, Palmblad K, Andersson U, Wigzell H, Rottenberg ME. IFN-alpha beta-dependent, IFN-gamma secretion by bone marrow-derived macrophages controls an intracellular bacterial infection. J Immunol. 2001;167(11):6453–61. doi: 10.4049/jimmunol.167.11.6453. [DOI] [PubMed] [Google Scholar]
- 39.Inman RD, Chiu B. Early cytokine profiles in the joint define pathogen clearance and severity of arthritis in Chlamydia-induced arthritis in rats. Arthritis Rheum. 2006;54(2):499–507. doi: 10.1002/art.21643. [DOI] [PubMed] [Google Scholar]
- 40.Chu CQ, Swart D, Alcorn D, Tocker J, Elkon KB. Interferon-gamma regulates susceptibility to collagen-induced arthritis through suppression of interleukin-17. Arthritis Rheum. 2007;56(4):1145–51. doi: 10.1002/art.22453. [DOI] [PubMed] [Google Scholar]
- 41.Colbert RA, Turner MJ, DeLay ML, Smith JA, Klenk EI, Sowders DP, et al. HLA-B27 Misfolding Activates the IL-23/IL-17 Axis via the Unfolded Protein Response in Transgenic Rats: Evidence for a Novel Mechanism of Inflammation. Arth Rheum. 2007;54:S515. [Google Scholar]
- 42.Singh R, Aggarwal A, Misra R. Th1/Th17 cytokine profiles in patients with reactive arthritis/undifferentiated spondyloarthropathy. J Rheumatol. 2007;34(11):2285–90. [PubMed] [Google Scholar]
- 43.Weaver CT, Harrington LE, Mangan PR, Gavrieli M, Murphy KM. Th17: an effector CD4 T cell lineage with regulatory T cell ties. Immunity. 2006;24(6):677–88. doi: 10.1016/j.immuni.2006.06.002. [DOI] [PubMed] [Google Scholar]
- 44.Colbert RA. The immunobiology of HLA-B27: variations on a theme. Curr Mol Med. 2004;4(1):21–30. doi: 10.2174/1566524043479293. [DOI] [PubMed] [Google Scholar]
- 45.Ron D, Walter P. Signal integration in the endoplasmic reticulum unfolded protein response. Nat Rev Mol Cell Biol. 2007;8(7):519–29. doi: 10.1038/nrm2199. [DOI] [PubMed] [Google Scholar]
- 46.Turner MJ, Sowders DP, DeLay ML, Mohapatra R, Bai S, Smith JA, et al. HLA-B27 misfolding in transgenic rats is associated with activation of the unfolded protein response. J Immunol. 2005;175(4):2438–48. doi: 10.4049/jimmunol.175.4.2438. [DOI] [PubMed] [Google Scholar]
- 47.Turner MJ, Delay ML, Bai S, Klenk E, Colbert RA. HLA-B27 up-regulation causes accumulation of misfolded heavy chains and correlates with the magnitude of the unfolded protein response in transgenic rats: Implications for the pathogenesis of spondylarthritis-like disease. Arthritis Rheum. 2007;56(1):215–23. doi: 10.1002/art.22295. [DOI] [PubMed] [Google Scholar]
- 48.Dangoria NS, DeLay ML, Kingsbury DJ, Mear JP, Uchanska-Ziegler B, Ziegler A, et al. HLA-B27 misfolding is associated with aberrant intermolecular disulfide bond formation (dimerization) in the endoplasmic reticulum. J Biol Chem. 2002;277:23459–23468. doi: 10.1074/jbc.M110336200. [DOI] [PubMed] [Google Scholar]
- 49.Tran TM, Satumtira N, Dorris ML, May E, Wang A, Furuta E, et al. HLA-B27 in transgenic rats forms disulfide-linked heavy chain oligomers and multimers that bind to the chaperone BiP. J Immunol. 2004;172(8):5110–9. doi: 10.4049/jimmunol.172.8.5110. [DOI] [PubMed] [Google Scholar]
- 50.Gu J, Rihl M, Marker-Hermann E, Baeten D, Kuipers JG, Song YW, et al. Clues to the pathogenesis of spondyloarthropathy derived from synovial fluid mononuclear cell gene expression profiles. J Rheumatol. 2002;29:2159–2164. [PubMed] [Google Scholar]