Abstract
Most of the phosphatidylethanolamine (PE) in mammalian cells is synthesized by two pathways, the CDP-ethanolamine pathway and the phosphatidylserine (PS) decarboxylation pathway, the final steps of which operate at spatially distinct sites, the endoplasmic reticulum and mitochondria, respectively. We investigated the importance of the mitochondrial pathway for PE synthesis in mice by generating mice lacking PS decarboxylase activity. Disruption of Pisd in mice resulted in lethality between days 8 and 10 of embryonic development. Electron microscopy of Pisd−/− embryos revealed large numbers of aberrantly shaped mitochondria. In addition, fluorescence confocal microscopy of Pisd−/− embryonic fibroblasts showed fragmented mitochondria. PS decarboxylase activity and mRNA levels in Pisd+/− tissues were approximately one-half of those in wild-type mice. However, heterozygous mice appeared normal, exhibited normal vitality, and the phospholipid composition of livers, testes, brains, and of mitochondria isolated from livers, was the same as in wild-type littermates. The amount and activity of a key enzyme of the CDP-ethanolamine pathway for PE synthesis, CTP:phosphoethanolamine cytidylyltransferase, were increased by 35–40 and 100%, respectively, in tissues of Pisd+/− mice, as judged by immunoblotting; PE synthesis from [3H]ethanolamine was correspondingly increased in hepatocytes. We conclude that the CDP-ethanolamine pathway in mice cannot substitute for a lack of PS decarboxylase during development. Moreover, elimination of PE production in mitochondria causes fragmented, misshapen mitochondria, an abnormality that likely contributes to the embryonic lethality.
Phosphatidylethanolamine (PE)4 is an abundant phospholipid in membranes of organisms ranging from bacteria to mammals. Mammalian cells utilize two major pathways for PE biosynthesis, the CDP-ethanolamine pathway (1) and the phosphatidylserine decarboxylation pathway (2). Most of the ethanolamine that is incorporated into PE is derived from the diet but some is generated by sphingosine-1-phosphate lyase (3). In rat liver/hepatocytes (4, 5) and hamster heart (6) the majority of PE has been reported to originate from the CDP-ethanolamine pathway. In contrast, in cultured Chinese hamster ovary cells (7–9) and baby hamster kidney cells (10), the decarboxylation of phosphatidylserine (PS) produces more than 80% of PE, even when the culture medium is supplemented with ethanolamine, an obligatory substrate of the CDP-ethanolamine pathway. Many types of mammalian cells grow and divide normally when cultured in the absence of ethanolamine, suggesting that PE production from the CDP-ethanolamine pathway might not be not essential for cell growth (10), although it is likely that the relative importance of the two pathways of PE synthesis depends on the type of cell and tissue. In Escherichia coli, in which PE comprises ~75% of total phospholipids, all PE is derived from PS decarboxylase. Interestingly, E. coli that have been genetically manipulated to reduce the PE content to 0.007% of total phospholipids are viable when supplemented with divalent cations such as Mg2+ and Ca2+ (11, 12).
The two major pathways for PE synthesis in mammalian cells operate in different subcellular compartments. The final reaction of the CDP-ethanolamine pathway, catalyzed by CDP-ethanolamine:1,2-diacylglycerol ethanolaminephosphotransferase, occurs primarily on endoplasmic reticulum (ER) and nuclear membranes (13, 14), whereas PS decarboxylase activity is restricted to the outer surface of mitochondrial inner membranes (15, 16). Thus, the potential exists for compartmentalization of PE pools originating from these two spatially segregated pathways. Indeed, in Chinese hamster ovary cells and in yeast, the majority of mitochondrial PE is synthesized within mitochondria by PS decarboxylase, whereas only small amounts of mitochondrial PE are derived from the CDP-ethanolamine pathway (i.e. imported from the ER, Refs. 17–20). On the other hand, PE synthesized in mitochondria is efficiently exported to other cellular membranes (e.g. ER, Ref. 21 and plasma membranes, Ref. 22).
PS decarboxylase is a member of a small family of decarboxylases that contain a pyruvoyl prosthetic group (23–25). In E. coli, the pyruvoyl moiety of PS decarboxylase is generated by an autocatalytic, endoproteolytic cleavage in which the serine residue within the LGST motif is converted into a pyruvoyl group that is located at the N terminus of the smaller of the two subunits (24). The LGST motif is conserved in mammalian PS decarboxylases, and a similar endoproteolytic cleavage appears to occur in mammalian cells (26).
We suspected that each pathway for PE synthesis might be essential for specific functions in mammalian cells. In view of the finding that nearly all PE in mitochondria is synthesized within mitochondria by PS decarboxylase, we hypothesized that inactivation of PS decarboxylase in mice would cause mitochondrial defects, and that such abnormalities might be incompatible with normal embryonic development. In this study, we generated mice lacking PS decarboxylase and found that the mice died at about embryonic day 9. Of note, embryonic fibroblasts lacking PS decarboxylase contained fragmented, aberrantly shaped mitochondria.
EXPERIMENTAL PROCEDURES
PS Decarboxylase-deficient Mice
A mouse embryonic stem cell line (German Gene Trap Consortium W078F02-06350) containing an insertional mutation in the Pisd gene was identified in a gene-trapping screen (27). The embryonic stem cells were used to generate male chimeric mice that were bred with heterozygous C57BL/6 mice to produce heterozygous (Pisd+/−) mice. Mice and embryos were genotyped by a PCR-based method with the primers 5′-GTG GTA GTA GCA GGA TTG GTA GC-3′ and 5′-GGG AGT GGA AGC AGT GGT AG-3′ for the wild-type allele, and 5′-ATT TGA CCT GAG CGC ATTTT-TACGC- 3′ and 5′-CATTAAAGCGAGTGGCAACATGGAA-3′ for the mutated allele. Genotypes were confirmed by quantifying neomycin phosphotransferase II gene dosage by Southern blotting of genomic DNA (28). All mice described here had a mixed genetic background (50% C57BL/6, 50% 129OlaHsd). The mice were weaned at 21 days of age and housed in a barrier facility with a 14-h light, 10-h dark cycle. Mice were fed a chow diet containing 4.5% fat (LabDiet, Richmond, IN).
Mouse Embryonic Fibroblasts
Mouse embryonic fibroblasts were isolated from Pisd−/−, Pisd+/− and Pisd+/+ embryos as follows. The embryos were incubated in cell-dissociation solution (Sigma), and the cells were mechanically dispersed by repeated pipetting. The cell suspension was plated in Dulbecco’s modified Eagle’s medium (Invitrogen, Life Technologies, Inc.) containing 20% fetal bovine serum, 50 mg/liter uridine, 110 mg/liter pyruvate, 2mM glutamine, 1× nonessential amino acid solution (Sigma), 20 µM β-mercaptoethanol and 5 mg/liter ethanolamine. All cell culture plates and cover slips were coated with 0.1% gelatin.
Histology
Female mice were euthanized and mouse embryos were isolated from the uterus. The embryos were fixed in 10% neutral-buffered formalin for 24 h, dehydrated, embedded in ultrapure hard paraffin (gold standard-Peel away microcut, Polysciences, Warington, PA) and sectioned (5-µm thick), then stained with Harris hematoxylin/eosin.
Examination of Tissues for β-Galactosidase Activity
Cryostat sections (10-µm thick) of frozen tissues from mice were collected on Superfrost Plus microscope slides (Fisher Scientific). The sections were dried, fixed (in 2% formaldehyde in phosphate-buffered saline (140 mM NaCl, 2.7 mM KCl. 8.1 mM Na2HPO4, 1.5 mM KH2PO4, pH 7.4) supplemented with 0.2% glutaraldehyde, pH 7.2) for 5 min at room temperature, then rinsed with phosphate-buffered saline. The sections were incubated with an X-gal (Invitrogen) staining solution for 2–6 h at 37 °C. The X-gal staining solution was prepared by mixing 1 ml of a stock solution of X-gal (40 mg/ml in dimethyl sulfoxide) with 40 ml of phosphate-buffered saline containing 5 mM potassium ferricyanide, 5 mM potassium ferrocyanide trihydrate, and 2mM MgCl2. After staining, the slides were rinsed with phosphate-buffered saline, washed twice for 2 min with deionized water, and counterstained for 1–2 min with Nuclear Fast Red. The slides were washed again with phosphate-buffered saline and deionized water and coverslips were secured with Gel-mount (Biomeda, Foster City, CA).
Fluorescence Microscopy
Murine embryonic fibroblasts were grown on cover slips coated with 0.1% gelatin. Mitochondria were stained with 200 nM MitoTracker Green FM (Molecular Probes, OR) for 15–20 min in cell culture medium. The cells were subsequently washed twice with dye-free culture medium, and mitochondria were visualized with a Zeiss LSM 510 confocal microscope. The cells were kept at 37 °C during imaging. Images were collected with software provided by Zeiss.
Electron Microscopy
Embryos (8- and 9-day-old) were isolated from pregnant females and fixed in phosphate-buffered saline containing 4% paraformaldehyde and 2% glutaraldehyde. Embryos were dehydrated and embedded in Araldite. Ultrathin sections were cut and stained with uranyl acetate and osmium tetroxide. Sections were examined in a Hitachi H7000 electron microscope operated at 75 kV.
Immunoblotting Analysis
Equal amounts of protein from tissue homogenates were incubated with rabbit polyclonal antibodies raised against a 17-amino acid peptide (CTKAHHSSQEMSSEYRE) from the human/murine/rat CTP:phosphoethanolamine cytidylyltransferases (a gift from Dr. M. Bakovic, University of Guelph) and immunoprecipitated with protein G-coupled beads (Sigma). The antibody was purified by immunoaffinity chromatography with immobilized antigen. The pellets were resuspended and washed three times with T-TBS (50mM Tris, 150mMNaCl, 0.1% Tween-20, pH 7.5). After the final wash, the samples were resuspended in loading buffer and subjected to electrophoresis on polyacrylamide gels containing 0.1% SDS. The gel was run under non-reducing conditions. Proteins were transferred to Immobilon-P membranes (Millipore, Billerica, MA), and the membranes were subsequently incubated with anti-cytidylyltransferase antibodies as the primary antibody, and donkey anti-rabbit-IgG linked to horseradish peroxidase (Amersham Biosciences) as the secondary antibody. Blots were developed with ECL developing solution (Amersham Biosciences) and exposed to Biomax MR film (Kodak, Rochester, NY). The band corresponding to CTP:phosphoethanolamine cytidylyltransferase (~50 kDa) was quantified by densitometric scanning of the gels.
Real-time PCR
Mouse tissue (50–100 mg) was homogenized with a Polytron in TRIzol Reagent (Invitrogen) for 3 × 10 s on ice, and total RNA was extracted according to the manufacturer’s instructions. RNA quality was confirmed on a 1.5% formaldehyde-agarose gel by measurement of the 28 S/18 S ribosomal RNA ratio. Total RNA (5 µg) was reverse-transcribed in a 20-µl volume containing oligo(dT)12–18 primer (Invitrogen), and Superscript II enzyme (Invitrogen) according to the manufacturer’s instructions. Primers used for the reference gene, cyclophilin, were 5′-TCC AAA GAC AGC AGA AAA CTT TCG-3′ and 5′-TCT TCT TGC TGG TCT TGC CAT TCC-3′. For PS decarboxylase, the 5′ and 3′-primers were 5′-CAA CCT CAG CGA GTT CTT CC-3′ and 5′-CCT GCT CCA CCT CAG AGT TC-3′, respectively. The 20-µl PCR reaction contained 100 ng of cDNA, 10 µl of Platinum Sybr Green qPCR Supermix UDG (Invitrogen), and 1.6 µM cyclophilin primers, or 3.0 µM PS decarboxylase primers. Real-time PCR was performed with a Rotor-Gene RG-3000 thermocycler (Corbett Research, Mortlake, NSW, Australia) with samples from three separate mice, and each sample was analyzed in triplicate. Data were normalized to the reference gene with the Pfaffl method (29).
In Vitro Assay of PS Decarboxylase and CTP:Phosphoethanolamine Cytidylyltransferase Activities
For measurement of PS decarboxylase activity, unlabeled PS and 1,2 dioleoyl-l-3-phosphatidyl-l-[3-14C]serine ([14C]PS) (Amersham Biosciences) were dried together under nitrogen gas. The lipids were resuspended in buffer containing 10 mM Tris, pH 7.0, 0.1 M KCl, and 100 µM MnCl2, followed by 10 freeze-thaw cycles to induce formation of multilamellar liposomes. For each 40-µl assay, a sample of tissue homogenate (400 µg of protein) was incubated with 0.2 mM PS (0.9 µCi) for 40 min at 37 °C. The reaction was stopped with chloroform/methanol, 2:1 (v/v), then lipids were extracted and dried under nitrogen gas. Phospholipids were separated on thin-layer chromatography plates (silica gel G-60, EMD Chemicals, Gibbstown, PA) in chloroform/methanol/acetic acid/formic acid/water, 70:30:12:4:2 (v/v) then visualized by exposure to iodine vapor. PE was scraped from the silica plate, and radioactivity was determined. Under these assay conditions, the incorporation of radiolabel into PE was linear with respect to time of incubation and amount of protein. Enzymatic activity was calculated as dpm in PE/h/mg homogenate protein.
The activity of CTP:phosphoethanolamine cytidylyltransferase was measured according to a previously published procedure (30). Briefly, a mixture containing 20 µM Tris/HCl, 10 µM MgCl2, 5 µM dithiothreitol, 2 µM CTP, and 0.1 µmol of [3H]phosphoethanolamine (10 µCi/µmol) was added to 250 µg of protein of liver homogenate in a final volume of 100µl. The mixture was incubated for 20 min at 37 °C. The reaction was stopped by immersion of the tube in boiling water, and the tube was centrifuged for 5min at 5,000 × g. An aliquot (30µl) of supernatant was applied to a thin-layer chromatography plate with 0.3 µmol of CDP-ethanolamine and 1 µmol of phosphoethanolamine as carriers. The ethanolamine-containing compounds were separated by thin-layer chromatography in methanol:0.5% NaCl:NH4OH (v/v) and visualized by spraying the plate with a 0.2% aqueous solution of ninhydrin followed by heating the plate at 100 °C for 5min. CDP-ethanolamine was scraped from the plate, and radioactivity was measured. Enzymatic activity was calculated as nmol of CDP-ethanolamine produced/min/mg protein.
Phospholipid Composition of Tissues and Mitochondria
Lipids were extracted from tissue homogenates, and mitochondria isolated from livers (31), according to the method of Bligh and Dyer (32). The lower phase from the lipid extraction was dried under a stream of nitrogen gas, and lipids were separated by thin-layer chromatography on silica gel G60 plates (EMD Chemicals, Gibbstown, PA) in chloroform/methanol/acetic acid/formic acid/water, 70:30:12:4:2, (v/v). Phospholipids were visualized by exposure to iodine vapor. The phospholipids were scraped, and the amount of phospholipid was determined by measurement of inorganic phosphorus (33).
Radiolabeling of PE in Hepatocytes with [3H]Ethanolamine
Hepatocytes were isolated from the livers of Pisd+/+ and Pisd+/− mice and incubated in Dulbecco’s modified Eagle’s medium for 16 h. The cells were washed twice with the same medium after which medium containing 1.5µCi/ml [1-3H]ethan-1-ol-2-amine (Amersham Biosciences) was added. The cells were incubated for 0, 30, 60, or 90 min, and then the lipids were extracted from cellular lysates, and PE was isolated by thin-layer chromatography as described earlier. PE was scraped from the plate and radioactivity was measured.
Other Methods
Protein concentrations were determined with the BCA protein assay kit (Pierce).
RESULTS
Tissue Pattern of Pisd Expression and Generation of Pisd−/− Mice
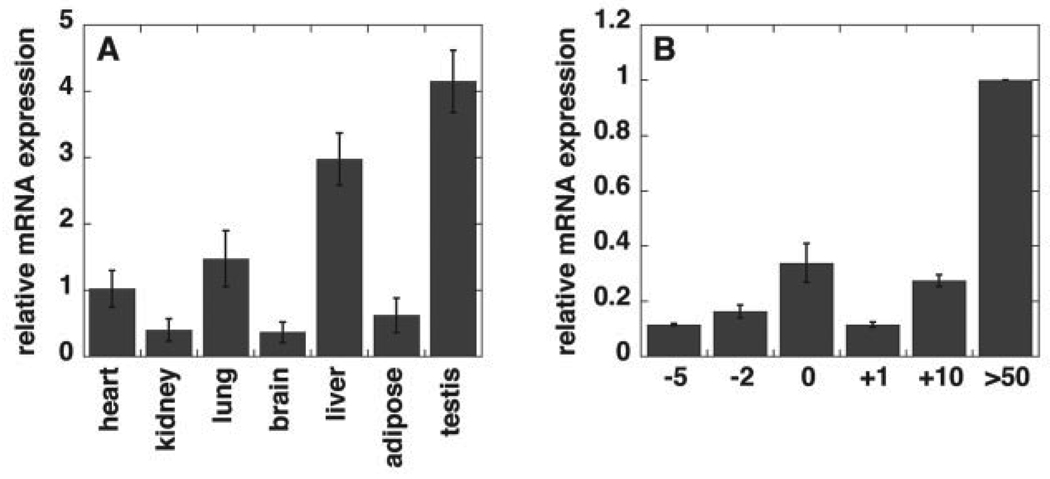
We investigated the expression pattern for Pisd in several mouse tissues. Pisd is expressed in a wide range of tissues in adult mice (Fig. 1A). Pisd mRNA levels are particularly high in testis and liver. The expression of Pisd is relatively low in livers of embryos collected 5 days before birth, and also in newborn mice, but is ~10-fold higher in adult (> 50-day-old) mice (Fig. 1B).
FIGURE 1. Real-time PCR analysis of Pisd mRNA levels relative to cyclophilin mRNA in mouse tissues.
A, tissues from adult mice; B, in livers during development from 5 days (−5) before birth (day 0) to adult (> 50 days old). Data are averages ± S.D. from at least three mice or embryos. Some error bars are too small to be visible.
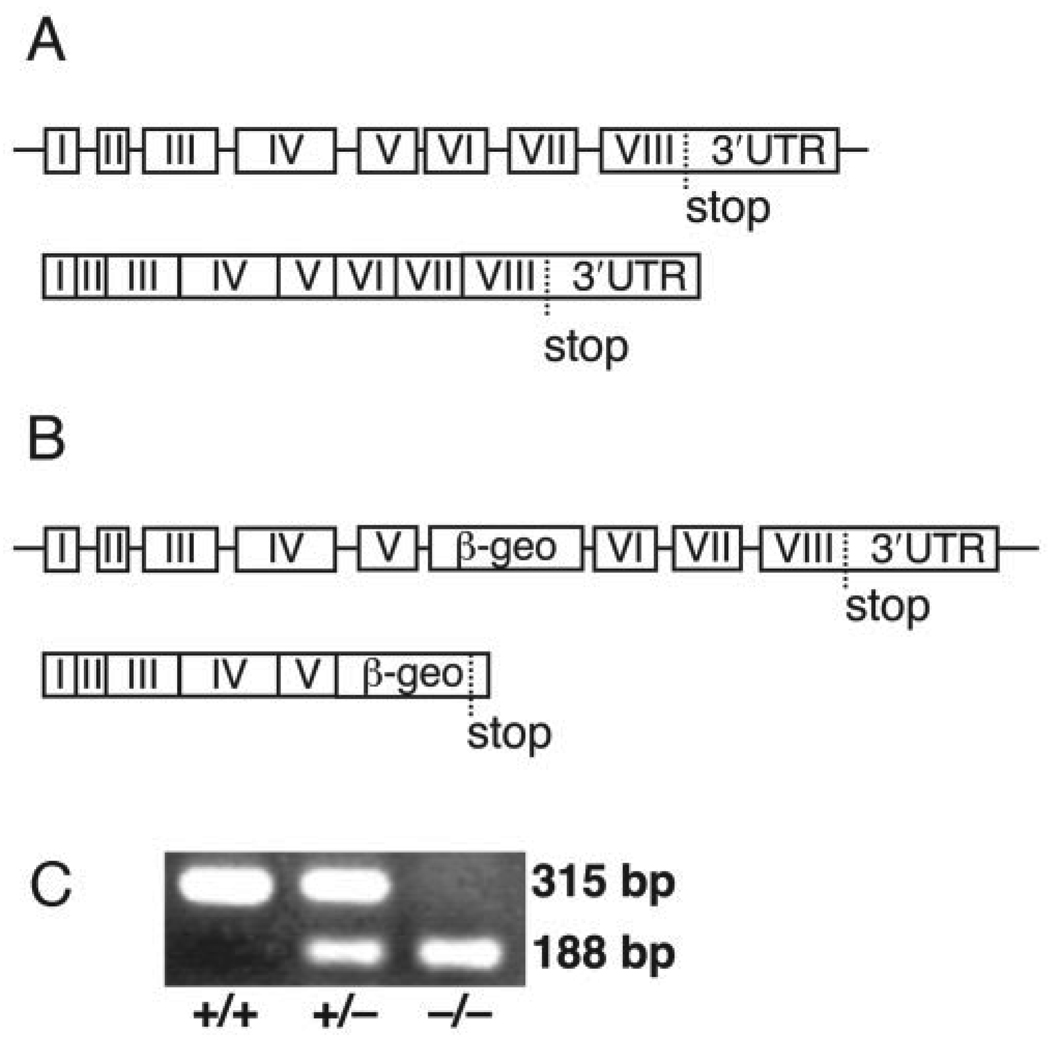
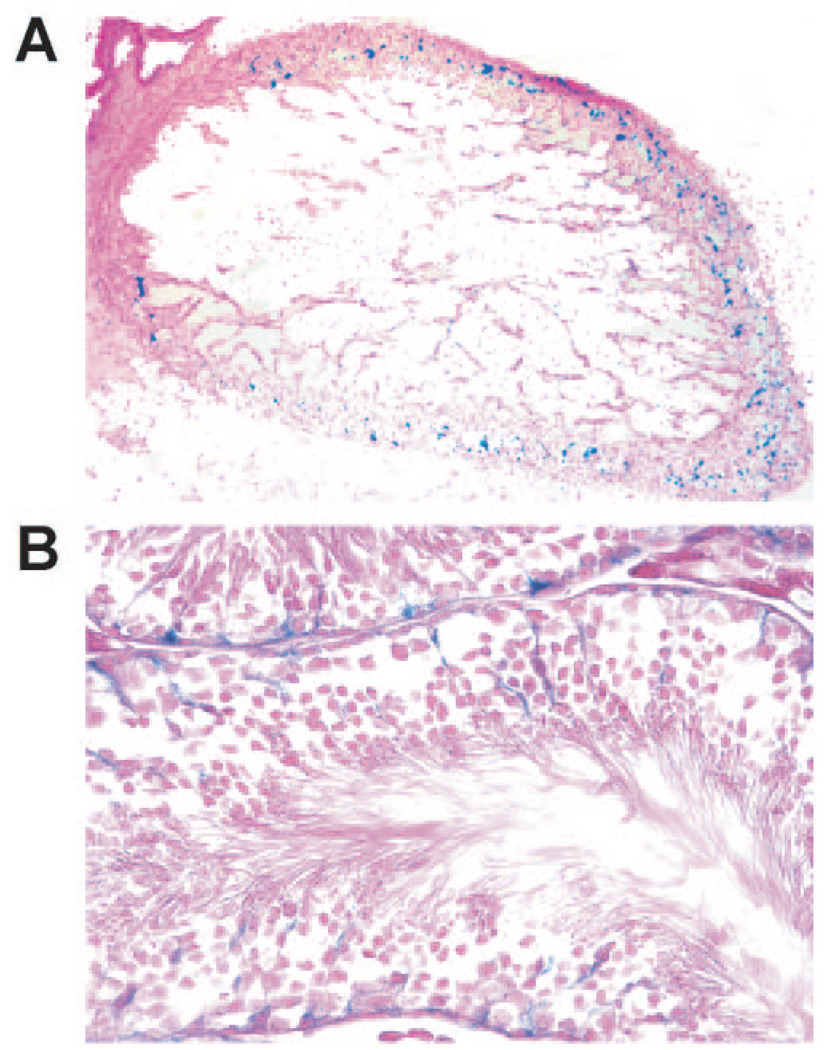
To determine whether or not Pisd is essential for mouse viability, we generated Pisd-deficient mice with an ES cell line bearing a gene-trap insertional mutation in intron 5 of Pisd (27). The mutation results in a fusion transcript consisting of the first five exons of Pisd followed by βgeo sequences from the gene-trap vector (Figs. 2, A and B). The first exons of the Pisd gene encode the mitochondrial targeting sequence, whereas the 3′-end of the gene contains sequences encoding the catalytic site of the enzyme (reviewed in Ref. 25). The fusion transcript is expressed under control of the Pisd promoter; thus, the gene-trap technique permits analysis of the cell type-specific expression of Pisd by staining tissue sections for β-galactosidase. Because the majority of mitochondrial PE is derived from PS decarboxylation, we hypothesized that Pisd would be highly expressed during development in tissues rich in mitochondria, such as the heart. As predicted, β-galactosidase staining of the heart of a 13-day-old Pisd+/− embryo (Fig. 3A) shows that Pisd is indeed expressed highly in embryonic heart. We also observed Pisd expression in other tissues of adult mice, including Sertoli cells of the testis, as shown in Fig. 3B.
FIGURE 2. Generation of Pisd mutant mice by gene trapping.
A, endogenous Pisd gene and transcript. B, gene-trapped Pisd allele. C, PCR analysis of the three Pisd genotypes.
FIGURE 3. Analysis of Pisd expression in tissues from Pisd+/− mice as judged by β-galactosidase staining.
A, β-galactosidase staining of a Pisd+/− embryo (E13) showing expression of Pisd in the heart. Original magnification, 40×. B, β-galactosidase staining of testis from a 7-week-old Pisd+/− mouse, showing expression of Pisd in Sertoli cells. Original magnification, 40×.
Disruption of the Pisd Gene Is Lethal between Days 8 and 10 of Embryonic Development
The genotype of offspring from heterozygous matings was determined by PCR (Fig. 2C) and was confirmed by Southern blotting. No Pisd−/− mice were born (TABLEONE), nor did we find any Pisd-deficient embryos at stages later than 10 days of development. Until the embryos were 8 days old, however, there was a Mendelian distribution of the three genotypes. A few Pisd−/− embryos, 13 and 4% of total embryos, were found at E9 and E10, respectively. After E8, partially resorbed embryos, likely Pisd−/− embryos, were commonly observed. We conclude, therefore, that disruption of Pisd in mice results in failure of the embryos to develop beyond embryonic days 8–10. In contrast, mice and embryos that are heterozygous for the Pisd mutation are indistinguishable from their wild-type littermates; the heterozygous mice are born at the predicted Mendelian frequency, develop normally, have a normal lifespan, exhibit normal vitality, and are fertile.
TABLE ONE.
Genotype of offspring produced from intercrosses of Pisd+/− mice
| Age | Genotype | Resorbed | ||
|---|---|---|---|---|
| +/+ | +/− | −/− | ||
| Adults | 68 (32%) | 142 (68%) | 0 | |
| Embryos day 12–14 | 7 (25%) | 12 (43%) | 0 | 9 (32%) |
| Embryos day 10 | 21 (28%) | 43 (57%) | 3 (4%) | 8 (10%) |
| Embryos day 9 | 15 (15%) | 48 (50%) | 12 (13%) | 21 (21%) |
| Embryos day 8 | 22 (27%) | 36 (45%) | 20 (25%) | 2 (3%) |
Histological Analysis of Pisd-deficient Embryos
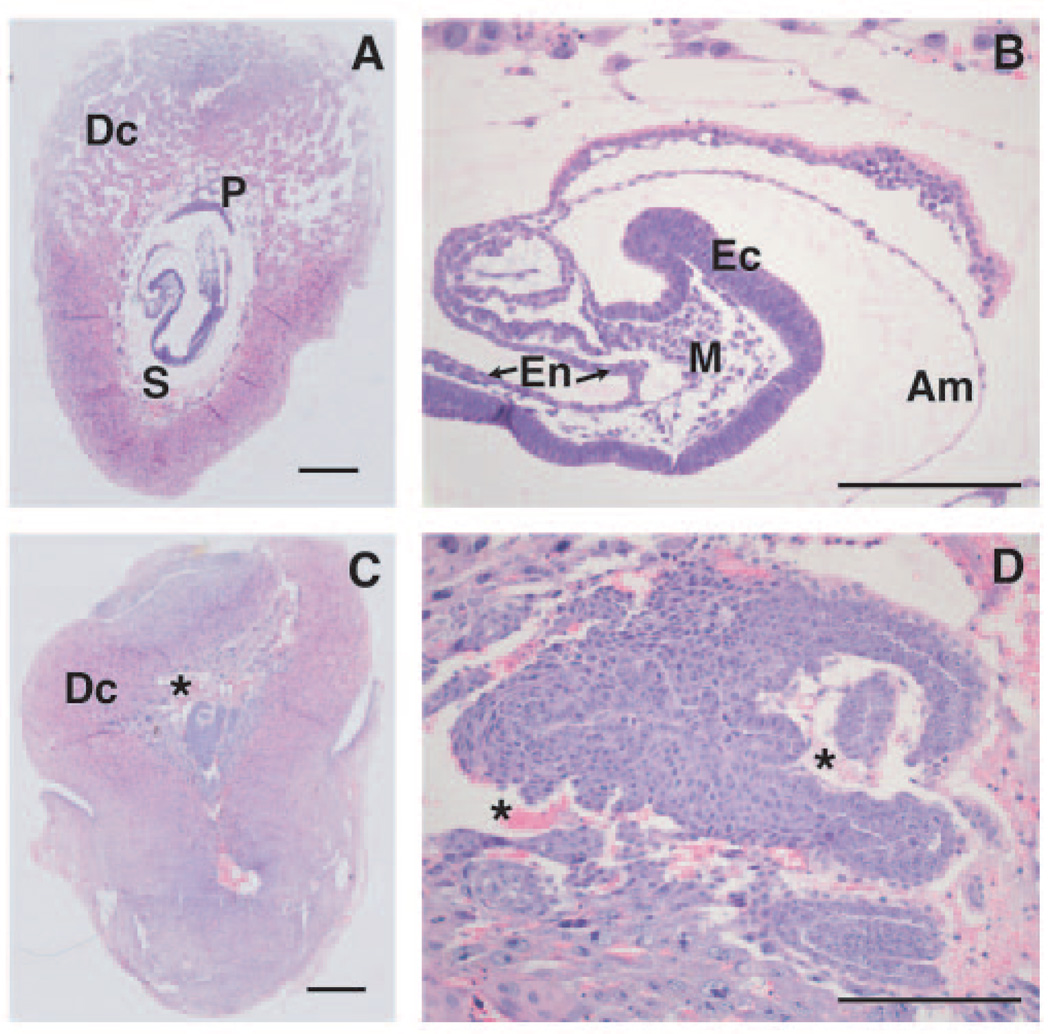
Examination of histological sections revealed severe developmental abnormalities in Pisd-deficient embryos, whereas development of heterozygous and wild-type embryos was normal. As shown in Fig. 4A, there was a clear distinction between the embryonic and extra-embryonic components in 8-day-old Pisd+/+ embryos. The initial stage in the formation of the placenta had occurred and the decidua was well developed with a typical open structure. In addition, the endoderm, mesoderm, and ectoderm could be clearly identified and at least four somites were visible at this stage of development (Fig. 4B). In contrast, in 8-day-old Pisd-deficient embryos, differentiation into the three germ layers was not detectable (Fig. 4D). Moreover, no extra-embryonic components, such as the placenta or amnion, were visible. Maternal blood, not normally in direct contact with the embryo because of the presence of extra-embryonic membranes, was visible directly surrounding the Pisd−/− embryo (asterisks in Fig. 4, C and D). Mitotic spindles were present (not shown); thus, some cell division was occurring in Pisd−/− embryos of this age. The decidua was formed although it appeared more compact and irregular than in Pisd+/+ embryos. The length of the 8-day-old fetus with its surrounding decidua was ~3 mm for both Pisd+/+ and Pisd−/− embryos. At day E9, however, the wild-type and heterozygous implants measured ~5 mm in length whereas the Pisd−/− embryos were only ~3-mm long (not shown). At this stage, necrosis of tissue was obvious in Pisd−/− embryos.
FIGURE 4. Histological analysis of 8-day-old Pisd+/+ and Pisd−/− embryos.
Sagittal sections were made from embryos with surrounding deciduas. Tissues were fixed, embedded in paraffin, and serial sections were stained with hematoxylin/eosin. Size bars in A and C represent 500 nm, whereas for B and D size bars represent 200 nm. A and B, Pisd+/+ embryo. C and D, Pisd−/− embryo. A and C show overview of embryos with surrounding deciduas (Dc), placenta (P), and somites (S). B, detailed view of wild-type embryo that has developed the ectoderm (Ec), mesoderm (M), endoderm (En), and the amnion (Am). The extra-embryonic component is clearly defined. D, in Pisd-deficient embryos, no differentiation of the three germ layers was observed. The extra-embryonic component is absent, and blood cells (indicated by asterisks) directly surround the embryo.
Disruption of Pisd Results in Aberrant Mitochondrial Morphology
Cultures of mouse embryonic fibroblasts were obtained from 8-, 9-, and 10-day-old wild-type embryos. These cells grew well when standard isolation and culture procedures for mouse embryonic fibroblasts were used (28). Our attempts to isolate fibroblasts from 8-, 9-, and 10-day-old Pisd-deficient embryos resulted in fewer cells, although some viable fibroblasts were isolated. Neither alternative culture methods nor supplementation of the culture medium with various concentrations (1–50 mg/liter) of ethanolamine (a substrate for the CDP-ethanolamine pathway for PE synthesis) improved the yield or viability of the cells. We also attempted to culture Pisd−/− fibroblasts in a modified growth medium that had previously been used to support growth of cells with mitochondrial defects (34), but cell viability was only marginally improved.
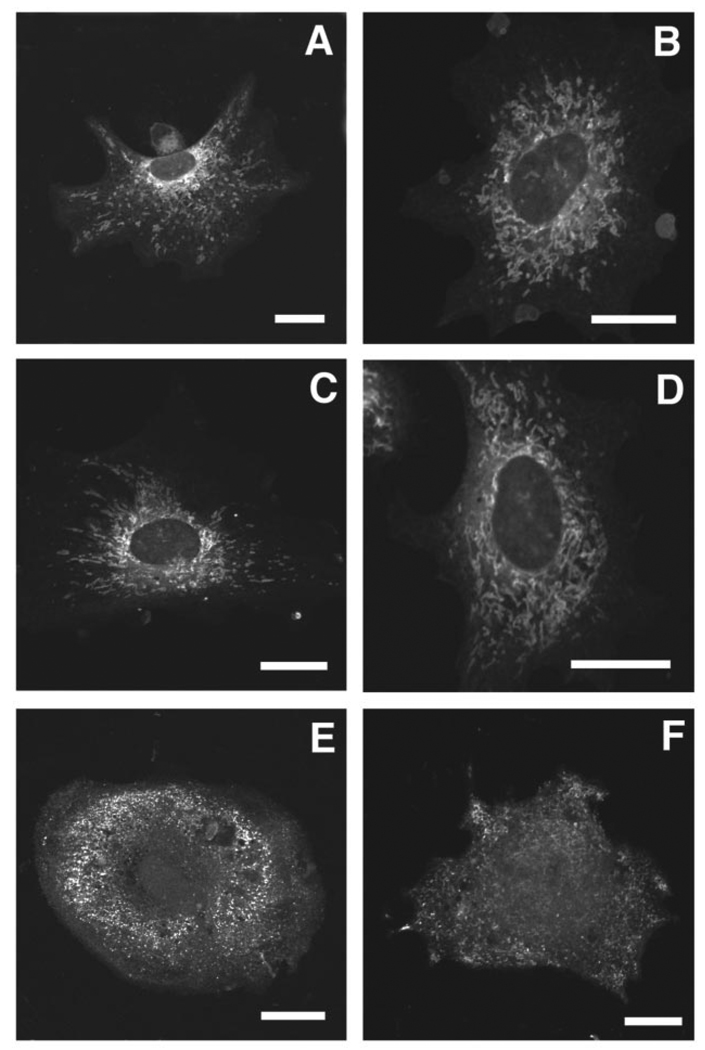
Mitochondria in fibroblasts isolated from 8- to 9-day-old embryos of the three genotypes were visualized with MitoTracker Green, a membrane potential-independent fluorescent dye specific for mitochondria. MitoTracker Green staining of wild-type fibroblasts revealed the typical tubular-reticular network of mitochondria, with a concentration of mitochondria around the nucleus and fewer mitochondria at the cell periphery (Fig. 5, A and B). In contrast, Pisd−/− fibroblasts contained fragmented, rounded mitochondria of irregular diameter (Fig. 5, E and F). Moreover, these mitochondria were widely dispersed throughout the cell rather than being concentrated around the nucleus. Mitochondria in Pisd+/− fibroblasts were indistinguishable from those in Pisd+/+ fibroblasts (Fig. 5, C and D).
FIGURE 5. Fluorescence confocal microscopy of embryonic fibroblasts isolated from Pisd−/−, Pisd+/−, and Pisd+/+ mouse embryos.
Fibroblasts were isolated from 8- to 9-day-old embryos. Mitochondria were imaged by confocal microscopy with MitoTracker Green FM. A and B, fibroblasts from wild-type embryos revealing typical tubular-reticular mitochondria concentrated around the nucleus. C and D, fibroblasts from Pisd+/− embryos. E and F, fibroblasts from Pisd−/− embryos in which mitochondria are rounded, fragmented, and dispersed throughout the cell. Size bar, 20 nm.
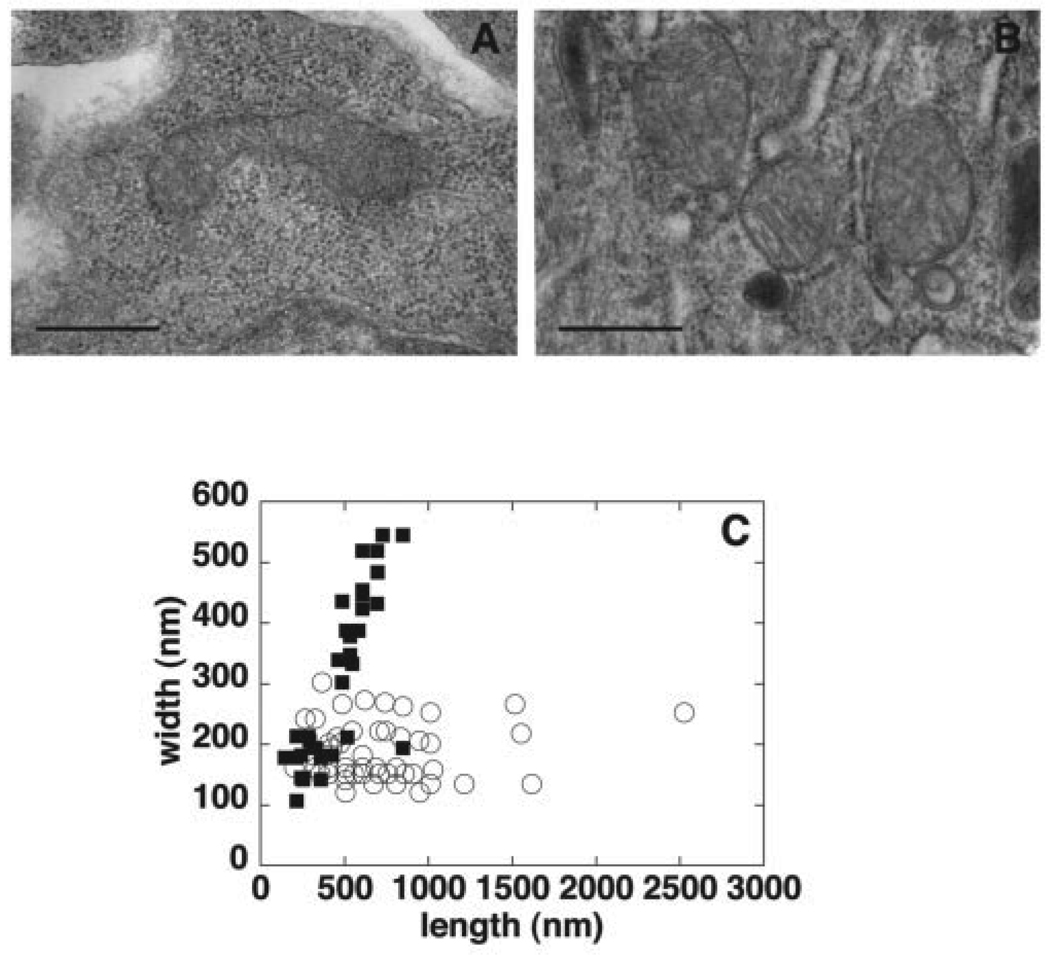
We also isolated 8-day-old embryos from pregnant mothers and immediately processed them for electron microscopy. A clear difference in mitochondrial morphology was observed between Pisd+/+ and Pisd−/− embryos. Whereas mitochondria in wild-type embryos were elongated and tubular in shape (Fig. 6A), mitochondria in Pisd-deficient embryos were round or oval (Fig. 6B). We measured the dimensions of mitochondria from several electron micrographs (Fig. 6C) and found that the mitochondria in wild-type embryos varied in length from 300 to 2,500 nm, and in width from 150 to 300 nm. In contrast, Pisd-deficient mitochondria were not only markedly less elongated but were also wider (up to 550 nm) than wild-type mitochondria. No other defects were obvious in mitochondria of the Pisd−/− embryos: the mitochondrial inner and outer membranes were present, and the cristae were clearly visible.
FIGURE 6. Electron microscopy of mitochondria in Pisd+/+ and Pisd−/− embryos.
Embryos (E8) were prepared for electron microscopy. Ultrathin sections were cut and stained with uranyl acetate and osmium tetroxide. A, representative elongated and tubular mitochondrion from a Pisd+/+ embryo. B, typical mitochondria from a Pisd−/− embryo; mitochondria are rounded and vesicular but cristae are visible. Size bar, 500 nm. C, length and width of mitochondria in Pisd+/+(open circles) and Pisd−/−(closed squares) embryonic tissue were measured from electron micrographs. Each symbol represents a single mitochondrion.
Phospholipid Composition of Pisd+/− Mouse Tissues Is Normal
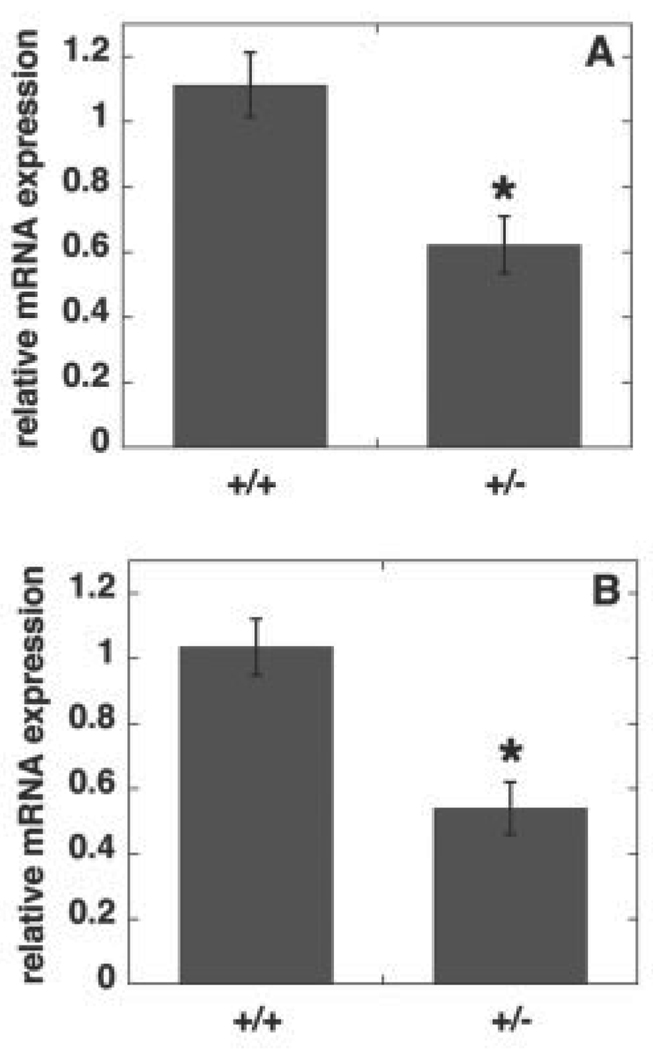
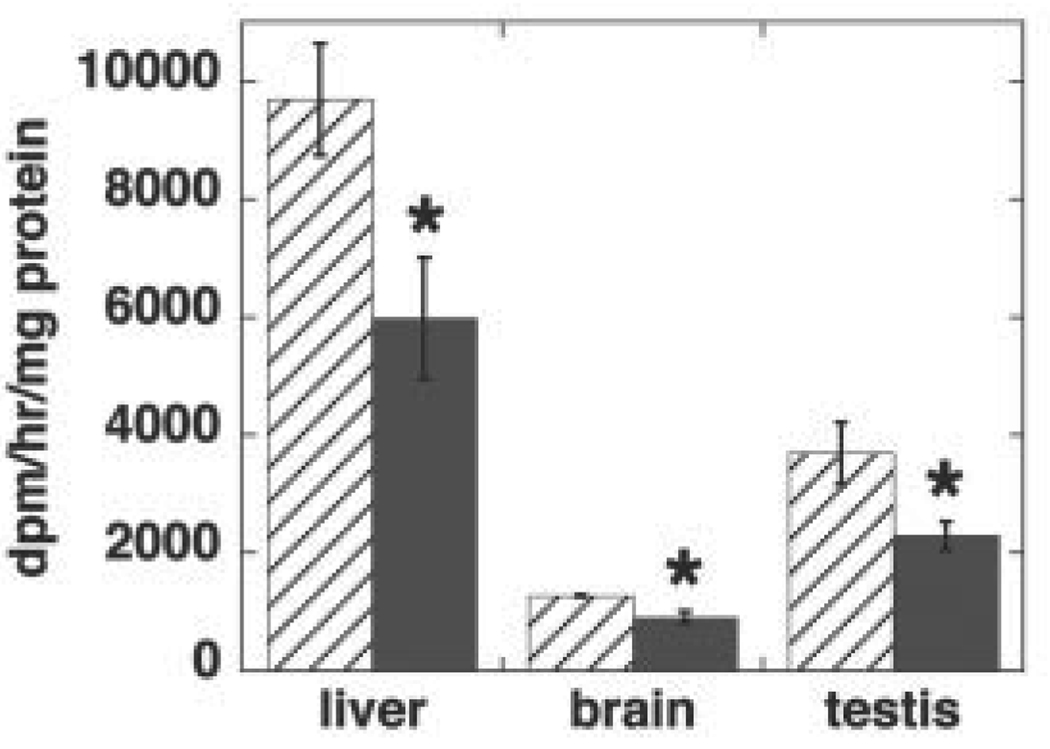
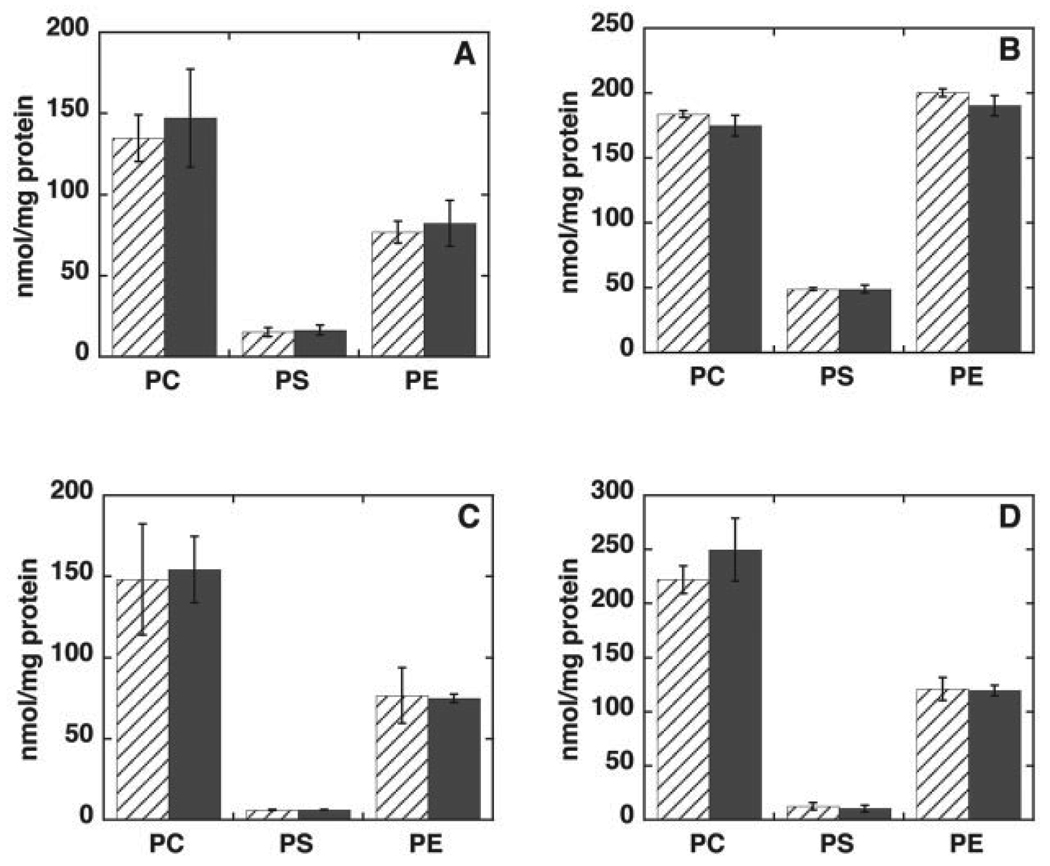
The amount of embryonic tissue and embryonic fibroblasts available from 8- to 10-day-old Pisd−/− embryos was too small for biochemical analysis. Consequently, we were unable to determine the phospholipid composition of Pisd−/− tissues or mitochondria. We therefore compared the phospholipid composition of wild-type and heterozygous mice. The amount of Pisd mRNA in livers of adult Pisd+/− mice (Fig. 7A) and in 10-day-old Pisd+/− embryos (Fig. 7B) was 40–50% less than in wild-type livers and embryos. Correspondingly, the enzymatic activity of PS decarboxylase in homogenates of livers, brains, and testes of adult heterozygous mice was 40–50% lower than in wild-type tissues (Fig. 8).We hypothesized that since the majority of mitochondrial PE is normally derived in situ from PS imported into mitochondria (17–19), the 50% reduction in PS decarboxylase activity might be translated into a reduced PE content, and perhaps also an increased PS content, in Pisd+/−, compared with Pisd+/+, mitochondria. However, in homogenates of the three tissues we examined (liver, brain, and testis), the content of phosphatidylcholine, PS, and PE was the same in wild-type and heterozygous mice (Fig. 9, A–C). In addition, the phospholipid content of mitochondria isolated from the livers was not different between the two genotypes (Fig. 9D). As noted above, heterozygous mice are indistinguishable from their wild-type littermates in terms of viability, fertility, and appearance. We conclude, therefore, that half-normal levels of PS decarboxylase activity are sufficient for growth and viability of mice, whereas elimination of all PS decarboxylase activity is lethal during development.
FIGURE 7. Pisd mRNA levels in livers from Pisd+/+ and Pisd+/− adult mice (A) and 10-day-old embryos (B).
Pisd mRNA levels relative to cyclophilin mRNA were determined by real-time PCR. Data are means ± S.D. from at least three mice or embryos of each genotype. *, p < 0.005.
FIGURE 8. PS decarboxylase activity in tissues of Pisd+/+ and Pisd+/− mice.
Homogenates were prepared from livers, brains and testes of adult Pisd+/+ (hatched bars) and Pisd+/− (solid bars) mice. PS decarboxylase activity was measured in vitro. Data are means ± S.D. from at least three mice of each genotype. For liver and brain: *, p < 0.001; for testis: *, p = 0.012.
FIGURE 9. Phospholipid composition of tissues of adult Pisd+/+ and Pisd+/− mice.
The phospholipid composition was determined in homogenates of testes (A), brains (B), livers (C), and in mitochondria isolated from livers (D) of Pisd+/+ (hatched bars) and Pisd+/− (solid bars) mice. All data are means ± S.D. from analyses of at least four mice of each genotype.
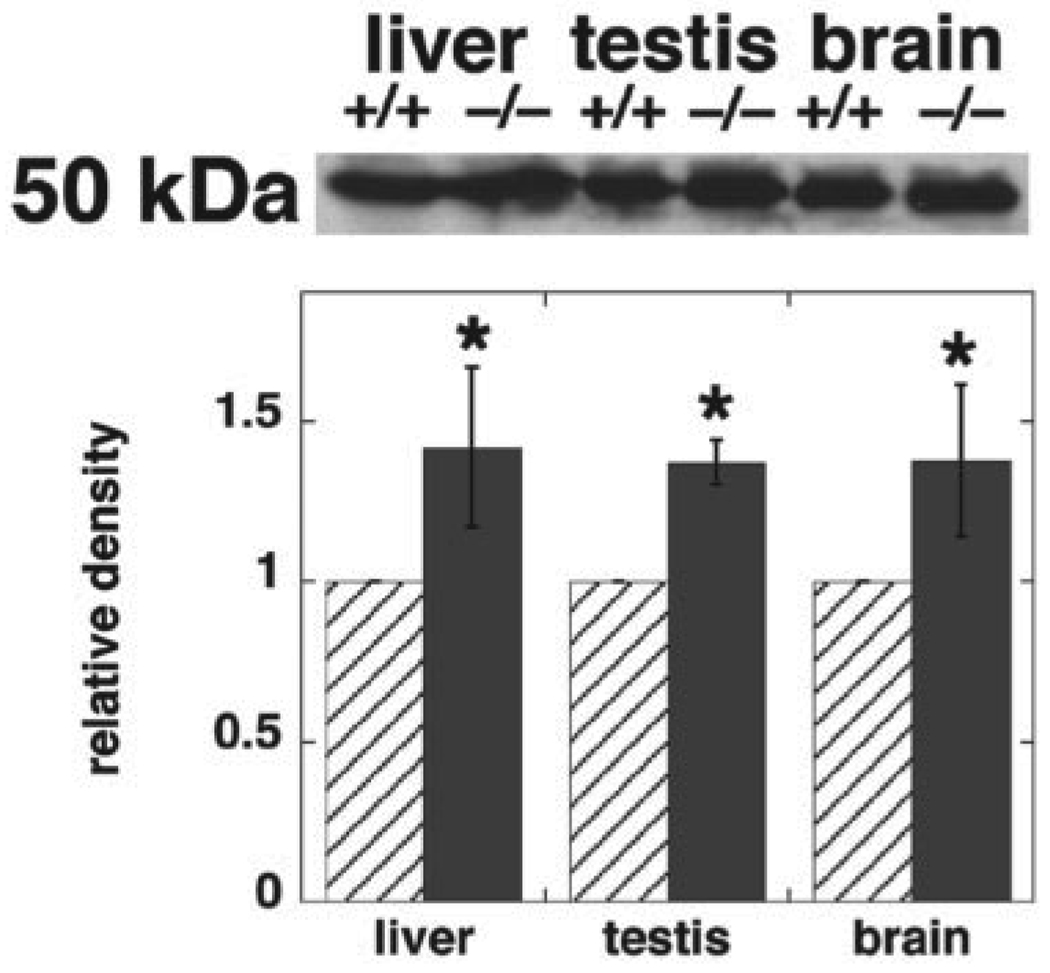
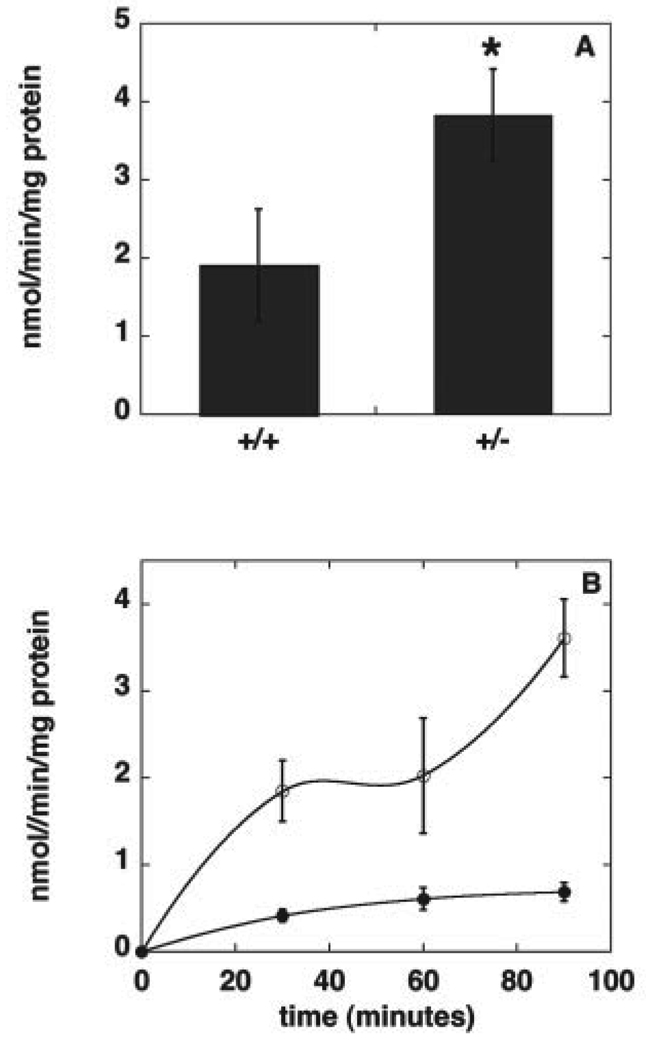
Mammalian cells possess a second major pathway for PE synthesis, the CDP-ethanolamine pathway, through which PE is made from diacylglycerol and ethanolamine (1). We examined by immunoblotting the amount of CTP:phosphoethanolamine cytidylyltransferase, the enzyme that is thought to be rate-limiting for this pathway (35, 36). The amount of this protein was increased by 35–40% in homogenates of liver and testis from Pisd+/− mice, compared with homogenates from Pisd+/+ mice (Fig. 10). In addition, the enzymatic activity of the cytidylyltransferase was 100% higher in liver homogenates from Pisd+/− mice than from Pisd+/+ mice (Fig. 11A). As an indication of whether or not flux through the CDP-ethanolamine pathway was increased upon elimination of PS decarboxylase activity, hepatocytes from Pisd+/+ and Pisd+/− mice were incubated with [3H]ethanolamine, and the amount of radio-activity in PE was determined. The incorporation of [3H]ethanolamine into PE was markedly higher in Pisd+/− hepatocytes than in Pisd+/+ hepatocytes (Fig. 11B). These data suggest that the capacity for PE synthesis via the CDP-ethanolamine pathway is greater in Pisd+/− livers than in Pisd+/+ livers. Thus, it is likely that PE synthesis from the CDP-ethanolamine pathway is increased in mice with reduced amounts of Pisd.
FIGURE 10. CTP:phosphoethanolamine cytidylyltransferase protein is increased in Pisd+/− mice.
Homogenates were prepared from livers, brains and testes of Pisd+/+ and Pisd+/− mice. Upper panel, representative immunoblot of the cytidylyltransferase (molecular mass ~50 kDa). Lower panel, quantitation of densitometric scanning of immunoblots of tissues from three mice of each genotype. Data for band intensity of the immunoblot from Pisd+/− mice are given relative to that from Pisd+/+ mice. For liver: *, p < 0.05; for testis: *, p < 0.001; for brain: *, p = 0.051.
FIGURE 11. Reciprocal regulation of PE synthesis via the CDP-ethanolamine pathway.
A, CTP:phosphoethanolamine cytidylyltransferase activity in homogenates of livers from Pisd+/+ and Pisd+/− mice. Data are means ± S.D. of four mice of each genotype. *, p < 0.04. B, incorporation of [3H]ethanolamine into PE in hepatocytes from Pisd+/+(filled symbols) and Pisd+/− (open symbols) mice. Data are means ± S.D. of three independent experiments, each performed in triplicate.
DISCUSSION
The presence of more than one biosynthetic pathway for a single type of lipid, and the existence of distinct genes encoding the same or similar enzymatic activities in these pathways, are widespread (37). The duality of biosynthetic routes/enzymes holds the potential for producing spatially segregated pools of lipids with distinct biological functions. In the current study, we disrupted the Pisd gene in mice to determine whether the production of PE via the PS decarboxylation pathway in mitochondria is essential for normal development and viability of mice, or whether the CDP-ethanolamine pathway for PE synthesis, which operates in the ER, suffices. Our experiments show that Pisd knockout results in midgestational embryonic lethality. Therefore, the CDP-ethanolamine pathway cannot substitute for the lack of Pisd. Moreover, Pisd−/− embryos and embryonic fibroblasts contain mitochondria that are rounded and extensively dispersed within the cell.
PE is required not only as a structural component of membranes but also for membrane fusion events (38, 39), regulation of contractile ring disassembly at the cleavage furrow during cytokinesis (40), regulation of lipid metabolism in Drosophila via processing of the transcription factor, sterol response element-binding protein (41), and for proper folding of integral membrane proteins in E. coli (42, 43). The relative quantitative contributions of the two major pathways for PE biosynthesis in mammalian cells have been debated for years. Data showing that the bulk of mitochondrial PE in yeast (18, 20, 44) and mammalian cells (17) is derived from PS decarboxylation, rather than from the CDP-ethanolamine pathway, suggest that PS decarboxylation provides an important source of PE in mitochondria and is, therefore, functionally important.
In this report, we show that Pisd is widely expressed in mouse tissues as judged by β-galactosidase staining, mRNA distribution, and enzymatic activity, and is particularly abundant in testis and liver. The expression of Pisd mRNA is relatively low prior to, and immediately after, birth but is ~10-fold higher in adult animals. Despite the relatively low Pisd mRNA abundance during development, we demonstrate that Pisd is essential for mouse development.
Mammalian cells appear to have only a single gene (Pisd) encoding PS decarboxylase, unlike Saccharomyces cerevisiae, which has two (PSD1 and PSD2). In yeast, Psd1p contributes ~95% of total PS decarboxylase activity. This protein is located in mitochondria, whereas Psd2p is located within the Golgi/vacuole (45, 46). Similarly, Arabidopsis has both mitochondrial and non-mitochondrial PS decarboxylases (47). Voelker and co-workers (46, 48) generated yeast mutants with null alleles in either or both PS decarboxylase genes. Elimination of the mitochondrial Psd1p in yeast does not result in any defect in growth, in contrast to the lethality in Pisd knock-out mice. Nor is elimination of both PS decarboxylases lethal in yeast since these cells are ethanolamine auxotrophs. When the double mutants were grown in the presence of ethanolamine, they contained only ~30% of the normal amount of PE (46). Nevertheless, there appears to be a critical minimum threshold for the amount of PS-derived PE that is required to support growth. Yeast that lacked Psd1p, and were cultured in the absence of ethanolamine under conditions for which the PE content was manipulated to be <4% of total phospholipids, exhibited reduced growth and viability (44).
The requirement of PS decarboxylation in mammalian cells has not been previously studied. However, Umeda and co-workers (9) isolated a Chinese hamster ovary cell mutant, R-41, that possessed normal PS decarboxylase activity but was unable to import PS into mitochondria. Consequently, these cells were defective in the generation of PE from PS. The PE content of R-41 cells was only 50% of that of wild-type cells, but the PS content was normal and the cells were viable. Moreover, the CDP-ethanolamine pathway for PE synthesis functioned normally in R-41 cells (9).
Pisd−/− Embryos and Embryonic Fibroblasts Display Mitochondrial Abnormalities
Our data show that a lack of Pisd in mice lead to developmental defects. At the subcellular level, electron microscopy revealed that mitochondria in Pisd−/− embryos are misshapen. Fragmentation and dispersion of mitochondria throughout the cell were also observed by fluorescence confocal microscopy of Pisd−/− embryonic fibroblasts stained with MitoTracker Green. Mitochondria of fibroblasts from heterozygous embryos appeared normal, making it highly unlikely that the PS-decarboxylase-β-galactosidase fusion protein generated by the insertional mutation is responsible for the mitochondrial abnormalities.
Mitochondria are highly dynamic organelles that exhibit a range of morphologies, from small spheres, to long tubules, to interconnected tubular networks (49–51). Mitochondrial morphology depends on a balance between fusion and fission events (reviewed in Refs. 50 and 52). The mitochondrial morphology observed in Pisd−/− embryos is consistent with a defect in mitochondrial fusion. Several proteins have been implicated in mitochondrial fusion. For example, the mammalian mitofusins Mfn1 and Mfn2, and their Drosophila and yeast counterparts, FZO1, are required for mitochondrial fusion. Elimination of either Mfn1 or Mfn2 in mice leads to embryonic lethality at E10 and E12, respectively (53). A double knockout of Mfn1 and Mfn2 leads to more severe developmental problems and even earlier embryonic lethality. In addition, mitofusin-deficient embryos have different degrees of developmental delay in different tissues (50).
A likely explanation for the presence of aberrant mitochondria in cells lacking Pisd is that these mitochondria have a reduced content of PE. PE is a fusogenic phospholipid (38, 39, 54, 55). Thus, an absence, or an insufficiency, of PE might be expected to cause mitochondrial fusion defects. A known example in which the phospholipid composition of mitochondria is important for mitochondrial function is in a human disease associated with cardiomyopathy, Barth syndrome. This disorder is caused by mutations in the gene encoding tafazzin, a putative phospholipid acyltransferase. In cells with a defect in tafazzin, the amount of cardiolipin, amitochondrial phospholipid, is reduced, and its acyl-chain composition is altered. In addition, the mitochondria are enlarged with concentric stacks of cristae (56), and mitochondrial function is severely compromised (57–60).
Pisd+/− Heterozygous Mice
Although no Pisd−/− mice were born alive, Pisd+/− mice were produced at the predicted Mendelian frequency. Pisd+/− mice appear outwardly normal, and males and females are fertile. The level of mRNA and the enzymatic activity of PS decarboxylase in tissues of heterozygous mice were 40–50% lower than in Pisd+/+ mice. Nevertheless, the amounts of PS and PE of tissues, and of mitochondria from the livers, of the heterozygous mice were normal. We conclude, therefore, that ~50% of normal PS decarboxylase activity is sufficient to maintain phospholipid homeostasis and to support viability. The lower threshold of PS decarboxylase activity required for maintenance of normal PE levels and for viability of mice remains unknown. From these data, it appears that Pisd activity is normally in excess of its requirement for PE synthesis. In addition, PE levels in Pisd+/− mice might be maintained by compensatory mechanisms, such as inhibition of PE degradation or increased flux through the CDP-ethanolamine pathway. The increased amount and activity of CTP:phosphoethanolamine cytidylyltransferase in Pisd+/−, compared with Pisd+/+, tissues and cells suggests that a mechanism has been induced as compensation for the reduction in PS decarboxylase activity by enhancing the CDP-ethanolamine pathway for PE synthesis. This cytidylyltransferase has been reported to regulate flux through the CDP-ethanolamine pathway (61). In addition, the increased labeling of PE from [3H]ethanolamine in Pisd+/− hepatocytes indicates that PE synthesis via the CDP-ethanolamine pathway is increased compared with that in Pisd+/+ hepatocytes. A reciprocal regulation of the two major pathways for PE synthesis was previously observed in hepatoma cells that overexpressed PS synthase-1. In these cells, PE synthesis via PS decarboxylation was increased whereas PE synthesis via the CDP-ethanolamine pathway was diminished (62).
The most obvious explanation for the embryonic lethality caused by disruption of the Pisd gene is that elimination of mitochondrial PE production, and the consequent reduction in mitochondrial PE content, are responsible for the mitochondrial abnormalities. We speculate that abnormalities in mitochondrial structure lead to impaired mitochondrial function, which in turn causes embryonic lethality. Because mitochondria play crucial roles in the normal development and function of all organs, including the heart, liver and brain, a global defect in mitochondria is likely to be incompatible with life.
Our data do not, however, exclude an alternative explanation for the mitochondrial abnormalities and the embryonic lethality in Pisd−/− mice. It is possible that the substrate for the decarboxylase, namely PS, accumulates abnormally in either mitochondrial membranes or in mitochondria-associated membranes that are thought to provide a conduit for PS import into mitochondria (17, 31). Thus, membrane structure and function might be altered. When [14C]PS was added to mouse liver mitochondria in the presence of hydroxylamine, a nonspecific inhibitor of PS decarboxylase (63), [14C]PS accumulated at contact sites between outer and inner mitochondrial membranes. However, changes in the mass of PS in contact sites was not reported. In addition, when yeast lacking PS decarboxylase were incubated for short periods with [3H]serine, [3H]PS accumulated (46). However, the PS content was not increased when the cells were labeled to steady state with [32P]orthophosphate to reflect more closely the phospholipid mass, (46). Nor was the PS content increased in R-41 cells in which the PS decarboxylation pathway was impaired (9). Thus, it is likely that elimination of PS decarboxylation in mice does not increase the PS content of membranes. Unfortunately, because of the small amounts of embryonic cells available, we were unable to measure the PS content of mitochondria in Pisd-deficient embryos.
An interesting question arising from our studies is whether or not the alternative pathway for PE synthesis, the CDP-ethanolamine pathway, is also essential in mice. The creation of mice lacking key enzymes of this pathway should shed light on this question.
Acknowledgments
We thank Dr. Nick Nation (University of Alberta Laboratory Animal Services) for assistance with histological examinations of embryos, Dr. Xue-Jun Sun (Cross Cancer Institute, University of Alberta) for assistance with confocal microscopy, Dr. Ming Chen (Surgical Medical Research Institute, University of Alberta) for advice on electron microscopy, and Randy Nelson (University of Alberta) for help with real-time PCR. We also thank Dennis E. Vance for insightful comments.
Footnotes
This research was supported by grants from the Canadian Institutes for Health Research (CIHR) and the Heart and Stroke Foundation of Canada (HSFC) (to J. E. V.). The project was supported by an NHLBI, National Institutes of Health-funded program in genomics applications “BayGenomics” (HL66621, HL66600). The costs of publication of this article were defrayed in part by the payment of page charges. This article must therefore be hereby marked “advertisement” in accordance with 18 U.S.C. Section 1734 solely to indicate this fact.
The abbreviations used are: PE, phosphatidylethanolamine; ER, endoplasmic reticulum; PS, phosphatidylserine; Pisd, mouse PS decarboxylase gene; X-gal, 5-bromo-4-chloro-3-indolyl-β-D-galactopyranoside.
The nucleotide sequence of the Mouse PS Carboxylase Gene (Pisd) reported in this paper has been submitted to the Mouse Genome Informatics Data Base (www.informatics.jax.org) with accession number ID: MGI 2445114.
REFERENCES
- 1.Kennedy EP, Weiss SB. J. Biol. Chem. 1956;222:193–214. [PubMed] [Google Scholar]
- 2.Borkenhagen LF, Kennedy EP, Fielding L. J. Biol. Chem. 1961;236:28–32. [Google Scholar]
- 3.Hannun YA, Luberto C, Argraves KM. Biochemistry. 2001;40:4893–4903. doi: 10.1021/bi002836k. [DOI] [PubMed] [Google Scholar]
- 4.Sundler R, Akesson B. Biochem. J. 1975;146:309–315. doi: 10.1042/bj1460309. [DOI] [PMC free article] [PubMed] [Google Scholar]
- 5.Tijburg LBM, Geelen MJH, van Golde LMG. Biochem. Biophys. Res. Commun. 1989;160:1275–1280. doi: 10.1016/s0006-291x(89)80141-x. [DOI] [PubMed] [Google Scholar]
- 6.Zelinski TA, Choy PC. Can. J. Biochem. 1982;60:817–823. doi: 10.1139/o82-102. [DOI] [PubMed] [Google Scholar]
- 7.Miller MA, Kent C. J. Biol. Chem. 1986;261:9753–9761. [PubMed] [Google Scholar]
- 8.Kuge O, Nishijima M, Akamatsu Y. J. Biol. Chem. 1986;261:5790–5794. [PubMed] [Google Scholar]
- 9.Emoto K, Kuge O, Nishijima M, Umeda M. Proc. Natl. Acad. Sci. U. S. A. 1999;96:12400–12405. doi: 10.1073/pnas.96.22.12400. [DOI] [PMC free article] [PubMed] [Google Scholar]
- 10.Voelker DR. Proc. Natl. Acad. Sci. U. S. A. 1984;81:2669–2673. doi: 10.1073/pnas.81.9.2669. [DOI] [PMC free article] [PubMed] [Google Scholar]
- 11.DeChavigny A, Heacock PN, Dowhan W. J. Biol. Chem. 1991;266:5323–5332. [PubMed] [Google Scholar]
- 12.Rietveld AG, Killian JA, Dowhan W, de Kruijff B. J. Biol. Chem. 1993;268:12427–12433. [PubMed] [Google Scholar]
- 13.Vance JE, Vance DE. J. Biol. Chem. 1988;263:5898–5908. [PubMed] [Google Scholar]
- 14.Henneberry AL, Wright MM, McMaster CR. Mol. Biol. Cell. 2002;13:3148–3161. doi: 10.1091/mbc.01-11-0540. [DOI] [PMC free article] [PubMed] [Google Scholar]
- 15.Percy AK, Moore JF, Carson MA, Waechter CJ. Arch. Biochem. Biophys. 1983;223:484–494. doi: 10.1016/0003-9861(83)90613-6. [DOI] [PubMed] [Google Scholar]
- 16.Zborowski J, Dygas A, Wojtczak L. FEBS Lett. 1983;157:179–182. doi: 10.1016/0014-5793(83)81141-7. [DOI] [PubMed] [Google Scholar]
- 17.Shiao Y-J, Lupo G, Vance JE. J. Biol. Chem. 1995;270:11190–11198. doi: 10.1074/jbc.270.19.11190. [DOI] [PubMed] [Google Scholar]
- 18.Birner R, Burgermeister M, Schneiter R, Daum G. Mol. Biol. Cell. 2001;12:997–1007. doi: 10.1091/mbc.12.4.997. [DOI] [PMC free article] [PubMed] [Google Scholar]
- 19.Storey MK, Wu W, Voelker DR. Biochim. Biophys. Acta. 2001;1532:234–247. doi: 10.1016/s1388-1981(01)00129-9. [DOI] [PubMed] [Google Scholar]
- 20.Burgermeister M, Birner-Grunberger R, Nebauer R, Daum G. Biochim. Biophys. Acta. 2004;1686:161–168. doi: 10.1016/j.bbalip.2004.09.007. [DOI] [PubMed] [Google Scholar]
- 21.Voelker DR. J. Biol. Chem. 1985;260:14671–14676. [PubMed] [Google Scholar]
- 22.Vance JE, Aasman EJ, Szarka R. J. Biol. Chem. 1991;266:8241–8247. [PubMed] [Google Scholar]
- 23.Snell EE. Trends in Biochem. Sci. 1977;2:131–135. [Google Scholar]
- 24.Li Q-X, Dowhan W. J. Biol. Chem. 1988;263:11516–11522. [PubMed] [Google Scholar]
- 25.Voelker DR. Biochim. Biophys. Acta. 1997;1348:236–244. doi: 10.1016/s0005-2760(97)00101-x. [DOI] [PubMed] [Google Scholar]
- 26.Kuge O, Nishijima M, Akamatsu Y. J. Biol. Chem. 1991;266:6370–6376. [PubMed] [Google Scholar]
- 27.Mitchell KJ, Pinson KI, Kelly OG, Brennan J, Zupicich J, Scherz P, Leighton PA, Goodrich LV, Lu X, Avery BJ, Tate P, Dill K, Pangilinan E, Wakenight P, Tessier-Lavigne M, Skarnes WC. Nat. Genet. 2001;28:241–249. doi: 10.1038/90074. [DOI] [PubMed] [Google Scholar]
- 28.Bergo MO, Gavino BJ, Steenbergen R, Sturbois B, Parlow AF, Sanan DA, Skarnes WC, Vance JE, Young SG. J. Biol. Chem. 2002;277:47701–47708. doi: 10.1074/jbc.M207734200. [DOI] [PubMed] [Google Scholar]
- 29.Pfaffl MW. Nucleic Acids Res. 2001;29:e45. doi: 10.1093/nar/29.9.e45. [DOI] [PMC free article] [PubMed] [Google Scholar]
- 30.Tijburg LBM, Vermeulen PS, van Golde LMB. Methods Enzymol. 1992;209:258–266. doi: 10.1016/0076-6879(92)09032-x. [DOI] [PubMed] [Google Scholar]
- 31.Vance JE. J. Biol. Chem. 1990;265:7248–7256. [PubMed] [Google Scholar]
- 32.Bligh EG, Dyer WJ. Can. J. Biochem. Physiol. 1959;37:911–917. doi: 10.1139/o59-099. [DOI] [PubMed] [Google Scholar]
- 33.Rouser G, Siakotos AN, Fleischer S. Lipids. 1966;1:85–86. doi: 10.1007/BF02668129. [DOI] [PubMed] [Google Scholar]
- 34.King MP, Attardi G. Methods Enzymol. 1996;264:304–313. doi: 10.1016/s0076-6879(96)64029-4. [DOI] [PubMed] [Google Scholar]
- 35.Sundler R. J. Biol. Chem. 1975;250:8585–8590. [PubMed] [Google Scholar]
- 36.Tijburg L, B M, Houweling M, Geelen MJH, van Golde LMG. Biochim. Biophys. Acta. 1987;922:184–190. doi: 10.1016/0005-2760(87)90153-6. [DOI] [PubMed] [Google Scholar]
- 37.Vance JE. Trends in Biochem. Sci. 1998;23:423–428. doi: 10.1016/s0968-0004(98)01297-3. [DOI] [PubMed] [Google Scholar]
- 38.Cullis PR, de Kruijff B, Hope M, Verkleij AJ, Nayar R, Farren SB, Tildock C, Madden TD, Bally MB. In: Membrane Fluidity in Biology. Aloia RC, editor. Vol. 1. New York: Academic Press; 1983. pp. 39–81. [Google Scholar]
- 39.Verkleij AJ, Leunissen-Bijvelt J, de Kruijff B, Hope M, Cullis PR. Ciba Found. Symp. 1984;103:45–59. doi: 10.1002/9780470720844.ch4. [DOI] [PubMed] [Google Scholar]
- 40.Emoto K, Kobayashi T, Yamaji A, Aizawa H, Yahara I, Inoue K, Umeda M. Proc. Natl. Acad. Sci. U. S. A. 1996;93:12867–12872. doi: 10.1073/pnas.93.23.12867. [DOI] [PMC free article] [PubMed] [Google Scholar]
- 41.Dobrosotskaya IY, Seegmiller AC, Brown MS, Goldstein JL, Rawson RB. Science. 2002;296:879–883. doi: 10.1126/science.1071124. [DOI] [PubMed] [Google Scholar]
- 42.Bogdanov M, Sun J, Kaback HR, Dowhan W. J. Biol. Chem. 1996;271:11615–11618. doi: 10.1074/jbc.271.20.11615. [DOI] [PubMed] [Google Scholar]
- 43.Bogdanov M, Dowhan W. EMBO J. 1998;17:5255–5264. doi: 10.1093/emboj/17.18.5255. [DOI] [PMC free article] [PubMed] [Google Scholar]
- 44.Storey MK, Clay KL, Kutateladze T, Murphy RC, Overduin M, Voelker DR. J. Biol. Chem. 2001;276:48539–48548. doi: 10.1074/jbc.M109043200. [DOI] [PubMed] [Google Scholar]
- 45.Trotter PJ, Pedretti J, Yates R, Voelker DR. J. Biol. Chem. 1995;270:6071–6080. doi: 10.1074/jbc.270.11.6071. [DOI] [PubMed] [Google Scholar]
- 46.Trotter PJ, Voelker DR. J. Biol. Chem. 1995;270:6062–6070. doi: 10.1074/jbc.270.11.6062. [DOI] [PubMed] [Google Scholar]
- 47.Rontein D, Wu WI, Voelker DR, Hanson AD. Plant Physiol. 2003;132:1678–1687. doi: 10.1104/pp.103.023242. [DOI] [PMC free article] [PubMed] [Google Scholar]
- 48.Trotter PJ, Pedretti J, Voelker DR. J. Biol. Chem. 1993;268:21416–21424. [PubMed] [Google Scholar]
- 49.Bereiter-Hahn J, Voth M. Microsc. Res. Tech. 1994;27:198–219. doi: 10.1002/jemt.1070270303. [DOI] [PubMed] [Google Scholar]
- 50.Chen H, Chan DC. Curr. Top. Dev. Biol. 2004;59:119–144. doi: 10.1016/S0070-2153(04)59005-1. [DOI] [PubMed] [Google Scholar]
- 51.Rizzuto R, Pinton P, Carrington W, Fay FS, Fogarty KE, Lifshitz LM, Tuft RA, Pozzan T. Science. 1998;280:1763–1765. doi: 10.1126/science.280.5370.1763. [DOI] [PubMed] [Google Scholar]
- 52.Shaw JM, Nunnari J. Trends Cell Biol. 2002;12:178–184. doi: 10.1016/s0962-8924(01)02246-2. [DOI] [PMC free article] [PubMed] [Google Scholar]
- 53.Chen H, Detmer SA, Ewald AJ, Griffin EE, Fraser SE, Chan DC. J. Cell Biol. 2003;160:189–200. doi: 10.1083/jcb.200211046. [DOI] [PMC free article] [PubMed] [Google Scholar]
- 54.Kachar B, Fuller N, Rand RP. Biophys. J. 1986;50:779–788. doi: 10.1016/S0006-3495(86)83518-4. [DOI] [PMC free article] [PubMed] [Google Scholar]
- 55.Cherezov V, Siegel DP, Shaw W, Burgess SW, Caffrey M. J. Membr. Biol. 2003;195:165–182. doi: 10.1007/s00232-003-0617-z. [DOI] [PubMed] [Google Scholar]
- 56.Chow CW, Thorburn DR. Hum. Reprod. 2000;15 Suppl. 2:68–78. doi: 10.1093/humrep/15.suppl_2.68. [DOI] [PubMed] [Google Scholar]
- 57.Koshkin V, Greenberg ML. Biochem. J. 2000;347:687–691. [PMC free article] [PubMed] [Google Scholar]
- 58.Schlame M, Towbin JA, Heerdt PM, Jehle R, DiMauro S, Blanck TJ. Ann. Neurol. 2002;51:634–637. doi: 10.1002/ana.10176. [DOI] [PubMed] [Google Scholar]
- 59.Ma L, Vaz FM, Gu Z, Wanders RJ, Greenberg ML. J. Biol. Chem. 2004;279:44394–44399. doi: 10.1074/jbc.M405479200. [DOI] [PubMed] [Google Scholar]
- 60.Xu Y, Sutachan JJ, Plesken H, Kelley RI, Schlame M. Lab. Investig. 2005;85:823–830. doi: 10.1038/labinvest.3700274. [DOI] [PubMed] [Google Scholar]
- 61.Sundler R, Akesson B. J. Biol. Chem. 1975;250:3359–3367. [PubMed] [Google Scholar]
- 62.Stone SJ, Vance JE. Biochem. J. 1999;342:57–64. [PMC free article] [PubMed] [Google Scholar]
- 63.Ardail D, Lerme F, Louisot P. J. Biol. Chem. 1991;266:7978–7981. [PubMed] [Google Scholar]


