Abstract
Human methionine adenosyltransferase 2β (MAT2β) encodes for two major splicing variants, V1 and V2, which are differentially expressed in normal tissues. Both variants are induced in human liver cancer and positively regulate growth. The aim of this work was to identify interacting proteins of V1 and V2. His-tagged V1 and V2 were overexpressed in Rosetta pLysS cells, purified, and used in a pulldown assay to identify interacting proteins from human colon cancer cell line RKO cell lysates. The eluted lysates were subjected to Western blot and in solution proteomic analyses. HuR, an mRNA-binding protein known to stabilize the mRNA of several cyclins, was identified to interact with V1 and V2. Immunoprecipitation and Western blotting confirmed their interaction in both liver and colon cancer cells. These variant proteins are located in both nucleus and cytoplasm in liver and colon cancer cells and, when overexpressed, increased the cytoplasmic HuR content. This led to increased expression of cyclin D1 and cyclin A, known targets of HuR. When endogenous expression of V1 or V2 is reduced by small interference RNA, cytoplasmic HuR content fell and the expression of these HuR target genes also decreased. Knockdown of cyclin D1 or cyclin A blunted, whereas knockdown of HuR largely prevented, the ability of V1 or V2 overexpression to induce growth. In conclusion, MAT2β variants reside mostly in the nucleus and regulate HuR subcellular content to affect cell proliferation.
Keywords: Cyclins, Protein Purification, Protein-Protein Interactions, Proteomics, siRNA, HuR, Liver Cancer Cells, Methionine Adenosyltransferase 2&β, RKO, Cell Growth
Introduction
Methionine adenosyltransferase (MAT)2 is essential to life, because it is the only enzyme that catalyzes the formation of S-adenosylmethionine, the principal biological methyl donor (1). In mammals, two different genes, MAT1A and MAT2A, encode for two homologous MAT catalytic subunits, α1 and α2. MAT1A is expressed mostly in the liver while MAT2A is widely distributed. In adult liver, increased expression of MAT2A is associated with rapid growth or de-differentiation. Up until recently, the MAT2β gene was thought to encode for the regulatory subunit (β) that is associated only with MAT2A-encoded enzyme (MATII) to lower its Km and Ki for methionine and S-adenosylmethionine, respectively. MAT2β expression is induced in cirrhosis and hepatocellular carcinoma (HCC). Importantly, increased MAT2A and MAT2β expression offer liver cancer cells a growth advantage (2, 3).
In a recent publication (4), we described novel functions of MAT2β that greatly increased its importance in biology. To study transcriptional regulation of MAT2β, we cloned and characterized its 5′-flanking region and uncovered multiple alternate splicing variants and termed the two major variants V1 and V2. V1 encodes a 334-amino acid protein beginning MVGREKELSIHFVPGSCRLVE…. The alternatively spliced V2 utilizes a different first exon lying further upstream in the genomic sequence to encode a hypothetical 323-amino acid isoform beginning MPEMPEDMEQ… (4). The reading frame for both variants converge after this point and are identical. We examined their expression pattern in human tissues and HCC and the effect of tumor necrosis factor α on their expression. MAT2β is expressed in most but not all tissues, and the two variants are differentially expressed. The mRNA levels of both variants are markedly increased in HCC. Tumor necrosis factor α, which induces MAT2A in HepG2 cells, also induced V1 (but not V2) expression. Both variants enhance growth of liver cancer cell lines. Reduced expression of V1 (but not V2) sensitized HepG2 cells to tumor necrosis factor α-induced apoptosis. Reduced expression of V1 also led to apoptosis in RKO cells, a human colon cancer cell line. The aim of the current work was to identify proteins that interact with V1 and V2 to better understand how these variant proteins regulate growth. Here we report novel findings that both variants are highly expressed in the nucleus and interact with HuR, an mRNA-binding protein known to stabilize the mRNA of cyclins (5), to affect its subcellular content and ultimately the expression of its target genes.
EXPERIMENTAL PROCEDURES
Cell Culture and Materials
Human liver cancer cell lines HepG2 and HuH-7, and human colon cancer cell line RKO cells, were obtained from the Cell Culture Core of the University of Southern California (USC) Research Center for Liver Diseases and grown according to instructions provided by the American Type Culture Collection (Rockville, MD). All reagents were of analytical grade and obtained from commercial sources.
HCC and Adjacent Non-cancerous Tissues
HCC and adjacent non-cancerous tissues were obtained from the USC Liver Repository. The study protocol conformed to the ethical guidelines of the 1975 Declaration of Helsinki as reflected in a priori approval by the Keck School of Medicine USC human research review committee.
Expression and Purification of MAT2β V1/V2 Proteins
Forward primers (V1, 5′-GCGGAATTCGTGGGGCGGGAGAAAGAG-3′; V2, 5′-TCTGAATTCCCTGAAATGCCAGAGGAC-3′) and reverse primer (5′-AGACTCGAGCTAATGAAAGACCGTTTG-3′) were used to PCR amplify MAT2β V1 or V2 full-length cDNA. To express recombinant human MAT2β V1 or V2, the full-length cDNA was cloned into the pET-28a (+) expression vector as a His-tagged fusion protein via Ndel and Xhol sites. The accuracy of the constructs was confirmed by DNA sequencing. MAT2β V1 or V2 protein was expressed in Rosetta pLysS cells (Novagen, San Diego, CA) with isopropyl 1-thio-β-d-galactopyranoside induction of either 4 h at 37 °C or 16 h at 16 °C. The proteins were separated from cellular debris through sonication and centrifugation. The resultant proteins were purified by nickel-nitrilotriacetic acid beads (Qiagen, Valencia, CA). After elution with excess imidazole, MAT2β V1 expressed at 37 °C and MAT2β V2 expressed at 16 °C were further purified by a Superdex 75 size-exclusion column (Amersham Biosciences). The protein samples were concentrated and then bound to nickel-nitrilotriacetic acid-agarose beads. 5-μl beads per sample were boiled in 2×SDS gel loading buffer and run on a SDS-PAGE gel. Proteins were visualized with Coomassie Blue staining.
Pulldown Assay with MAT2β V1/V2 Proteins
MAT2β V1 expressed at 37 °C and MAT2β V2 expressed at 16 °C were used for the pulldown assay. His-tagged Myc 1–93 was used as an irrelevant His-tagged protein control. RKO cells were lysed in binding buffer (50 mm Tris, pH 7.0, 150 mm NaCl, 2 mm MgCl2, 2 mm CaCl2, 20 mm imidazole, 0.5% Triton X-100, and protease inhibitor). 20 mg of protein in RKO cell lysate was incubated with 100 μl of MAT2β V1/V2 beads at 4 °C for 2 h. The beads were washed with binding buffer, and the bound proteins were eluted with elution buffer (20 mm Tris, pH 8.0, 500 mm NaCl, 6 m Urea, and 2 mm 1% Triton X-100). Purified V1 and V2 proteins and their binding proteins were compared by silver staining of SDS-PAGE gels.
In Solution Digestion and Liquid Chromatography Tandem Mass Spectrometry
Mass spectrometry was performed as described (6). Proteins were digested by trypsin directly in solution. Peptides were analyzed by capillary electrospray ionization-liquid chromatography/tandem mass spectrometry on a linear ion trap LTQ (Thermo Electron, Inc.) mass spectrometer. Data were analyzed using Bioworks 3.2, utilizing the SEQUEST algorithm and Sage-N Sorcerer to determine cross-correlation scores between acquired spectra and NCBI protein FASTA databases. The following parameters were used for the TurboSEQUEST search: molecular weight range, 0–5000; threshold, 1000; monoisotopic; precursor mass, 1.4; group scan, 10; minimum ion count, 20; charge state, auto; peptide, 1.5; fragment ions, 0; and static amino acid modifications, Cys 57.05 and Met 15.99. Results were filtered using SEQUEST cross-correlation scores of >2.0 for +1 ions, 3.0 for +2 ions, and 3.5 for +3 ions.
Cell Transfection and Gene Expression Analysis
The expression plasmids pcDNA3.1D/V5-His/MAT2β V1 (V1 expression vector) or pcDNA3.1D/V5-His/MAT2β V2 (V2 expression vector) have been described previously (4). To overexpress MAT2β variant proteins in HuH-7 cells, 90% confluent HuH-7 cells were transiently transfected with the V1 or V2 plasmids using Lipofectamine 2000 (Invitrogen) following the manufacturer's instructions. In some experiments HuH-7 cells were co-transfected with V1 or V2 expression vector and 30 nm siRNA against HuR (CAC GCU GAA CGG CUU GAG GUU (sense) and CCU CAA GCC GUU CAG CGU GUU (antisense)), 60 nm siRNA against cyclin A (Santa Cruz Biotechnology, Santa Cruz, CA), 40 nm siRNA against cyclin D1 (Santa Cruz Biotechnology), or scrambled control using Lipofectamine 2000 (Invitrogen) for 48 h according to the manufacturer's protocol. In separate experiments, RKO cells were transfected with siRNA against V1, V2, or scrambled control as we described (4) for 48 h. Cell lysates were prepared 48 h after transfection for further experiments. Total cell RNA for quantitative real-time PCR was extracted by using the Total RNA Isolation Kit (BioMega, San Diego, CA) and subjected to reverse transcription by Moloney murine leukemia virus reverse transcriptase (Invitrogen). A total of 2 μl of reverse transcription product was subjected to quantitative real-time PCR analysis. The primers and TaqMan probes for HuR, cyclin D1, and cyclin A were purchased from ABI (Foster City, CA). Hypoxanthine phosphoribosyltransferase 1 was used as a housekeeping gene as described (7). The quantitative real-time PCR was performed as described previously (8).
Immunoprecipitation
HuH-7 cells were transfected with V1 or V2 expression vectors, or empty vector control that contain a V5 tag for 48 h. Cells lysates were prepared by scraping cells into radioimmune precipitation assay buffer (50 mm Tris-HCl, pH 8.0, 150 mm NaCl, 1% (v/v) Nonidet P-40, 0.1% (w/v) SDS, and protease inhibitor mixture tablets (Roche Molecular Biochemicals), followed by centrifugation at 12,000 rpm for 30 min. Protein A/G beads (Santa Cruz Biotechnology) were used to clear the cell lysates for 1 h at 4 °C. A total of 500 μg of cell lysate was immunoprecipitated with 2 μg of anti-V5 (Invitrogen) or normal IgG antibody (Santa Cruz Biotechnology) for 16 h at 4 °C on a rotator. Protein A/G beads were added and incubated for another 4 h. Beads were washed three times with radioimmune precipitation assay buffer and subjected to SDS-PAGE. Western blot was performed for HuR with anti-HuR antibody (Santa Cruz Biotechnology). The reverse direction immunoprecipitation was carried out in HuH-7 cells overexpressing V1 or V2 and HepG2 and RKO cells. Cell lysates were processed for immunoprecipitation with anti-HuR antibody, and blots were probed with antibody against V5 (Invitrogen) or MAT2β (Novus Biologicals, Littleton, CO).
Nuclear and Cytosolic Protein Separation and Western Blot Analysis
Nuclear and cytosolic proteins were separated with an NE-PER Nuclear and Cytoplasmic Extraction Kit (Pierce) following the manufacturer's instructions. The protein concentrations were determined by using a Bio-Rad Protein Assay kit. Equal amounts of proteins were resolved in 12% SDS-polyacrylamide gels and electrophoretically transferred to nitrocellulose membranes. Blots were probed with antibodies against V5, MAT2β, and HuR. Histone 3 and α-tubulin (Cell Signaling) were used as loading controls for nuclear and cytosolic proteins, respectively. Western blot analysis for MAT2β was also done using whole cell lysates from HuH-7 cells overexpressing V1, V2 or empty vector control, HCC, and adjacent non-cancerous tissues using actin as loading control. Blots were developed by enhanced chemiluminescence.
Immunofluorescence and Confocal Microscopy
HuH-7 cells were plated in 24-well plates containing coverslips. 48 h after transfection with V1 or V2 overexpression vectors or empty vector, cells were fixed and permeabilized with 4% paraformaldehyde for 15 min at room temperature and ice-cold methanol for 15 min at −20 °C. A 5% goat serum solution in phosphate-buffered saline was used to block the cells for 1 h at 37 °C. Cells were incubated for 1 h at room temperature with each primary antibody and then with an Alexa Fluor 488-conjugated secondary antibody (Invitrogen) for 1 h at room temperature. Nuclei were stained with Hoechst 33342 (Sigma) for 5 min at room temperature. Slides were mounted with Dako fluorescent mounting medium and analyzed with an Eclipse TE300 confocal microscope (Nikon Instruments Inc., Melville, NY).
Cell Proliferation Assay
HuH-7 cells were plated on a 96-well plate (∼30% confluent) and cotransfected with V1 or V2 expression vector and 30 nm siRNA against HuR, 60 nm siRNA against cyclin A, 40 nm siRNA against cyclin D1, or scrambled control using Lipofectamine 2000 (Invitrogen) for 48 h according to the manufacturer's protocol. The EdU (5-ethynyl-2′-deoxyuridine, an alternative to bromodeoxyuridine for measuring new DNA synthesis) incorporation was measured with the Click-iT® EdU Microplate Assay kit (Invitrogen).
Statistical Analysis
Data are given as mean ± S.E. Statistical analysis was performed using Student t test for comparison of paired samples and analysis of variance followed by Fisher test for multiple comparisons. Significance was defined by p < 0.05.
RESULTS AND DISCUSSION
Purification of MAT2β V1 and V2 and Identification of Interacting Proteins
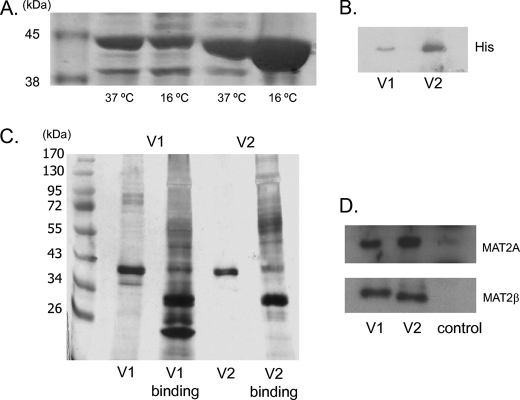
To express recombinant human MAT2β V1 or V2, the full-length cDNA was cloned into the expression vector pET-28a (+) as a His-tagged fusion protein. Fig. 1A shows a Coomassie Blue staining of purified proteins obtained from bacteria overexpressing either V1 or V2 grown at 37 °C or 16 °C subjected to SDS-PAGE. In most cases higher temperature increases the level of protein expression but decreases protein solubility. At present we don't know why the two variant proteins differ in the optimum growth temperature. MAT2β V1 expressed at 37 °C and MAT2β V2 expressed at 16 °C were further purified by gel-filtration chromatography. Imidazole gradient elution and an ion-exchange column did not further improve MAT2β V1 purity. The purity of MAT2β V1 was 92%, and the purity of V2 exceeded 99% as measured by performing densitometry of silver-stained gels. Fig. 1B confirms the presence of the V1 and V2 proteins on Western blot analysis using antibodies against His. These purified V1 and V2 proteins were then used as bait to identify interacting proteins from total RKO cell lysates. Fig. 1C shows silver staining of the proteins obtained. The eluted lysates were subjected to both Western blot analyses for MATII and β subunit (Fig. 1D) and in solution proteomic analysis twice. Controls used His-tagged c-Myc overexpression vector to verify specificity of protein binding. There was agreement in 60% of the proteins identified from both in-solution proteomics, and they are listed in Table 1. A number of proteins was identified from this analysis to bind to both V1 and V2, and they include MATII (α2), MAT2β, DEAD box polypeptide 1, splicing factor 3b subunit 3, pre-mRNA cleavage factor 1, and several heat shock proteins (Table 1). HuR mRNA-stabilizing protein, asparaginyl-tRNA synthetase, cleavage and polyadenylation specificity factor 6 are proteins identified that bind only to V1. Those that bind only to V2 include stem cell growth factor precursor, and G-protein-coupled receptor kinase-interactor 1.
FIGURE 1.
Purification of MAT2β V1 and V2 and identification of interacting proteins. A, V1 and V2 were overexpressed in Rosetta pLysS cells and purified by nickel-nitrilotriacetic acid. The SDS-PAGE gel illustrates His-tagged V1 and V2 proteins expressed with isopropyl 1-thio-β-d-galactopyranoside induction at 37 °C or 16 °C. 5 μl of V1 or V2 beads was heated in SDS loading buffer and run on a 12% SDS-PAGE gel. Proteins purified by nickel-nitrilotriacetic acid were visualized with Coomassie Blue staining. B, Western blot analysis for His tag was performed to confirm His-tagged V1 protein expressed at 37 °C and V2 protein expressed at 16 °C. C, SDS-PAGE gel demonstrating proteins binding with V1 or V2. Pulldown experiments were performed using RKO cell lysate and His-tagged V1 or V2. 20 μg of binding proteins and 5 μl of V1 or V2 beads were separated by 12% SDS-PAGE and visualized with silver staining. D, Western blot analyses of MAT2A and MAT2β-encoded proteins, which were present in the eluted proteins after V1 or V2 pulldown assay but not in the control (His-tagged c-Myc expression vector).
TABLE 1.
Proteins interacting with V1 and V2
Proteins were identified with capillary electrospray ionization-liquid chromatography/tandem mass spectrometry. The Xcorr score was calculated by using SEQUEST.
| Protein name | Xcorr score | Molecular mass | Accession no. | Peptide hitsa |
|---|---|---|---|---|
| kDa | ||||
| Proteins interacting with both V1 and V2 | ||||
| Methionine adenosyltransferase II, β | 20.24 | 36,401.2 | 33519455 | 8 |
| Methionine adenosyltransferase II, α | 10.21 | 43,642.4 | 5174529 | 1 |
| DEAD box polypeptide 1 | 20.10 | 82,413.6 | 4826686 | 2 |
| Splicing factor 3b, subunit 3 | 30.13 | 135,576.4 | 54112121 | 4 |
| Pre-mRNA cleavage factor I | 10.16 | 52,031.6 | 24432016 | 1 |
| Heat shock 70-kDa protein 5 | 20.19 | 72,314.4 | 16507237 | 2 |
| Heat shock 70-kDa protein 9B precursor | 10.16 | 73,662.0 | 24234688 | 1 |
| Proteins interacting with only V1 | ||||
| Asparaginyl-tRNA synthetase | 20.26 | 62,924.5 | 4758762 | 2 |
| Cytoskeleton-associated protein 4 | 20.31 | 66,004.0 | 19920317 | 3 |
| HuR mRNA-stabilizing protein | 10.16 | 36,073.6 | 38201714 | 1 |
| Cleavage and polyadenylation specific factor 6 | 40.30 | 59,208.4 | 5901928 | 18 |
| Proteins interacting with only V2 | ||||
| ATP-dependent RNA helicase DDX3 | 20.16 | 73,224.9 | 4504489 | 2 |
| Stem cell growth factor precursor | 10.16 | 35,676.4 | 4506803 | 1 |
| G-protein-coupled receptor kinase-interactor 1 | 10.11 | 84,312.4 | 7661712 | 1 |
| DnaJ subfamily A member 2 | 10.25 | 45,727.3 | 5030741 | 1 |
a Peptide hits are the total number of peptides matched.
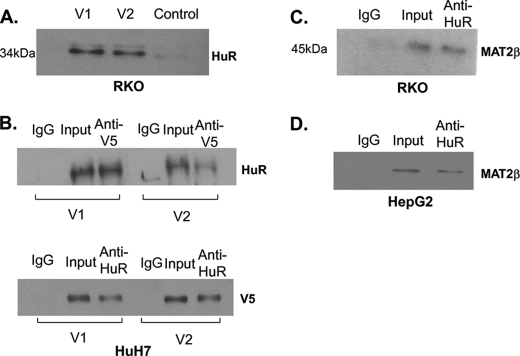
Experimental limitations in mass spectrometry-based proteomics methods can result both in false positives and false negatives interactions (9). As a consequence, proteomics results must be validated using additional approaches and models. To confirm data obtained from proteomics, we next took RKO cell lysates that had been subjected to pulldown assay with either V1 or V2 protein (control was His-tagged c-Myc expression vector) and performed Western blot for HuR. Fig. 2A shows that HuR is definitely one of the proteins that interacted not only with V1 but also with V2. To further ensure that they interact, we also overexpressed V1 or V2 (using expression vector that has both V5 and His tags) in HuH-7 cells (express MAT2β minimally) for 48 h as we described (4), immunoprecipitated the cell lysate with anti-V5 or HuR antibodies, and then performed Western blot for HuR or V5, respectively. Fig. 2B shows that HuR interacted with these recombinant proteins when overexpressed. To see if there is endogenous interaction, we immunoprecipitated HuR in both RKO and HepG2 cells (both cell types express high levels of MAT2β variants) and Western blot analyses confirmed MAT2β-encoded protein interact with HuR (Fig. 2, C and D).
FIGURE 2.
Interaction of HuR with MAT2β V1 and V2. A, validation of HuR in the pulldown assay of V1 and V2 by Western blot (control was His-tagged c-Myc expression vector). B, Western blot for HuR or V5 was carried out after immunoprecipitation with anti-V5, anti-HuR, or normal IgG antibodies in HuH-7 cells 48 h after transfection with V1 or V2 expression vectors as described under “Experimental Procedures.” 1% volume of HuH-7 cell lysates used for immunoprecipitation was loaded as input. C and D, Western blot for MAT2β was performed after immunoprecipitation with anti-HuR or normal IgG antibodies in RKO and HepG2 cells.
Intracellular Localization of MAT2β Variants
Given the fact that many of these proteins are mostly nuclear, we became intrigued by whether these variants may be present in the nucleus and whether they regulate HuR subcellular content. Importantly, HuR is known to stabilize the mRNA of many cyclins (cyclin D1 and cyclin A) that are required for cell cycle progression (10). If the MAT2β variants interact with HuR and regulate its subcellular content, this may be one mechanism by which these variants regulate growth.
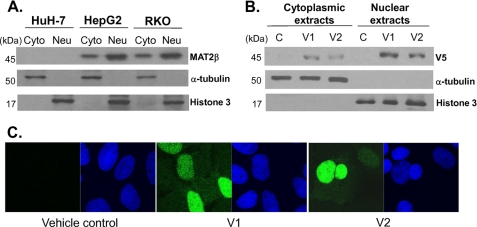
Western blot analyses (Fig. 3A) show that, although HuH-7 hardly expresses any MAT2β, HepG2 and RKO cells express MAT2β in both the nucleus and cytoplasm, with nuclear fraction dominating over the cytoplasmic. MAT2β variants' localization was explored with HuH-7 cells that overexpress V5-tagged V1 or V2 for 48 h. Western blot analyses show that, similar to the endogenous expression pattern, both variants are expressed in both the nucleus and cytoplasm with nuclear fraction dominating (Fig. 3B), and confocal microscopy confirms the presence of predominantly nuclear localization of V1 and V2 (Fig. 3C, green fluorescence detects V5, and nuclei are stained blue).
FIGURE 3.
Intracellular localization of MAT2β variant proteins. A, cytoplasmic (Cyto) and nuclear (Neu) fractions of HuH-7, HepG2, and RKO cells were separated and subjected to Western blot analysis for MAT2β, histone 3, and α-tubulin as described under “Experimental Procedures.” Each lane contains 10 μg of protein. B, HuH-7 cells were transfected with V1 or V2 expression vectors for 48 h. Cytoplasmic and nuclear fractions were separated and subjected to Western blot analysis for V5 tag, α-tubulin, and histone 3 as described under “Experimental Procedures.” C, immunofluorescent detection of V5 tag (green by the Alexa Fluor 488-conjugated secondary antibody) in HuH-7 cells that were transfected with either empty vector or V1 or V2 expression vectors for 48 h. Nuclei were visualized with Hoechst staining (blue).
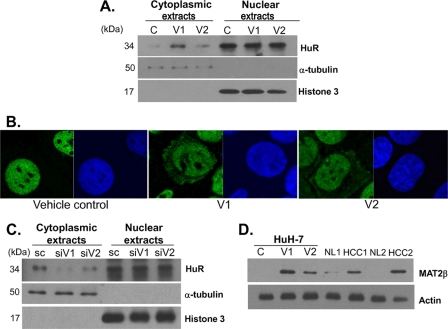
Next we overexpressed V1 or V2 in HuH-7 cells and examined the effect on the subcellular localization of HuR. Fig. 4 shows that, when either V1 or V2 is overexpressed, there is more HuR in the cytoplasm. This is demonstrated by both Western blot analyses of nuclear and cytoplasmic fractions (Fig. 4A) as well as confocal microscopy using green fluorescent protein that detects HuR (Fig. 4B). Densitometric analysis shows V1 or V2 overexpression in HuH7 cells increased cytoplasmic HuR by 44 ± 9% and 21 ± 5%, respectively (p < 0.05 versus empty vector control from three independent experiments). Conversely, knockdown of endogenously expressed V1 or V2 in RKO cells decreased cytoplasmic HuR by 65 ± 6% and 26 ± 4%, respectively (p < 0.05 versus scrambled or SC control from three independent experiments). Taken together, these results provide compelling evidence that the level of V1 or V2 expression modulates HuR subcellular content, with higher V1 or V2 expression increasing cytoplasmic HuR content.
FIGURE 4.
Effect of MAT2β expression on the subcellular localization of HuR. A, Western blot analysis for HuR levels in the cytoplasmic and nuclear extract prepared from HuH-7 cells that were transfected with V1 or V2 expression vectors for 48 h. α-Tubulin and histone 3 were used as loading controls. B, immunofluorescent detection of HuR (green by the Alexa Fluor 488-conjugated secondary antibody) in HuH-7 cells that were transfected with either empty vector or V1 or V2 expression vectors for 48 h. Nuclei were visualized with Hoechst staining (blue). C, effect of V1 or V2 knockdown on subcellular HuR levels. RKO cells were treated with siRNA against V1, V2, or scrambled control (SC) for 48 h, and HuR protein expression was examined in cytoplasmic and nuclear extracts as above using α-tubulin and histone 3 as loading controls for the respective compartments. Western blots are representative of three independent experiments. D, Western blot analysis for MAT2β levels in the cell lysate of HuH-7 cells that were transfected with V1 or V2 expression vectors for 48 h as compared with paired HCC and adjacent non-transformed liver (NL) tissue. Actin served as loading control.
To see whether the level of the overexpressed V1 or V2 is physiologically relevant, we compared MAT2β protein level in HuH-7 cells overexpressing V1 or V2 to those in paired HCC and adjacent non-transformed liver tissues (Fig. 4D). The magnitude of increase in MAT2β protein level is ∼150-fold in V1- or V2-overexpressing HuH-7 cells, because the baseline expression is absent. Likewise, MAT2β is not expressed in normal liver (2, 4), and the level of MAT2β protein in HCC specimens is comparable to HuH-7 cells overexpressing V1 or V2. There is a faint MAT2β band seen in NL1, which may be due to the fact that MAT2β is induced in cirrhosis, which is almost always present in the setting of HCC (2).
Effect of MAT2β Expression on HuR Target Genes
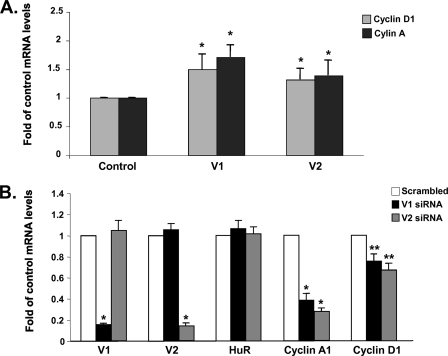
We next examined the outcome of V1 or V2 expression on known HuR targets, such as cyclin D1 and cyclin A (10). Overexpression of either variant in HuH-7 cells increased the mRNA levels of cyclin D1 and cyclin A by ∼50% (Fig. 5A) and conversely, knockdown of V1 or V2 in RKO cells decreased the mRNA levels of both cyclin A and cyclin D1, with the inhibitory effect much more pronounced on cyclin A (Fig. 5B).
FIGURE 5.
Effect of MAT2β expression on HuR target genes. A, HuH-7 cells were transfected with V1 or V2 expression vectors for 48 h, and cyclin D1 and cyclin A mRNA levels were determined by real-time PCR. Results are mean ± S.E. from three experiments; *, p < 0.05 versus control (empty vector) group. B, RKO cells were treated with siRNA against V1, V2, or scrambled control for 48 h, and HuR, cyclin A, and cyclin D1 mRNA levels were determined by real-time PCR. Results are mean ± S.E. from three experiments; *, p < 0.001 versus scrambled; **, p < 0.05 versus scrambled.
The Inductive Effect of V1 or V2 on Expression of Cyclins Requires Normal HuR Content
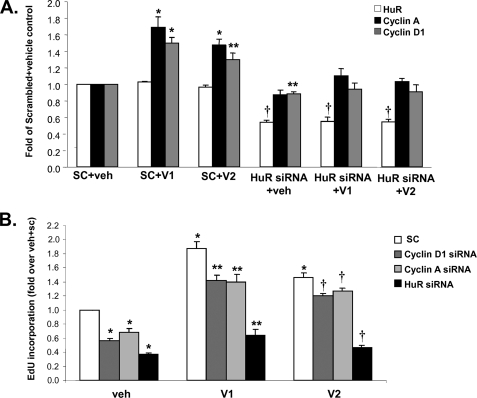
To see if the inductive effect of V1 and V2 on the expression of cyclins requires HuR, HuH-7 cells were co-transfected with V1 or V2 expression vector and siRNA against HuR. Fig. 6A shows that, when HuR expression is reduced by 50%, V1 or V2 overexpression no longer induced the expression of either cyclin A or D1.
FIGURE 6.
Inductive effect of MAT2β V1 and V2 on expression of cyclins and growth requires normal cyclin A, cyclin D1, and HuR content. A, HuH-7 cells were co-transfected with V1 or V2 expression vector (or empty vector, veh), and siRNA against HuR or scrambled siRNA for 48 h and HuR, cyclin A, and cyclin D1 mRNA levels were determined by real-time PCR. Results are mean ± S.E. from three experiments and expressed as -fold of scrambled (SC) plus vehicle (veh) control; *, p < 0.01; **, p < 0.05; †, p < 0.001 versus SC plus veh. B, HuH-7 cells were co-transfected with V1 or V2 expression vector (or empty vector) and siRNA against cyclin A, cyclin D1, HuR or scrambled for 48 h, and cell growth was measured with the Click-iT® EdU Microplate Assay. Results are mean ± S.E. from four experiments and expressed as -fold of scrambled (SC) plus vehicle (veh) control; *, p < 0.01 versus SC plus veh; **, p < 0.01 versus SC plus V1; †, p < 0.01 versus SC plus V2.
The Inductive Effect of V1 or V2 on Growth Requires Normal Cyclin A, Cyclin D1, and HuR Expression
To see if the increase in cyclin A, cyclin D1, and cytoplasmic HuR content is required for V1 or V2 to exert its growth inductive effect, HuH-7 cells were co-transfected with V1 or V2 and siRNA against cyclin A, cyclin D1, HuR, or scrambled control. The efficiency of cyclin A and D1 knockdown on respective expression was 54 and 70%, respectively. Although V1 or V2 overexpression was still able to increase growth in the presence of either cyclin A or cyclin D1 siRNA, the effect was blunted as compared with scrambled control (Fig. 6B). More importantly, when HuR was knocked down by 50%, the inductive effects of V1 or V2 on cell growth was nearly eliminated (Fig. 6B). The difference likely reflects the fact that HuR has many other targets besides just these two cyclins that may further contribute to decreased growth.
Summary and Speculations
Taken together, of the targets identified by proteomics thus far that interact with MAT2β variants, we have confirmed that HuR interacts with these variants and its cytoplasmic content is increased when either MAT2β variant is overexpressed, resulting in increased cyclin D1 and cyclin A expression, which is consistent with our previous report of increased growth (4). Conversely, knockdown of endogenously expressed V1 or V2 reduced cytoplasmic HuR level and the expression of HuR targets. Our results support the conclusion that the ability of V1 and V2 to interact and modulate HuR subcellular content is a key mechanism for the effect these MAT2β variants have on growth. Because MAT2β is not expressed in all tissues and indeed, not expressed in HuH-7 cells, one can argue that it may not be important in controlling growth. However, in HCC MAT2β is greatly induced, and our current findings further support that this can enhance HCC growth. Whether MAT2β is induced in other cancers has not been examined and is worthy of investigation to see if this is a general mechanism to enhance cancer growth.
Although both MAT2β variant proteins promote growth, they seem to differ in the magnitude of this effect. V1 exerts a stronger effect than V2 on cyclin expression and growth and may be related to the fact that it also exerts a stronger effect in modulating cytoplasmic HuR content. Interestingly, although both variants increase growth, only V1 regulates apoptosis and c-Jun N-terminal kinase signaling (4). There are also differences in the tissue distribution of these two variants, with some tissues expressing predominantly V1, whereas others express V2 (4). Taken together, these observations suggest there are differences in these proteins, and the underlying mechanisms for these differences remain to be fully elucidated.
How MAT2β variants physically interact with HuR remains to be studied. These two variants differ only at their 5′-end. Given that they both interact with HuR, the interaction is likely to lie in the region shared by both. Whether or not the interaction is direct or as part of a complex is also not clearly established. These are areas that will need to be clarified in future investigation. In addition, there are many other interesting targets identified by proteomics that need to be further investigated. Many of these proteins are nuclear and involved in mRNA splicing, which suggests MAT2β variants have even more diverse functions than growth and death regulation. Given that, up until very recently, the only function known of MAT2β was to regulate the enzymatic activity of MATII, this gene has come a long way to claim its significance in biology and pathobiology.
Acknowledgment
We thank Dr. Lin Chen for allowing access to several key instruments needed for our studies.
This work was supported, in whole or in part, by National Institutes of Health Grants DK51719 (to S. C. L.), AT004896 (to S. C. L. and J. M. M.), and GM065325 (to E. Z.). This work was also supported by Plan Nacional of I+D SAF 2008-04800 and HEPADIP-EULSHM-CT-205 (to J. M. M.). HepG2, HuH-7, and RKO cells were provided by the Cell Culture Core, confocal microscope was provided by the Cell and Tissue Imaging Core, and in solution proteomics was provided by USC and Mass Spectrometry-based Proteomics Core of the USC Research Center for Liver Diseases (Grant DK48522).
- MAT
- methionine adenosyltransferase
- HCC
- hepatocellular carcinoma
- EdU
- 5-ethynyl-2′-deoxyuridine
- siRNA
- small interference RNA.
REFERENCES
- 1.Lu S. C., Mato J. M. (2008) J. Gastroenterol. Hepatol. 1, S73–S77 [DOI] [PMC free article] [PubMed] [Google Scholar]
- 2.Martínez-Chantar M. L., García-Trevijano E. R., Latasa M. U., Martín-Duce A., Fortes P., Caballería J., Avila M. A., Mato J. M. (2003) Gastroenterology 124, 940–948 [DOI] [PubMed] [Google Scholar]
- 3.Ramani K., Yang H., Xia M., Ara A. I., Mato J. M., Lu S. C. (2008) Hepatology 47, 521–531 [DOI] [PMC free article] [PubMed] [Google Scholar]
- 4.Yang H., Ara A. I., Magilnick N., Xia M., Ramani K., Chen H., Lee T. D., Mato J. M., Lu S. C. (2008) Gastroenterology 134, 281–291 [DOI] [PMC free article] [PubMed] [Google Scholar]
- 5.Wang W., Fan J., Yang X., Fürer-Galban S., Lopez de Silanes I., von Kobbe C., Guo J., Georas S. N., Foufelle F., Hardie D. G., Carling D., Gorospe M. (2002) Mol. Cell. Biol. 22, 3425–3436 [DOI] [PMC free article] [PubMed] [Google Scholar]
- 6.Fukaya Y., Shimada H., Wang L. C., Zandi E., DeClerck Y. A. (2008) J. Biol. Chem. 283, 18573–18581 [DOI] [PubMed] [Google Scholar]
- 7.Vandesomeple J., De Preter K., Pattyn F., Poppe B., Van Roy N., De Paepe A., Speleman F. (2002) Genome Biol. 3, 34.1–34.11 [DOI] [PMC free article] [PubMed] [Google Scholar]
- 8.Chen H., Xia M., Lin M., Yang H., Kuhlenkamp J., Li T., Sodir N. M., Chen Y. H., Josef-Lenz H., Laird P. W., Clarke S., Mato J. M., Lu S. C. (2007) Gastroenterology 133, 207–218 [DOI] [PubMed] [Google Scholar]
- 9.Chen J., Hsu W., Lee M. L., Ng S. K. (2006) Bioinformatics 22, 1998–2004 [DOI] [PubMed] [Google Scholar]
- 10.Martínez-Chantar M. L., Vázquez-Chantada M., Garnacho M., Latasa M. U., Varela-Rey M., Dotor J., Santamaria M., Martínez-Cruz L. A., Parada L. A., Lu S. C., Mato J. M. (2006) Gastroenterology 131, 223–232 [DOI] [PubMed] [Google Scholar]


