

Abstract
This work aimed to demonstrate a new method to determine diffusivities in blood and to show how urea transport is affected by blood cells. Diffusivities of urea in suspensions of bovine erythrocytes in bovine albumin solutions were determined in a two-layer membraneless microfluidic device as a function of interfacial shear rate and hematocrit. The experiments validated the measurement system at zero hematocrit and provided measurements at finite hematocrits, unobtainable in static systems. Both obstruction of diffusion by unsheared and thus non-rotating cells and augmentation of diffusion by cells rotating in response to shear were demonstrated.
Keywords: Shear rate, microfluidics, complex fluid, diffusivity, urea, hematocrit, diffusion coefficient
Introduction
Blood purification requires diffusion of molecules through blood. Blood is a complex fluid and is expected to show diffusion-like behavior different from other complex fluids and that dictated by the continuous-phase molecular diffusivity acting alone. This study aimed to show the effect of shear rate and hematocrit on the diffusive transport of urea in a 5% bovine serum albumin (BSA) and erythrocyte suspension, while validating a method for measuring diffusive movement anywhere within a suspension in shear flow in blood.
Shape, size, and concentration of blood cells induce movements that would not appear in a homogeneous fluid.1, 2 Erythrocytes can obstruct transport by lengthening the diffusion path through the continuous medium. However, sheared erythrocytes can rotate and collide, creating small regions of convection that raise the apparent diffusion coefficient.
Few recent measurements of molecular transport in blood exist, and older measurements were made in less sensitive macroscopic environments. Any measurement of diffusion in blood must occur in moving fluid, obviating classical, static measurements. Axial dispersion has been used to estimate diffusion in a flowing fluid, with a theory developed by Taylor.3 Turitto et al.4 utilized this method to determine the diffusivity of platelets in blood. Similarly, Bello et al.5 utilized the method to evaluate diffusivity for molecules in blood. However, this method requires the velocity profile of the flow, which for blood is not well known, and it is most suitable for particles whose apparent diffusivity is low.
Wang and Keller6 applied electrochemical methods to determine the diffusivity of ferricyanide in human, bovine and rabbit RBC suspensions using Couette flow. They found strong correlation between diffusion augmentation of ferricyanide and shear rate for a hematocrit of 40%, finding also that particle deformability did not influence results obtained in dilute suspensions. The method is restricted to solutes comprising accessible redox pairs.
Cha and Beissinger7 evaluated protein transport and the effect of shear rate and the concentration of normal or hardened ghost cells by evaluating the rate of protein accumulation at a duct wall. As hematocrit rose from 5% to 45% and shear rate from 400 to 1,400s−1, effective diffusivities increased.
Colton et al.8 studied diffusion of urea as a function of hematocrit in saline, serum, and plasma using a flat-plate dialyzer. Urea diffusivity decreased with increasing hematocrit and increased with increasing shear rate. These measurements were limited by an inaccurate estimation of solute concentration gradient in blood adjacent to a membrane in which the concentration gradient was higher.
Giddings et al.9 developed a separation device which was labeled Split-Flow-Lateral-Transport-Thin (SPLITT) fractionation. The device was adapted for measuring species transport in flowing blood and was also used to measure the diffusivity of some viruses in water.9
Yager and colleagues10, 11 developed microfluidic analytical devices that controlled and measured mass transfer in flowing blood. This work was not focused on transport mechanisms and comprehensive results were not reported.
In previous work, Leonard et al. developed a microfluidic device to determine diffusivities in flowing systems12 which was used only with homogeneous fluids. The system consisted of a thin slit with access channels carved into a stainless steel block held between two acrylic plates. The block was thick compared to the height of the slit, thus forming a high-aspect-ratio cross-section and a simple, one-dimensional flow. When data were analyzed with a simplified theory, the estimated diffusivity of BSA was found to differ by approximately 20% from its established value.
Antonini et al.13 and Hyman14 have developed mathematical models to describe augmented diffusion in flowing blood. Both models utilize the known behavior of erythrocytes in shear fields but considered only a single erythrocyte in a constant shear field. The two authors concluded that the observed diffusion augmentation is described by a non-linear combination of Brownian diffusion and particle-induced transport that is considerably smaller than the linear combination of the individual contributions. Zydney and Colton15 developed a macroscopic model to describe diffusion augmentation in suspensions. The model correlates a dimensionless diffusivity, a particle-based Peclet number, with particle size and volume fraction and requires that shear augmentation of diffusion be linear, without strong supporting evidence. Hyman’s theory differs: He predicts variation of augmentation with the square of the diffusivity.14 Zydney and Colton15 attempted to correlate data from many sources with modest overall success but with little precision in predicting the behavior of particular systems. This study aims to use a more precise methodology to identify the role of obstruction and shear-based augmentation on the diffusion of solutes, particularly urea, in blood.
Materials and Methods
Two suspensions of bovine erythrocytes identical in cellular composition were prepared. One suspension contained urea; the other did not. The suspensions were flowed concurrently within a thin, wide, slit (aspect ratio, defined as slit width over slit height, greater than 10). Molecular transfer of urea occurred across the interface between the fluids during the residence time of the fluid at the interface. The interfacial shear rate was determined by the location, within the velocity field, of the interface, which was in turn determined by the ratio of the flows of the two streams. In the shear fields studied, the shear rate varies linearly with position. However, for a typical 1s residence time, 90% of all mass transferred across the interface lies within 30μm of the interface. Shorter residence times would have reduced the range of shear rate variation but also the amount of urea transferred and hence the accuracy of the measurement.
The suspensions with different erythrocyte concentrations were assumed to behave as constant viscosity Newtonian fluids for two reasons: First, the experiments were performed in a medium devoid of fibrinogen, the principal cause of erythrocyte aggregation. Second, bovine erythrocytes are among those whose migration is lowest.16
The diffusion coefficient of urea for each interfacial shear rate was determined in the absence of erythrocytes to validate the procedure against the known molecular diffusivity of urea in homogeneous media. These measurements were followed by experiments with bovine erythrocytes (Hemostat Laboratories, Dixon, CA) suspended in 5% bovine serum albumin (Equitech-Bio Inc., Kerrville, TX) to achieve a range of hematocrits. These suspensions were also studied at each interfacial shear rate.
Device
The device and the flow system utilized are portrayed in Figure 1. The device consists of a stainless steel (SS) plate 3.81cm long, 2.85cm wide and 0.88cm thick in which slits were formed with a Mitsubishi RA 90 wire electric discharge machine (wEDM) (MC Machinery Systems, Inc., Wood Dale, IL). Four holes were drilled in the plate to serve as inflow and outflow ports. Access channels were formed to join the ports to a central flow channel. These channels were approximately 190μm wide and were angled ± 30° from the axis of the central flow channel, which was 1.5cm long and 300μm high. The width, determined by the thickness of the plate (0.88cm), gave an aspect ratio for the central flow channel of 29.3. The SS plate was covered on top and bottom by two polymethylmethacrylate plates, one with access ports matching those in the SS plate. Sealing was provided by thin silicone sheets sandwiched between each polymethylmethacrylate plate and the SS plate.
Figure 1.
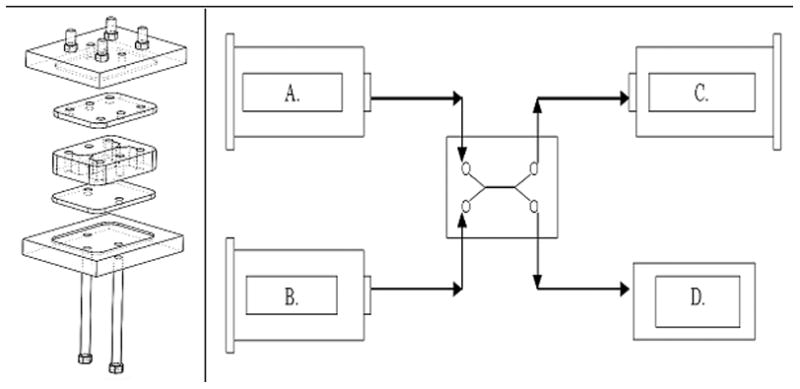
1.1. Diffusion channel flanked by silicone sheets, polumethylmethacrylate plates, and access ports. 1.2. Experimental setup with feeds and withdrawals from cell. A. Urea Rich Feed B. Urea Free Feed C. Urea Rich Withdrawal D. Urea Free Withdrawal (unregulated and equal to A+B−C)
The diffusion channel was serviced by two inlet flows and two outlet flows. Three pumps, two inlet and one outlet, were used leaving one degree of freedom in the system. Two NE-300 syringe pumps (New Era Pump, Wantagh NY) provided the inlet flows; an NE-1000 syringe pump (New Era Pump) controlled outlet flow. Three 10cc luer-lock glass syringes (Popper and Sons, Lake Success NY) were fitted to the pumps.
Operation
Erythrocyte suspensions (0 ≤ H ≤ 40) were fed into the two inlet ports. The two suspensions were flowed concurrently and then withdrawn from their corresponding sides at rates each equal to that at which they were injected. The experiments were carried out at a room temperature near 25°C. The overall flow rate through the central channel was maintained constant at 2cc/min in all experiments, but the flow rate of each stream could be set independently. As the flow rate ratio deviated from unity the location of the interface shifted and interfacial shear rates of 0, 25, 50, 75, and 100s−1 could be achieved. To find the flow rates needed to obtain a desired interfacial shear rate, the following system of equations was solved:
| [1] |
| [2] |
| [3] |
where dVx/dy is interfacial shear rate, q1 is the urea-rich flow rate, q2 is the urea-free flow rate, qT is the total flow rate (2cc/min), W is the slit width, B is the slit half height, and y is the interface location. The calculated entrance length for the experiments was 0.0108cm, yielding fully developed flow in the first percent of the flow length.
Computational flow modeling was carried out for two cases: interfacial shear rates of 0 and 100s−1 using CD-Adapco software (Star-CCM, Plymouth MI) Figure 2. The streamlines show that no flow separation should be expected and that the interface should be expected to be stable over the length of the cell, which was 30 times the width of the diffusion channel.
Figure 2.
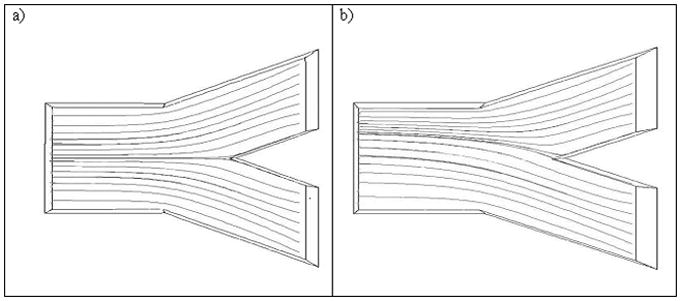
Streamlines representing the experimental system when the interfacial shear rate has a value of : a) 0s−1 and b)100s−1
Experiments were performed at hematocrits of 0, 10, 20, 30, and 40% and at each of five different interface locations. Cell suspensions were prepared and loaded into their corresponding feed syringes. The experiments each lasted approximately 5 minutes. The combined volume of the cell and the withdrawal tubing (from which the samples were collected) was approximately 3cc, so that, at the experimental flow of 2cc/min the experimental time of 5 minutes was equivalent to 3.3 system residence times, assuring that transport was measured at steady-state. Cell suspensions were loaded into their respective syringes shortly before the start of each experiment from a steadily mixed reservoir. No phase separation occurred within the syringes during the experiments. Samples collected were centrifuged for three minutes to separate the suspension and obtain cell-free albumin solution for urea analysis with a commercial assay (Bioassay Systems, Hayward CA).
Data Analysis
Diffusivities were established by determining the rate of urea transfer across the fluid interface established in the SSl cell. Leonard et al.,12 using a device functionally identical to that discussed here, determined diffusion coefficients by treating their cell as an analog to the unsteady state, static diffusion apparatus used by Loschmidt.17 Their analogy ignores the effect of shear in the flow and thus only approximates the diffusion coefficient.
Diffusion in shear-flow is described by the following partial differential equation:
| [4] |
with boundary conditions:
| [5] |
where vx is x-directed flow velocity as a function of y position, C is solute concentration, x is distance in axis of flow, y is distance orthogonal to flow,  is the diffusion coefficient, yint is the position of the interface within a shear slit flow, B is the half height of the slit of flow, C0 is the initial concentration of the high solute concentration flow, and H is the height of the high solute concentration layer in the flow. Aucoin18 developed a numerical method to solve this equation for a variety of conditions. For a given diffusion coefficient, known flows, inlet concentrations, and dimensions, the expected ratio of outlet concentrations can be calculated. Equation 4 was solved for different, assumed diffusion coefficients, and the concomitant concentration ratios in the exit streams were obtained. Figure 3 shows, for example, the regression generated for experiments where the interface is at the centerline of the diffusion channel. The calculations were made using diffusion coefficients in the neighborhood of the theoretical aqueous diffusion coefficient of urea (1.38 × 10⁻⁵ cm2/s),19
Figure 3.
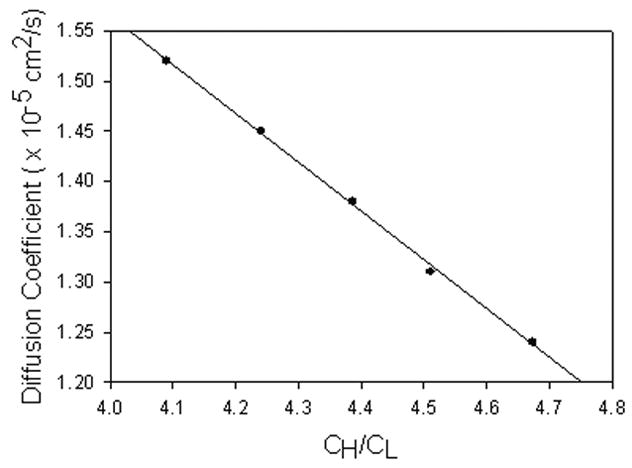
Diffusion coefficient vs. ratio of effluent stream concentrations, with interface at shear rate of 0s−1 modeled using the solution of Equation 4. y=−0.4866x +3.5114
These calculations were made for each of the five interfacial positions studied corresponding to shear rates of 0, 25, 50, 75 and 100s−1. The results were then used to estimate diffusivities consistent with the observed concentration ratios.
Experiments performed at all interfacial shear rates in the absence of bovine RBCs resulted in values of the urea diffusion coefficient between 1.24×10⁻⁵ and 1.41×10⁻⁵cm2/s. Theoretical values for the diffusion coefficient of urea in 5% BSA solution have not been previously evaluated. However, values for the diffusion coefficient of urea in similar media have been determined: 1.38×10⁻⁵cm2/s for aqueous solutions19 and 1.16×10⁻⁵cm2/s for human plasma.20 All observations presented here for cell-free media lie within this range.
Results
Figure 4 presents the apparent diffusivity of urea in 5% BSA solution as a function of hematocrit for various interface shear rates ranging from 0 to 100s−1.
Figure 4.
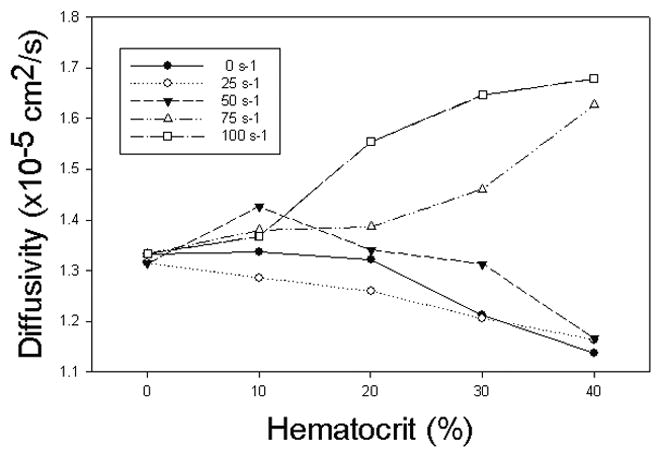
Apparent diffusion coefficient as a function of hematocrit for various interfacial shear rates.
The results show a significant effect of both variables on the apparent diffusivity. At 0s−1, the apparent diffusivity decreased with increasing hematocrit. The same was true at an interfacial shear rate of 25s−1. For an interfacial shear rate of 50s−1, the apparent diffusivity increased with hematocrit peaking at 10% above the value at zero hematocrit; for higher hematocrits it decreased. For still higher interfacial shear rates (75 and 100s−1), apparent diffusivities always increased with increasing hematocrit. The increase for an interfacial shear rate of 75s−1 exhibited a more exponential increase with volume fraction, while the increase for an interfacial shear rate of 100s−1 displayed a more asymptotic behavior.
Figure 5 presents the results as a function of interfacial shear rate for various hematocrits. As expected, in the absence of cells, the apparent diffusivity is constant for all interfacial shear rates. For all other hematocrits, it appears that the diffusivity is depressed below the zero-hematocrit value at low interfacial shear rates and is sharply increased at higher shear rates.
Figure 5.
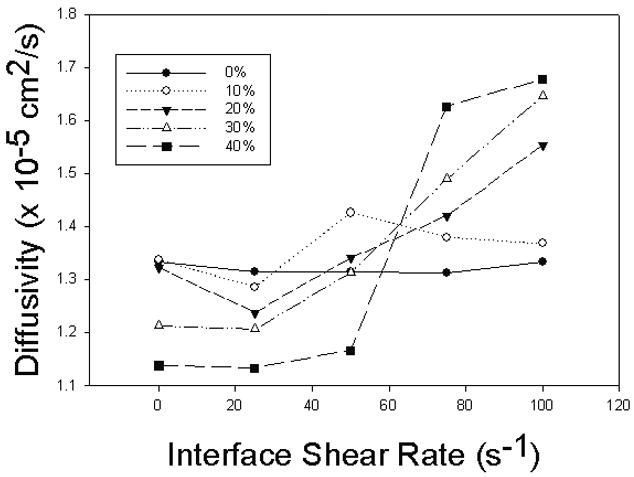
Apparent diffusion coefficient as a function of interfacial shear rate for various hematocrits. At low hematocrits the coefficient does not vary. At higher hematocrits the coefficient is initially depressed but increases sharply with shear rate.
Discussion
These results derive from a combination of physical obstruction of mass transfer by erythrocytes and the localized convection generated by displacement and rotation of individual RBCs responding to a shear field.1, 21 The relative contributions depend on hematocrit and shear rate.22 Interfacial shear rates of 0s−1 and 25s−1 caused the apparent diffusivity to decrease with increasing hematocrit. This is explained by the low shear rates near the interface, leading to little or no rotation, leaving cellular obstruction as the principal contributor.
Observations at 50s−1 show the diffusivities first increasing, and then decreasing, with hematocrit. Shear seemed to cause modest cell rotation at low concentrations, raising the apparent diffusivity. At higher cell concentrations, cell packing appeared to inhibit cell rotation and large displacements and thus to obstruct mass transport. Therefore, the apparent diffusivity deceased steadily with increasing hematocrit.
At shear rates of 75s−1 and 100s−1 the apparent diffusion coefficients increased steadily over the whole range of hematocrits. Cell rotation seems to have been always prevalent, creating localized convection that overwhelmed any obstructive contribution. Nevertheless, the results obtained at these two shear rates differ. Both have similar maxima at volume fractions of 40%, but the results at an interfacial shear rate of 75s−1 remained lower than those at 100s−1 at intermediate hematocrits. It seems that the effects of high shear always overwhelm obstruction but are ultimately limited at the higher hematocrits studied.
Cell aggregation, particularly rouleaux formation, should not have been present in the suspensions studied. In whole human blood at wall shear rates below 100s−1, axial accumulation of cells and rouleaux formation can be expected, with further obstruction of diffusion in the core of the flow where shear is very low and hematocrit is higher. Toward the edge of such flows one would expect few aggregates, but an augmentation of diffusion characterized by the extant shear rate and a hematocrit lower than the apparent, flow-average value.
The obstructive effect of a randomly dispersed, but stationary, discontinuous phase on transport through a continuum was first treated by Maxwell, with his treatment, subsequently decorated by others,23 none of whom were concerned with a convective contribution attributable to particle rotation and displacement. The stationary effect depends on the shape, volume concentration, and diffusivity within the dispersed phase. Fricke’s23 adaptation has been used previously to rationalize blockage of diffusion in blood. In Figure 6, our results at zero shear rate are compared to Fricke’s model. The model was applied presuming a prolate spheroid with a 4:1 diameter to thickness ratio and a range of ratios of intracellular to extracellular diffusion coefficients. The critical unknown, greatly outweighing the complex shape effect considered by Fricke, is the ratio of the intracellular diffusion coefficient to that of the continuum. The data at zero interfacial shear rate, shown in Figure 6, suggest both a deviation from the general Maxwellian prediction for hematocrit dependence and a higher than expected ratio of the two diffusion coefficients, about 0.7 – 0.8. Earlier reports by Steiner24 and Colton et al.8 suggest values in the neighborhood of 0.5. In previous studies, no attempt was or could be made to keep cells dispersed; in the present study, cells were dispersed but the entire diffusion field could not be kept at the zero value of shear imposed on the interface.
Figure 6.

Experimental results at interfacial shear rate of 0 s−1 divided by the aqueous diffusivity of urea for various hematocrits compared to Fricke predictions. The solid lines are predictions of the Fricke model for intracellular diffusivities of 95, 90, 85, 80, 75, 70, 65, and 60% of the bulk diffusivity.
As noted in the Introduction, most authors have considered augmentation to vary in direct proportion to a particle Peclet-number (γ̇a/D), and this approach was taken in the macroscopic analysis of Zydney and Colton,15 with only sparse evidence to support it. Studies by Antonini,13 Schwartz25 and Hyman14 all suggest augmentation effects that depend upon both shear rate and hematocrit. The effect of shear on the observed diffusion observed here was compared with the theory of Hyman using his equation 6 which implies that the ratio of apparent to molecular diffusivity should equal
| [6] |
where ω is the shear rate and a the cell radius taken as 2.5μm. The quantity f is expected to be of order unity and must be determined experimentally. Figure 7 is a plot of diffusivity ratio divided by (1−(0.25H)2/3), reflecting the observation that the intracellular diffusivity appeared reduced only to about 75% of that in the continuous phase. This correction caused the intercepts of the separate data sets to be approximately equal. Curves used to fit the data are parabolas. The second degree coefficients from these parabolas for the three highest hematocrits (where augmentation was greatest) were each divided by H2/3 and the result was averaged. After substituting for a, ω, and D, a value of approximately 2 was obtained for f, indeed of order unity.
Figure 7.
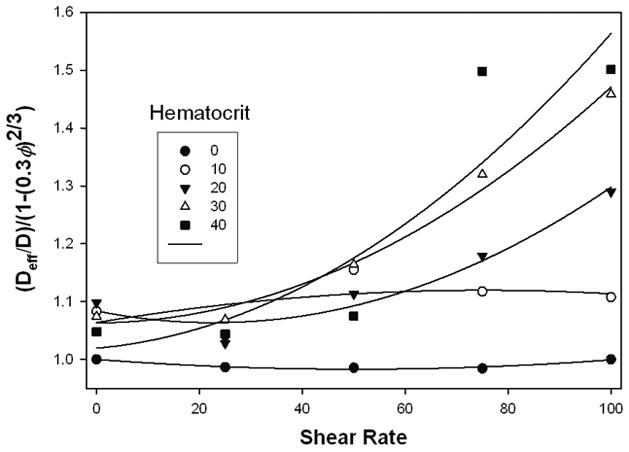
Diffusion coefficients vs. shear rate, normalized and fitted with parabolas to test the theory of Hyman, See text.
The high apparent diffusivity of urea through erythrocytes suggests that the effects found in this work might be greatly increased for other solutes with lower permeability.
Conclusion
A new and highly accurate method for measuring apparent diffusion in blood and other suspensions has been described and validated. The apparent diffusivity of urea in bovine erythrocyte suspensions has been elucidated and clearly related to obstructive and shear-activated augmentation effects on diffusion, confirming and extending a small number of considerably older measurements.
Acknowledgments
The authors are grateful for the support of the National Institutes of Health, [Grant No. 1R21HL088162-01A1], and Vizio Medical Devices LLC. They thank Professor Jeffrey Kysar for advice and permission to use his wEDM device.
Bibliography
- 1.Goldsmith HL, Mason SG. Particle Motions in Sheared Suspensions. The Spin and Rotation of Disks. Journal of Fluid Mechanics. 1962;12:88–96. [Google Scholar]
- 2.Aarts PA, Heethaar RM, Sixma JJ. Red blood cell deformability influences platelets--vessel wall interaction in flowing blood. Blood. 1984;64:1228–1233. [PubMed] [Google Scholar]
- 3.Taylor G. Conditions under Which Dispersion of a Solute in a Stream of Solvent Can Be Used to Measure Molecular Diffusion. Proceedings of the Royal Society of London Series a-Mathematical and Physical Sciences. 1954;225:473–477. [Google Scholar]
- 4.Turitto VT, Benis AM, Leonard EF. Platelet Diffusion in Flowing Blood. Industrial & Eng Chem Fund. 1972;11:216–223. [Google Scholar]
- 5.Bello MS, Rezzonico R, Righetti PG. Use of Taylor-Aris Dispersion for Measurement of a Solute Diffusion-Coefficient in Thin Capillaries. Science. 1994;266:773–776. doi: 10.1126/science.266.5186.773. [DOI] [PubMed] [Google Scholar]
- 6.Wang NHL, Keller KH. Augmented Transport of Extracellular Solutes in Concentrated Erythrocyte Suspensions in Couette-Flow. J Colloid Interface Sci. 1985;103:210–225. [Google Scholar]
- 7.Cha WN, Beissinger RL. Augmented mass transport of macromolecules in sheared suspensions to surfaces .B. Bovine serum albumin. J Colloid Interface Sci. 1996;178:1–9. [Google Scholar]
- 8.Colton CK, Smith KA, Merrill ER, Friedman S. Diffusion of Urea in Flowing Blood. Aiche Journal. 1971;17:800–807. [Google Scholar]
- 9.Giddings JC, Yang FJ, Myers MN. Flow Field-Flow Fractionation - New Method for Separating, Purifying, and Characterizing Diffusivity of Viruses. J Virology. 1977;21:131–138. doi: 10.1128/jvi.21.1.131-138.1977. [DOI] [PMC free article] [PubMed] [Google Scholar]
- 10.Hatch A, Garcia E, Yager P. Diffusion-based analysis of molecular interactions in microfluidic devices. Proceedings of the IEEE. 2004;92:126–139. [Google Scholar]
- 11.Brody JP, Yager P. Diffusion-based extraction in a microfabricated device. Sensors and Actuators a-Physical. 1997;58:13–18. [Google Scholar]
- 12.Leonard EF, Aucoin CP, Nanne EE. Measurement of diffusion in flowing complex fluids. Colloids and Surfaces a-Physicochemical and Engineering Aspects. 2006;282:75–78. doi: 10.1016/j.colsurfa.2006.02.061. [DOI] [PMC free article] [PubMed] [Google Scholar]
- 13.Antonini G, Guiffant G, Quemada D. Particle-Rotation Induced Mass-Transport in a Shear-Flow. Journal De Chimie Physique Et De Physico-Chimie Biologique. 1974;71:1123–1125. [Google Scholar]
- 14.Hyman WA. Augmented Diffusion in Flowing Blood. Journal of Engineering for Industry-Transactions of the ASME. 1975;97:58–60. [Google Scholar]
- 15.Zydney AL, Colton CK. Augmented Solute Transport in the Shear-Flow of a Concentrated Suspension. Physicochemical Hydrodynamics. 1988;10:77–96. [Google Scholar]
- 16.Spengler MI, Bertoluzzo SM, Catalani G, Rasia ML. Study on membrane fluidity and erythrocyte aggregation in equine, bovine and human species. Clinical Hemorheology and Microcirculation. 2008;38:171–176. [PubMed] [Google Scholar]
- 17.Loschmidt J. Experimental-Untersuchungen uber die Diffusion von gasen ohne porose Scheidewande, I. Sitzungsber Kais Akad Wiss. 1870;61:367. [Google Scholar]
- 18.Aucoin CP. PhD Thesis. New York (NY): Columbia University; 2009. Transverse Movement of Erythrocytes in Microfluidic Flows. [Google Scholar]
- 19.Cussler EL. Diffusion-Mass Transfer in Fluid Systems. 2. Cambridge: Cambridge University Press; 1997. [Google Scholar]
- 20.Colton CK, Smith KA, Merrill EW, Reece JM. Diffusion of organic solutes in stagnant plasma and red cell suspensions. Chemical Engineering Progress, Symposium Series. 1970;66:85–100. [Google Scholar]
- 21.Goldsmith HL, Marlow JC. Flow Behavior of Erythrocytes .2. Particle Motions in Concentrated Suspensions of Ghost Cells. Journal of Colloid and Interface Science. 1979;71:383–407. [Google Scholar]
- 22.Goldsmith HL. Microscopic flow properties of red cells. Fed Proc. 1967;26:1813–20. [PubMed] [Google Scholar]
- 23.Fricke H. The electric conductivity of disperse systems. Journal of General Physiology. 1924;6:741–746. doi: 10.1085/jgp.6.6.741. [DOI] [PMC free article] [PubMed] [Google Scholar]
- 24.Steiner CA. Mass-Transfer of Urea through Blood. Annals of Biomedical Engineering. 1981;9:217–225. doi: 10.1007/BF02363456. [DOI] [PubMed] [Google Scholar]
- 25.Schwartz AJ. Mass-Transport in Flowing Blood - Augmentation of Solute Transport near the Wall of a Circular Conduit. Annals of Biomedical Engineering. 1980;8:197–207. doi: 10.1007/BF02364476. [DOI] [PubMed] [Google Scholar]